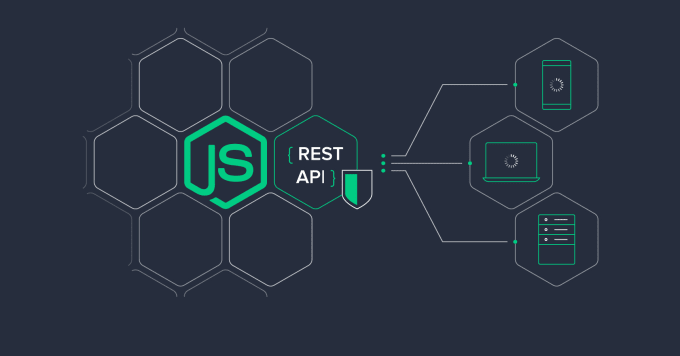
Big Data and Data Visualization with React, Node.js, and MongoDB
 Wani Geoffrey
Creating a Big Data application with data visualization using React, Node.js, and MongoDB involves multiple components and a considerable amount of code. Below, I'll provide simplified examples for each component to give you a starting point. Please note that these are simplified and won't cover all aspects of a production-ready application.
Sample Node.js Backend (server.js):
const express = require('express');
const mongoose = require('mongoose');
const bodyParser = require('body-parser');

const app = express();
const port = process.env.PORT || 3001;

// Connect to MongoDB
mongoose.connect('mongodb://localhost/bigdata_db', {
  useNewUrlParser: true,
  useUnifiedTopology: true,
});

// Define a schema and model for MongoDB
const dataSchema = new mongoose.Schema({
  name: String,
  value: Number,
});

const DataModel = mongoose.model('Data', dataSchema);

app.use(bodyParser.json());

// Create an API endpoint to fetch data
app.get('/api/data', async (req, res) => {
  try {
    const data = await DataModel.find();
    res.json(data);
  } catch (error) {
    console.error(error);
    res.status(500).json({ error: 'Internal Server Error' });
  }
});

app.listen(port, () => {
  console.log(`Server is running on port ${port}`);
});
Sample React Frontend Component (DataVisualization.js):
import React, { useState, useEffect } from 'react';
import axios from 'axios';

const DataVisualization = () => {
  const [data, setData] = useState([]);

  useEffect(() => {
    // Fetch data from the backend API
    axios.get('/api/data')
      .then((response) => {
        setData(response.data);
      })
      .catch((error) => {
        console.error(error);
      });
  }, []);

  // Example data visualization using a simple table
  const renderTable = () => {
    return (
      <table>
        <thead>
          <tr>
            <th>Name</th>
            <th>Value</th>
          </tr>
        </thead>
        <tbody>
          {data.map((item) => (
            <tr key={item._id}>
              <td>{item.name}</td>
              <td>{item.value}</td>
            </tr>
          ))}
        </tbody>
      </table>
    );
  };

  return (
    <div>
      <h2>Data Visualization</h2>
      {data.length > 0 ? renderTable() : <p>Loading data...</p>}
    </div>
  );
};

export default DataVisualization;
Sample React App (App.js):
import React from 'react';
import DataVisualization from './DataVisualization';

function App() {
  return (
    <div className="App">
      <h1>Big Data Visualization App</h1>
      <DataVisualization />
    </div>
  );
}

export default App;
In this simplified example:
The Node.js backend sets up an Express server and connects to a local MongoDB database.
It defines a data schema for MongoDB and provides an API endpoint to fetch data.
The React frontend component (
DataVisualization.js) fetches data from the backend and displays it in a simple table.The React app (
App.js) includes theDataVisualizationcomponent.
To run this example, ensure you have Node.js, MongoDB, and a React development environment set up. Also, make sure MongoDB is running locally with a database named bigdata_db and a collection named data. You can customize the MongoDB connection URL in the backend code to match your configuration.
This example demonstrates a basic setup for data retrieval and visualization. For real-world scenarios, you would likely use more sophisticated data visualization libraries and handle larger datasets with pagination, filtering, and other features.
Subscribe to my newsletter
Read articles from Wani Geoffrey directly inside your inbox. Subscribe to the newsletter, and don't miss out.
Written by

Wani Geoffrey
Wani Geoffrey
I am a software Developer with 5+years in writing robust systems using different stacks