Understanding data ingested in New Relic
 Karuppiah Natarajan
Recently I noticed that our New Relic invoices were skyrocketing 🚀 . When we planned to pay for New Relic in June 2023, based on our usage we decided to pay a maximum of 15$ per month for each of our environments - staging, sandbox and production. So, 45$ per month max. Today I saw an email that said 168$ for one of our New Relic accounts. Guess which account? Not our production account, not our staging account. It was our sandbox account!
Let's look at the New Relic invoices in each account. The sandbox account invoices look like this -

The staging account invoices look like this -
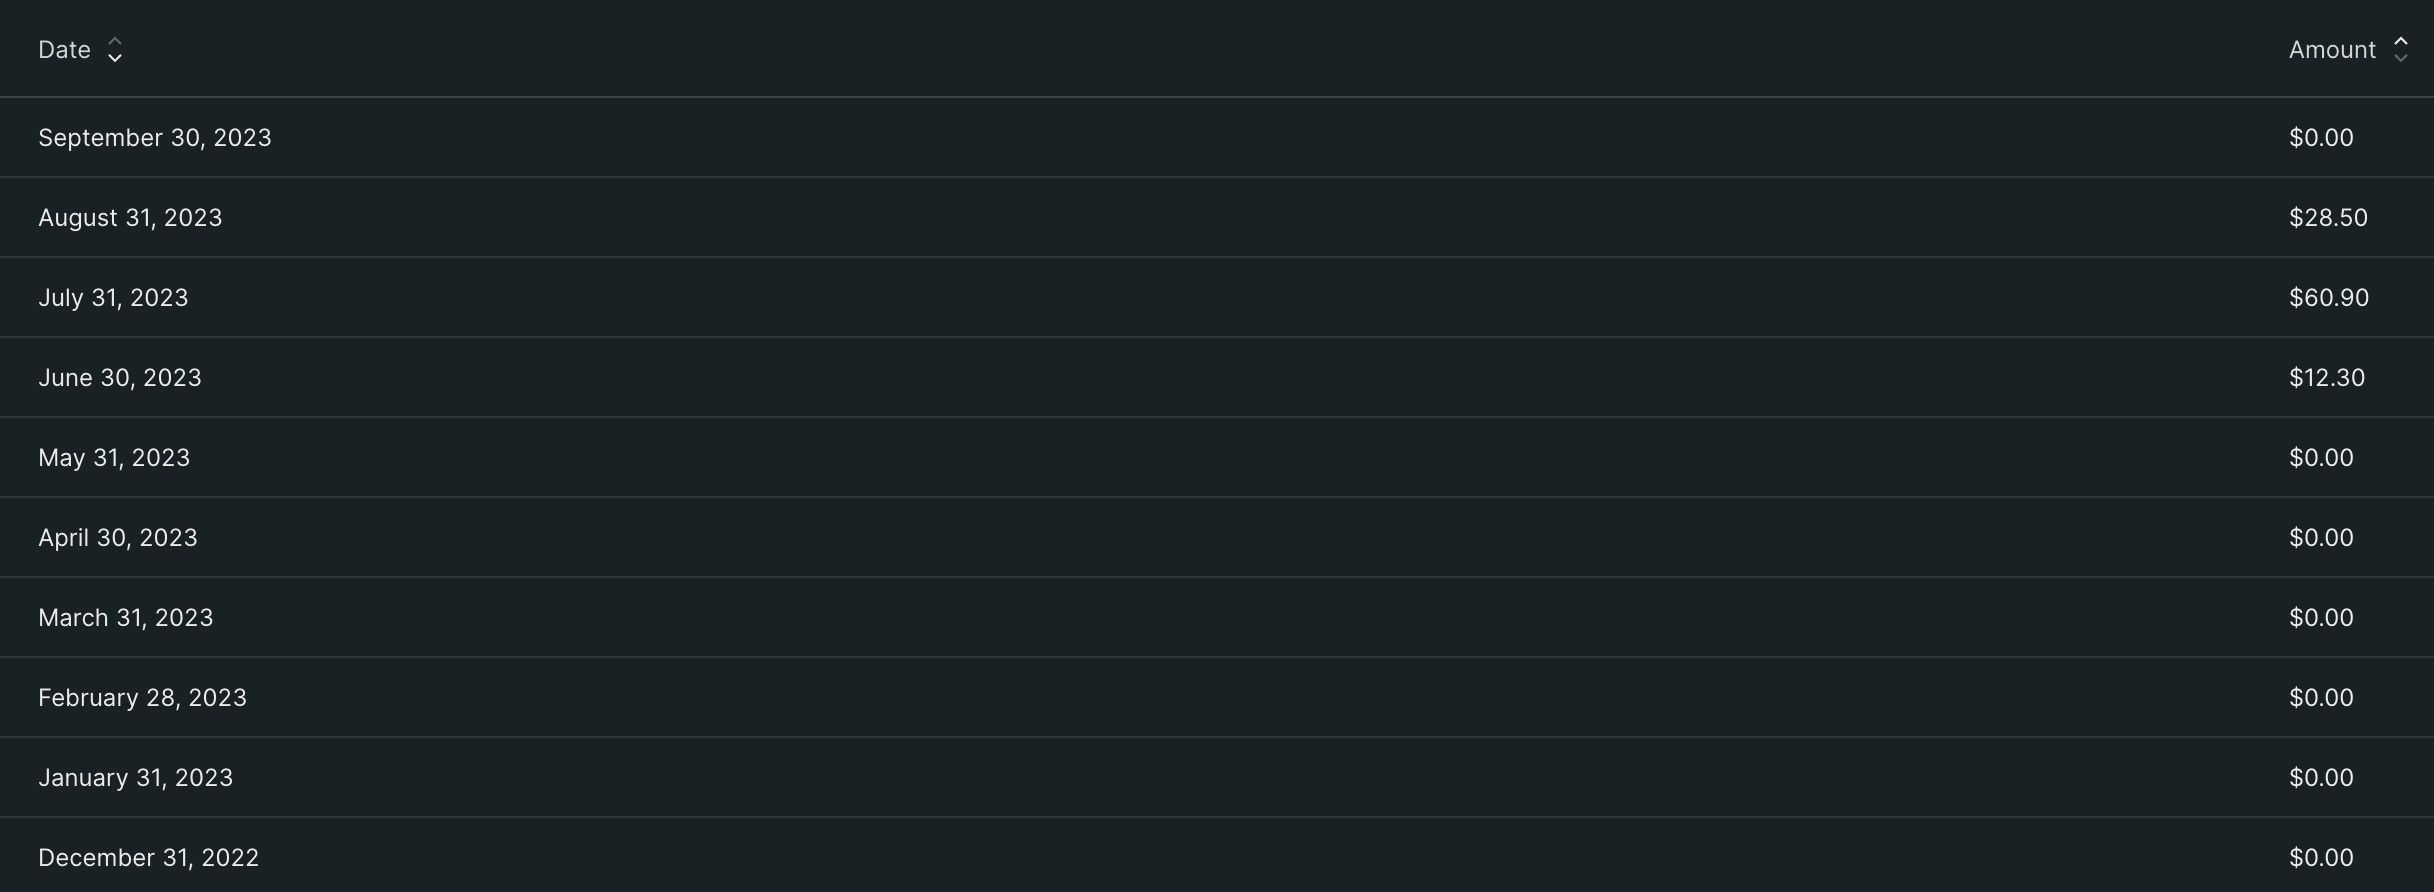
The production account invoices look like this -

For Togai, we started paying for New Relic only from June 2023, in all our accounts. So you can see data only from June 2023
You can find all this billing history data from Administration > Plan and Usage > Billing
Interesting that our sandbox account has such a high invoice, though all the environments have the same architecture and number of servers etc. Maybe staging might have fewer servers, but that's all. Monitoring is done in the same way in all environments
Let's dive into what might be causing this problem. To understand why the sandbox invoice is high, let's understand how New Relic prices things and also look at our invoice.
So, the invoice for September 2023 for our sandbox account looks like this -
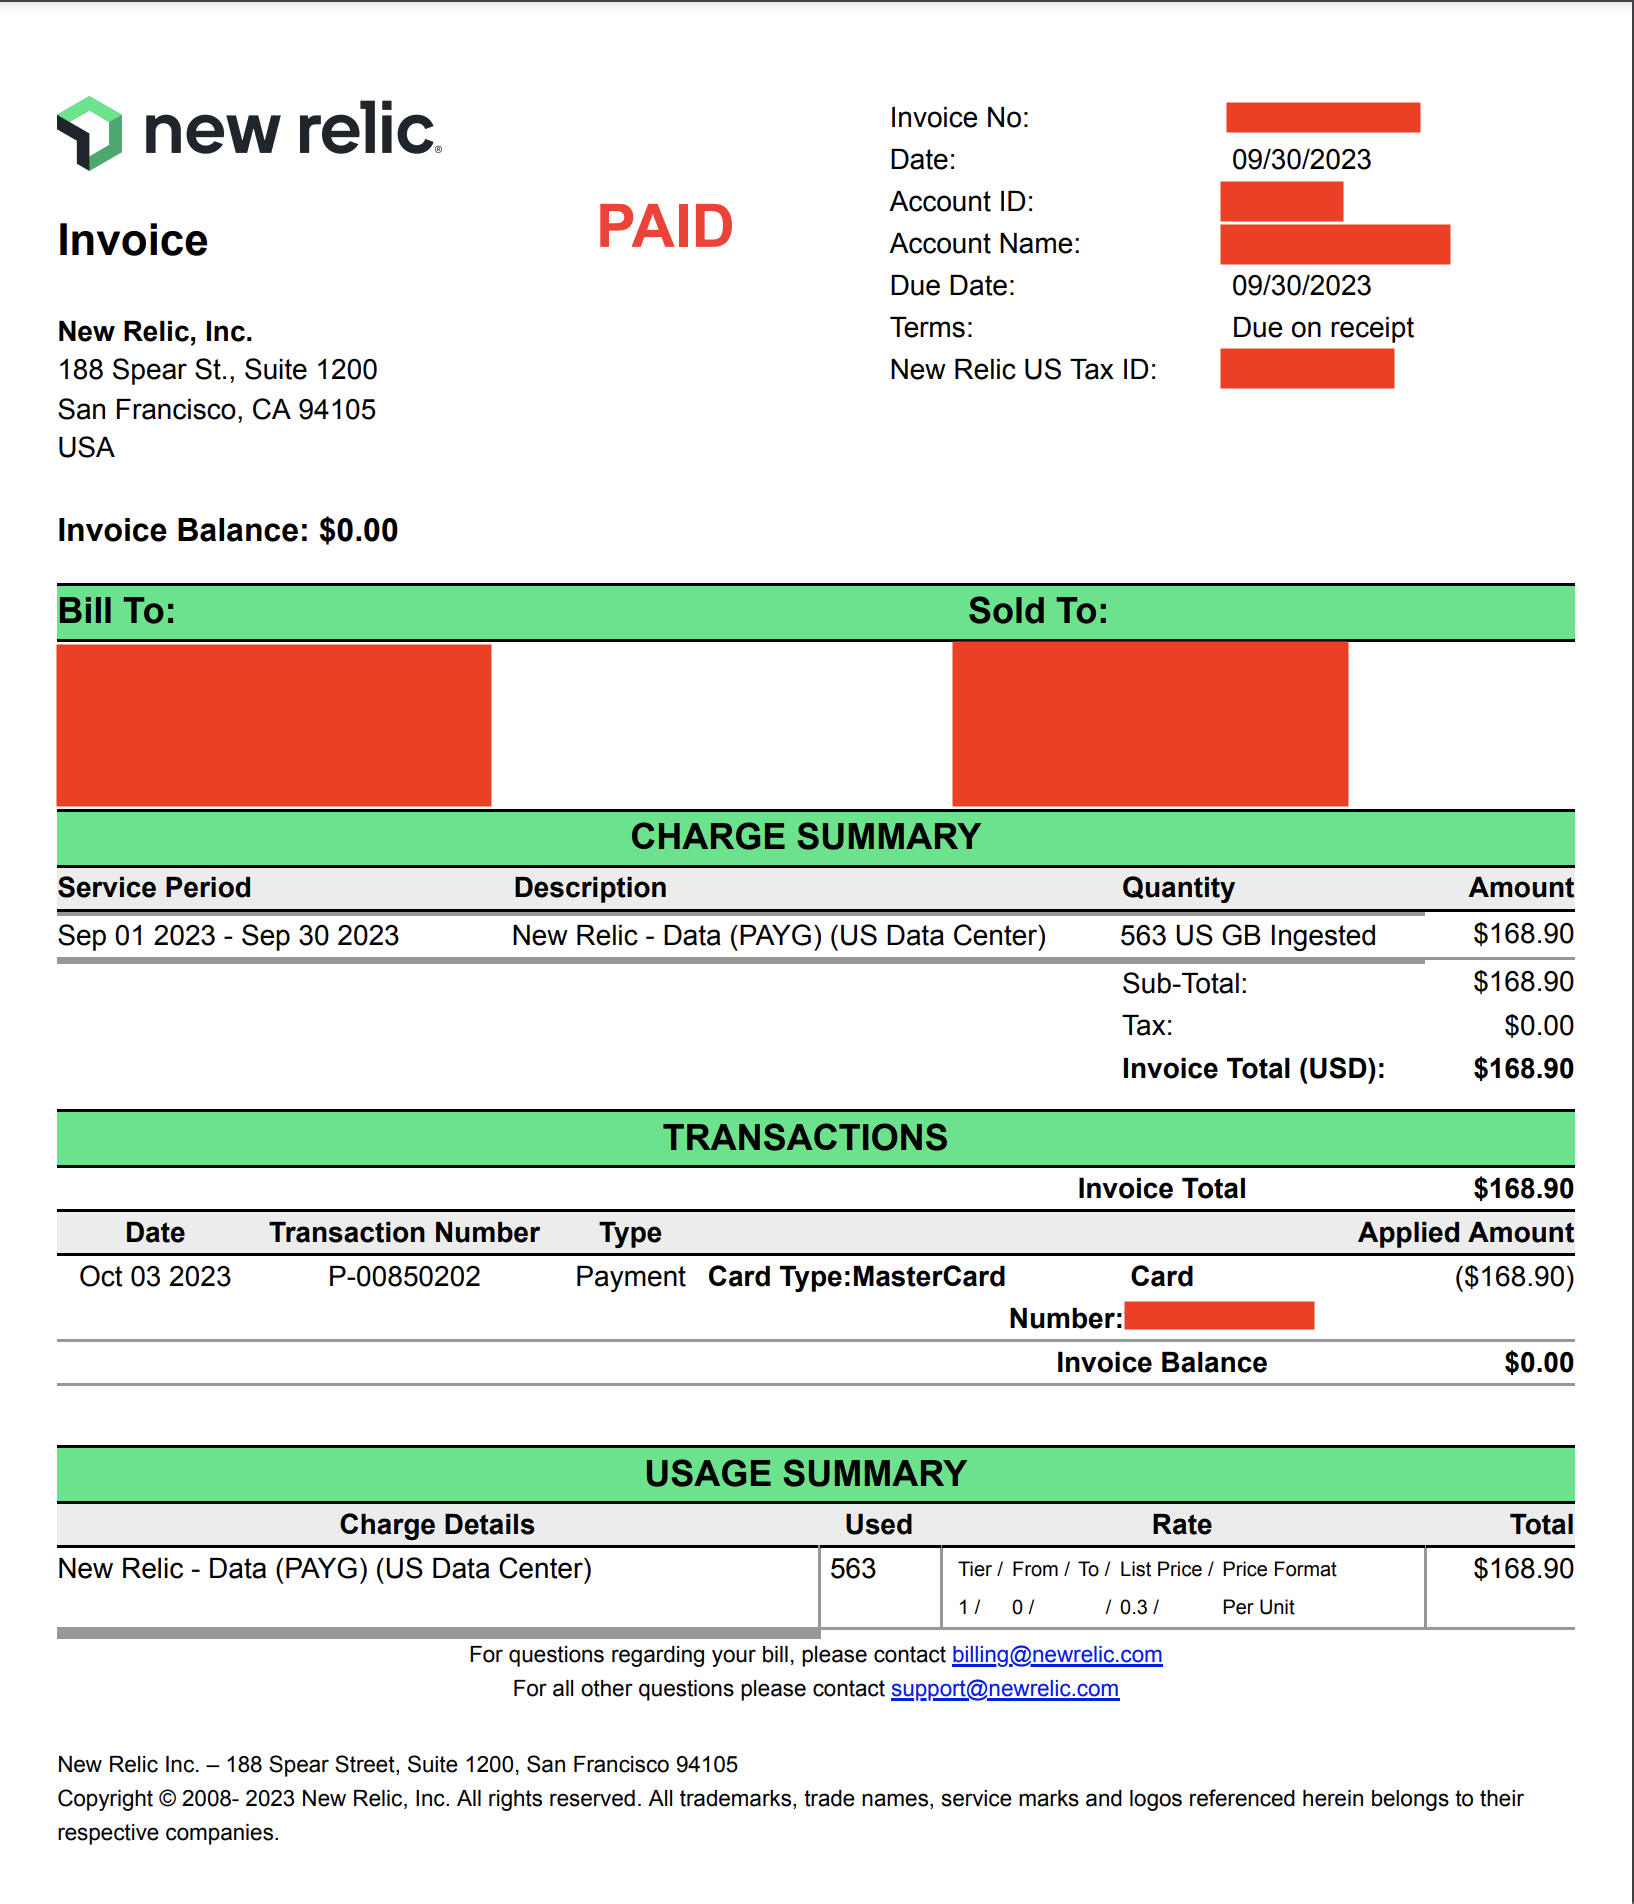
As you can see, all the price we pay for is from the data ingested. As of this writing, New Relic prices are based on data ingested, the number of users and the kind of users. We, at Togai, use only one shared user per environment. We use this shared user as the full platform user that New Relic has. We use the Standard Plan
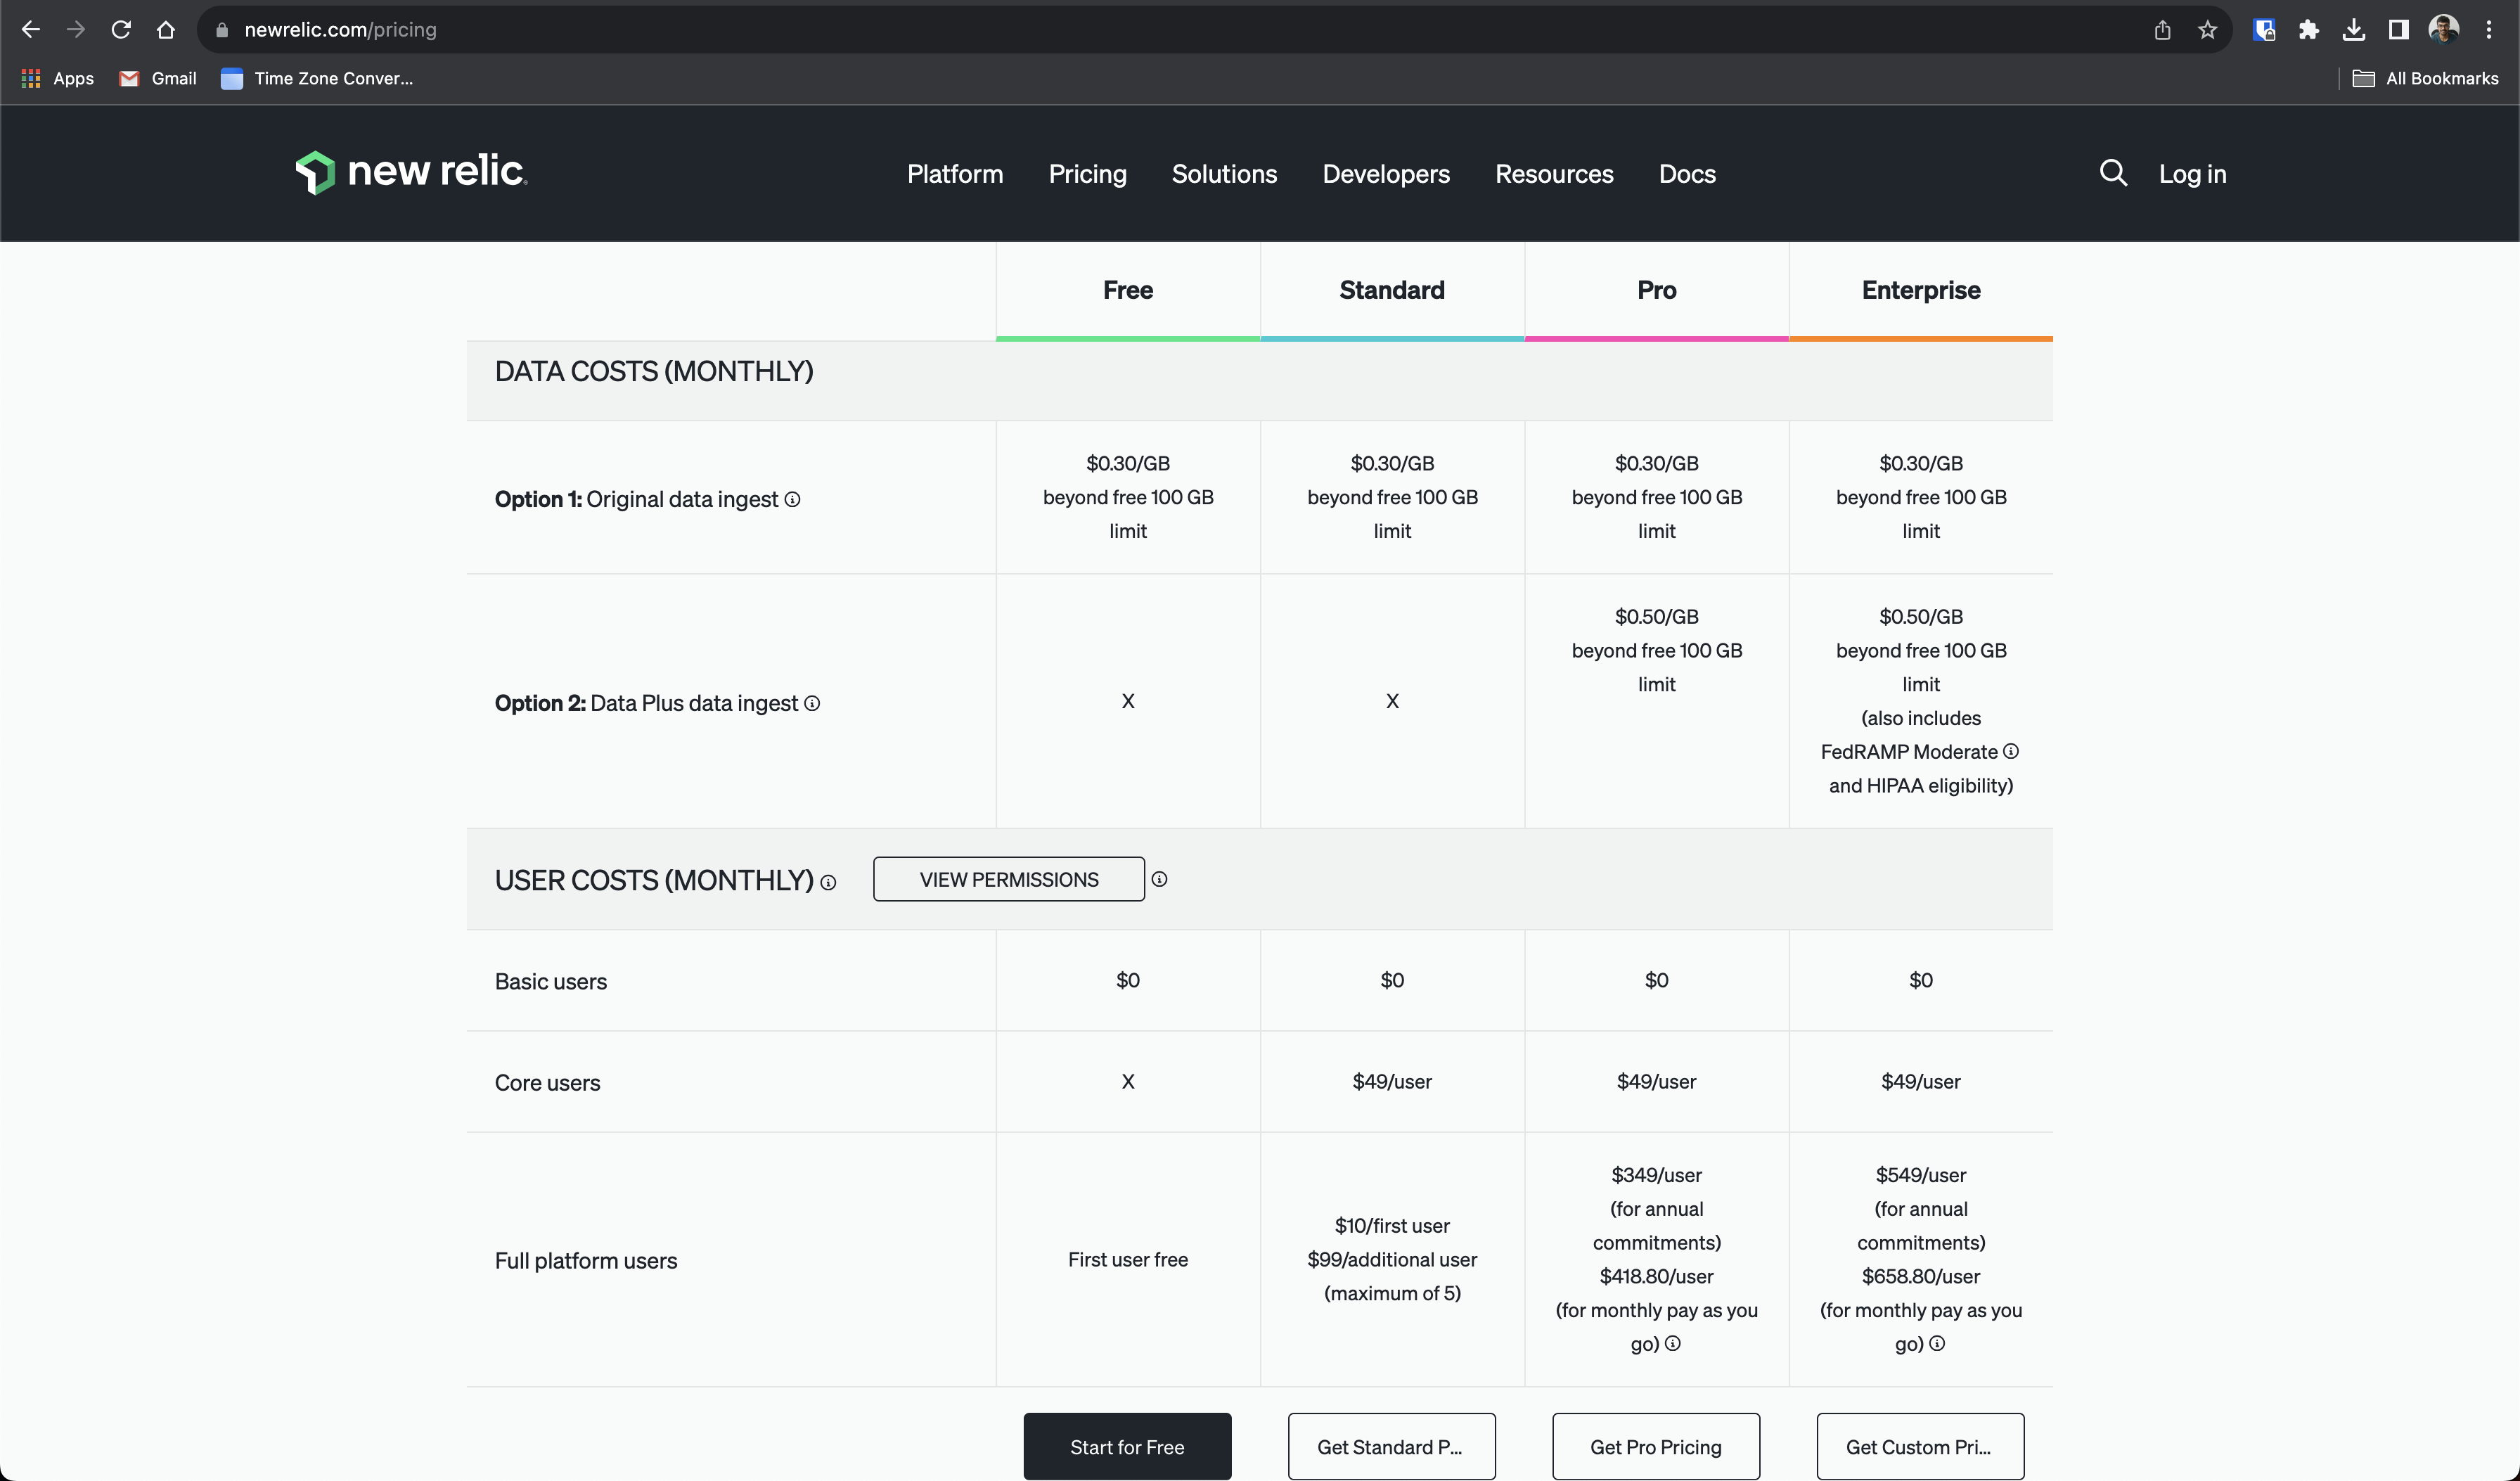
So, in our case, according to our plan and usage, we pay only for the data ingested.
Let's look at our ingested data/data usage across our environments. You can get this data from Administration > Plan and Usage > Usage
| Environment | July 2023 | August 2023 | September 2023 |
| Staging | 303GB | 195GB | 70GB |
| Sandbox | 559GB | 696GB | 663GB |
| Production | 144GB | 151GB | 136GB |
As we can see in the above table, the data ingested in the sandbox environment is unimaginably high, compared to staging and production. Sometimes staging also had lots of data ingestion, for example in July 2023
Before paying for New Relic, while planning and forecasting based on usage in the staging environment, our idea was that - we would end up using only 150GB per environment, out of which 100GB would be free, and 50GB would be priced at $0.30/GB, so, 50GB x $0.30/GB = 15$. Extrapolate that for 3 environments, $45. This may not be a good estimate because it assumes that the data ingestion will be the same in all environments but as we can see, that's not the case. It's not even close to the same. It's vastly different
Interestingly, we did notice high data ingestion before itself once. I think this was in July. At the time, I had a call with the New Relic team to understand the high ingestion in one of our accounts, I guess it was our staging account. This was because I couldn't find what data was getting ingested. I did notice the Manage Your Data section, which can be found at Administration > Data Management and found the Data Ingestion section in it. Let's look at an example of this. You can go to Administration > Data Management > Data Ingestion to see it for your account
For example, in the sandbox account, in the last 30 days, 643GB has been ingested! You can see this below -
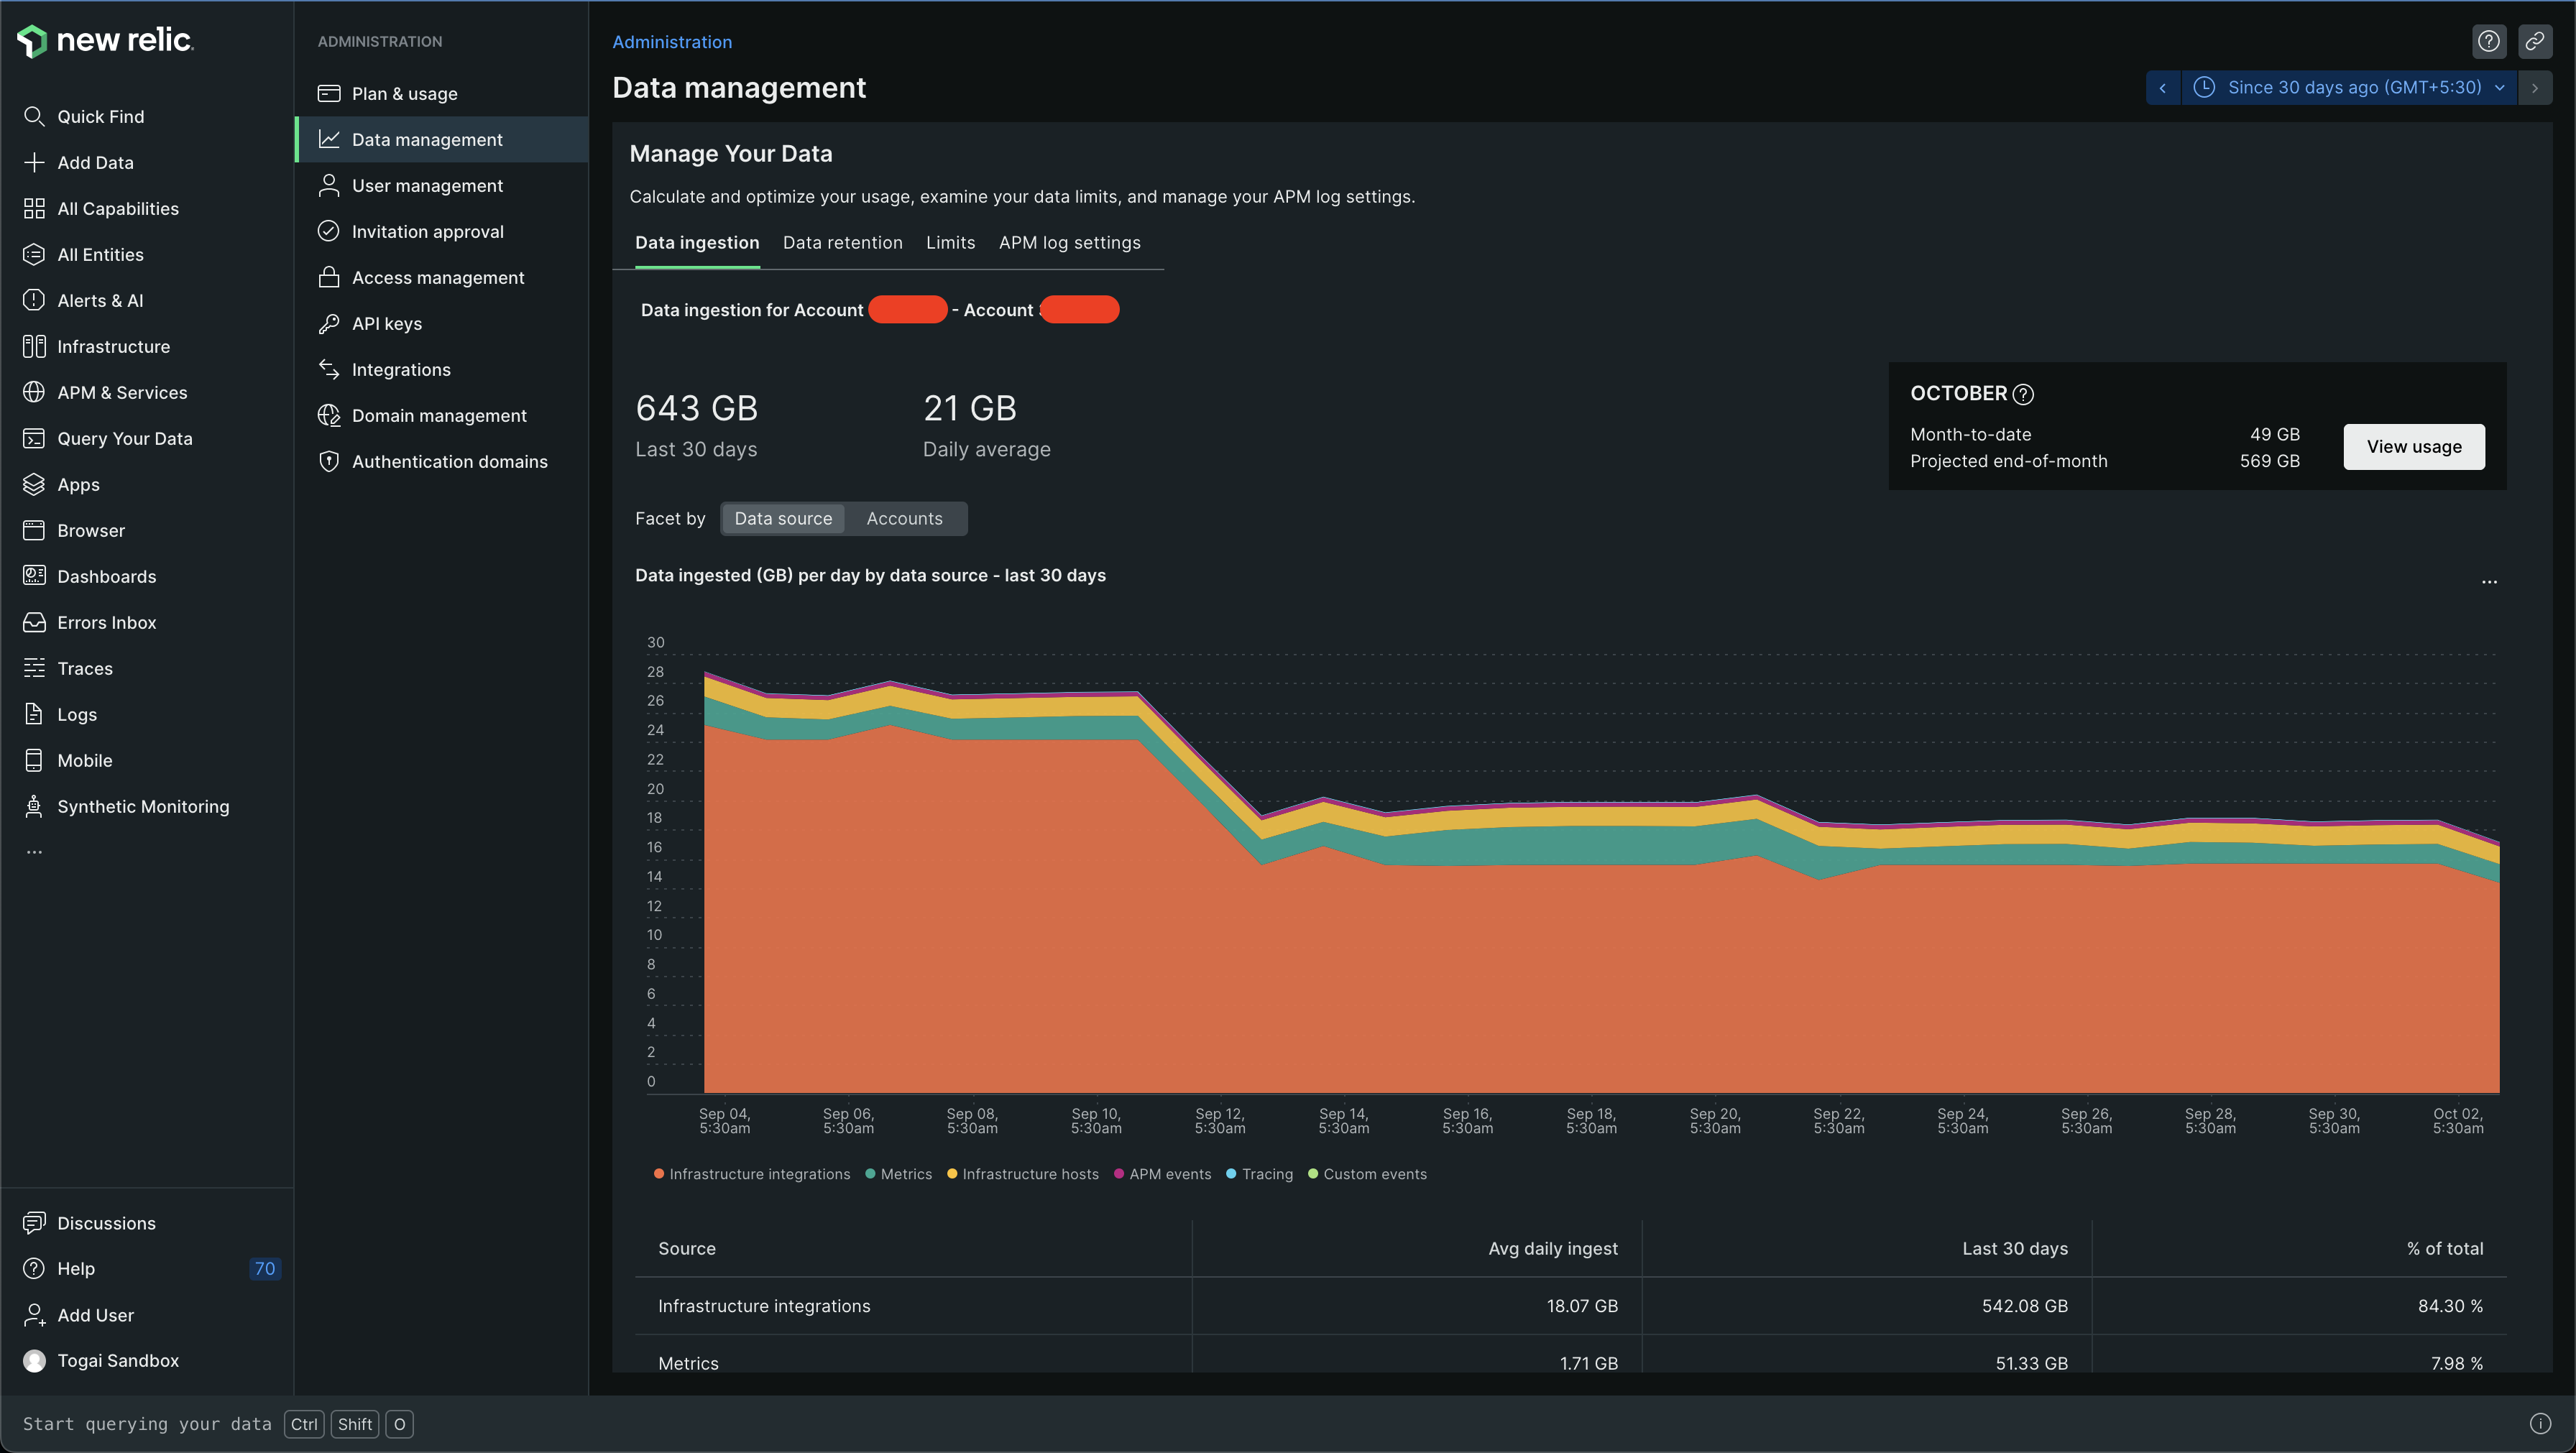
I could just see that there was a lot of data ingested and there were some categories at the bottom
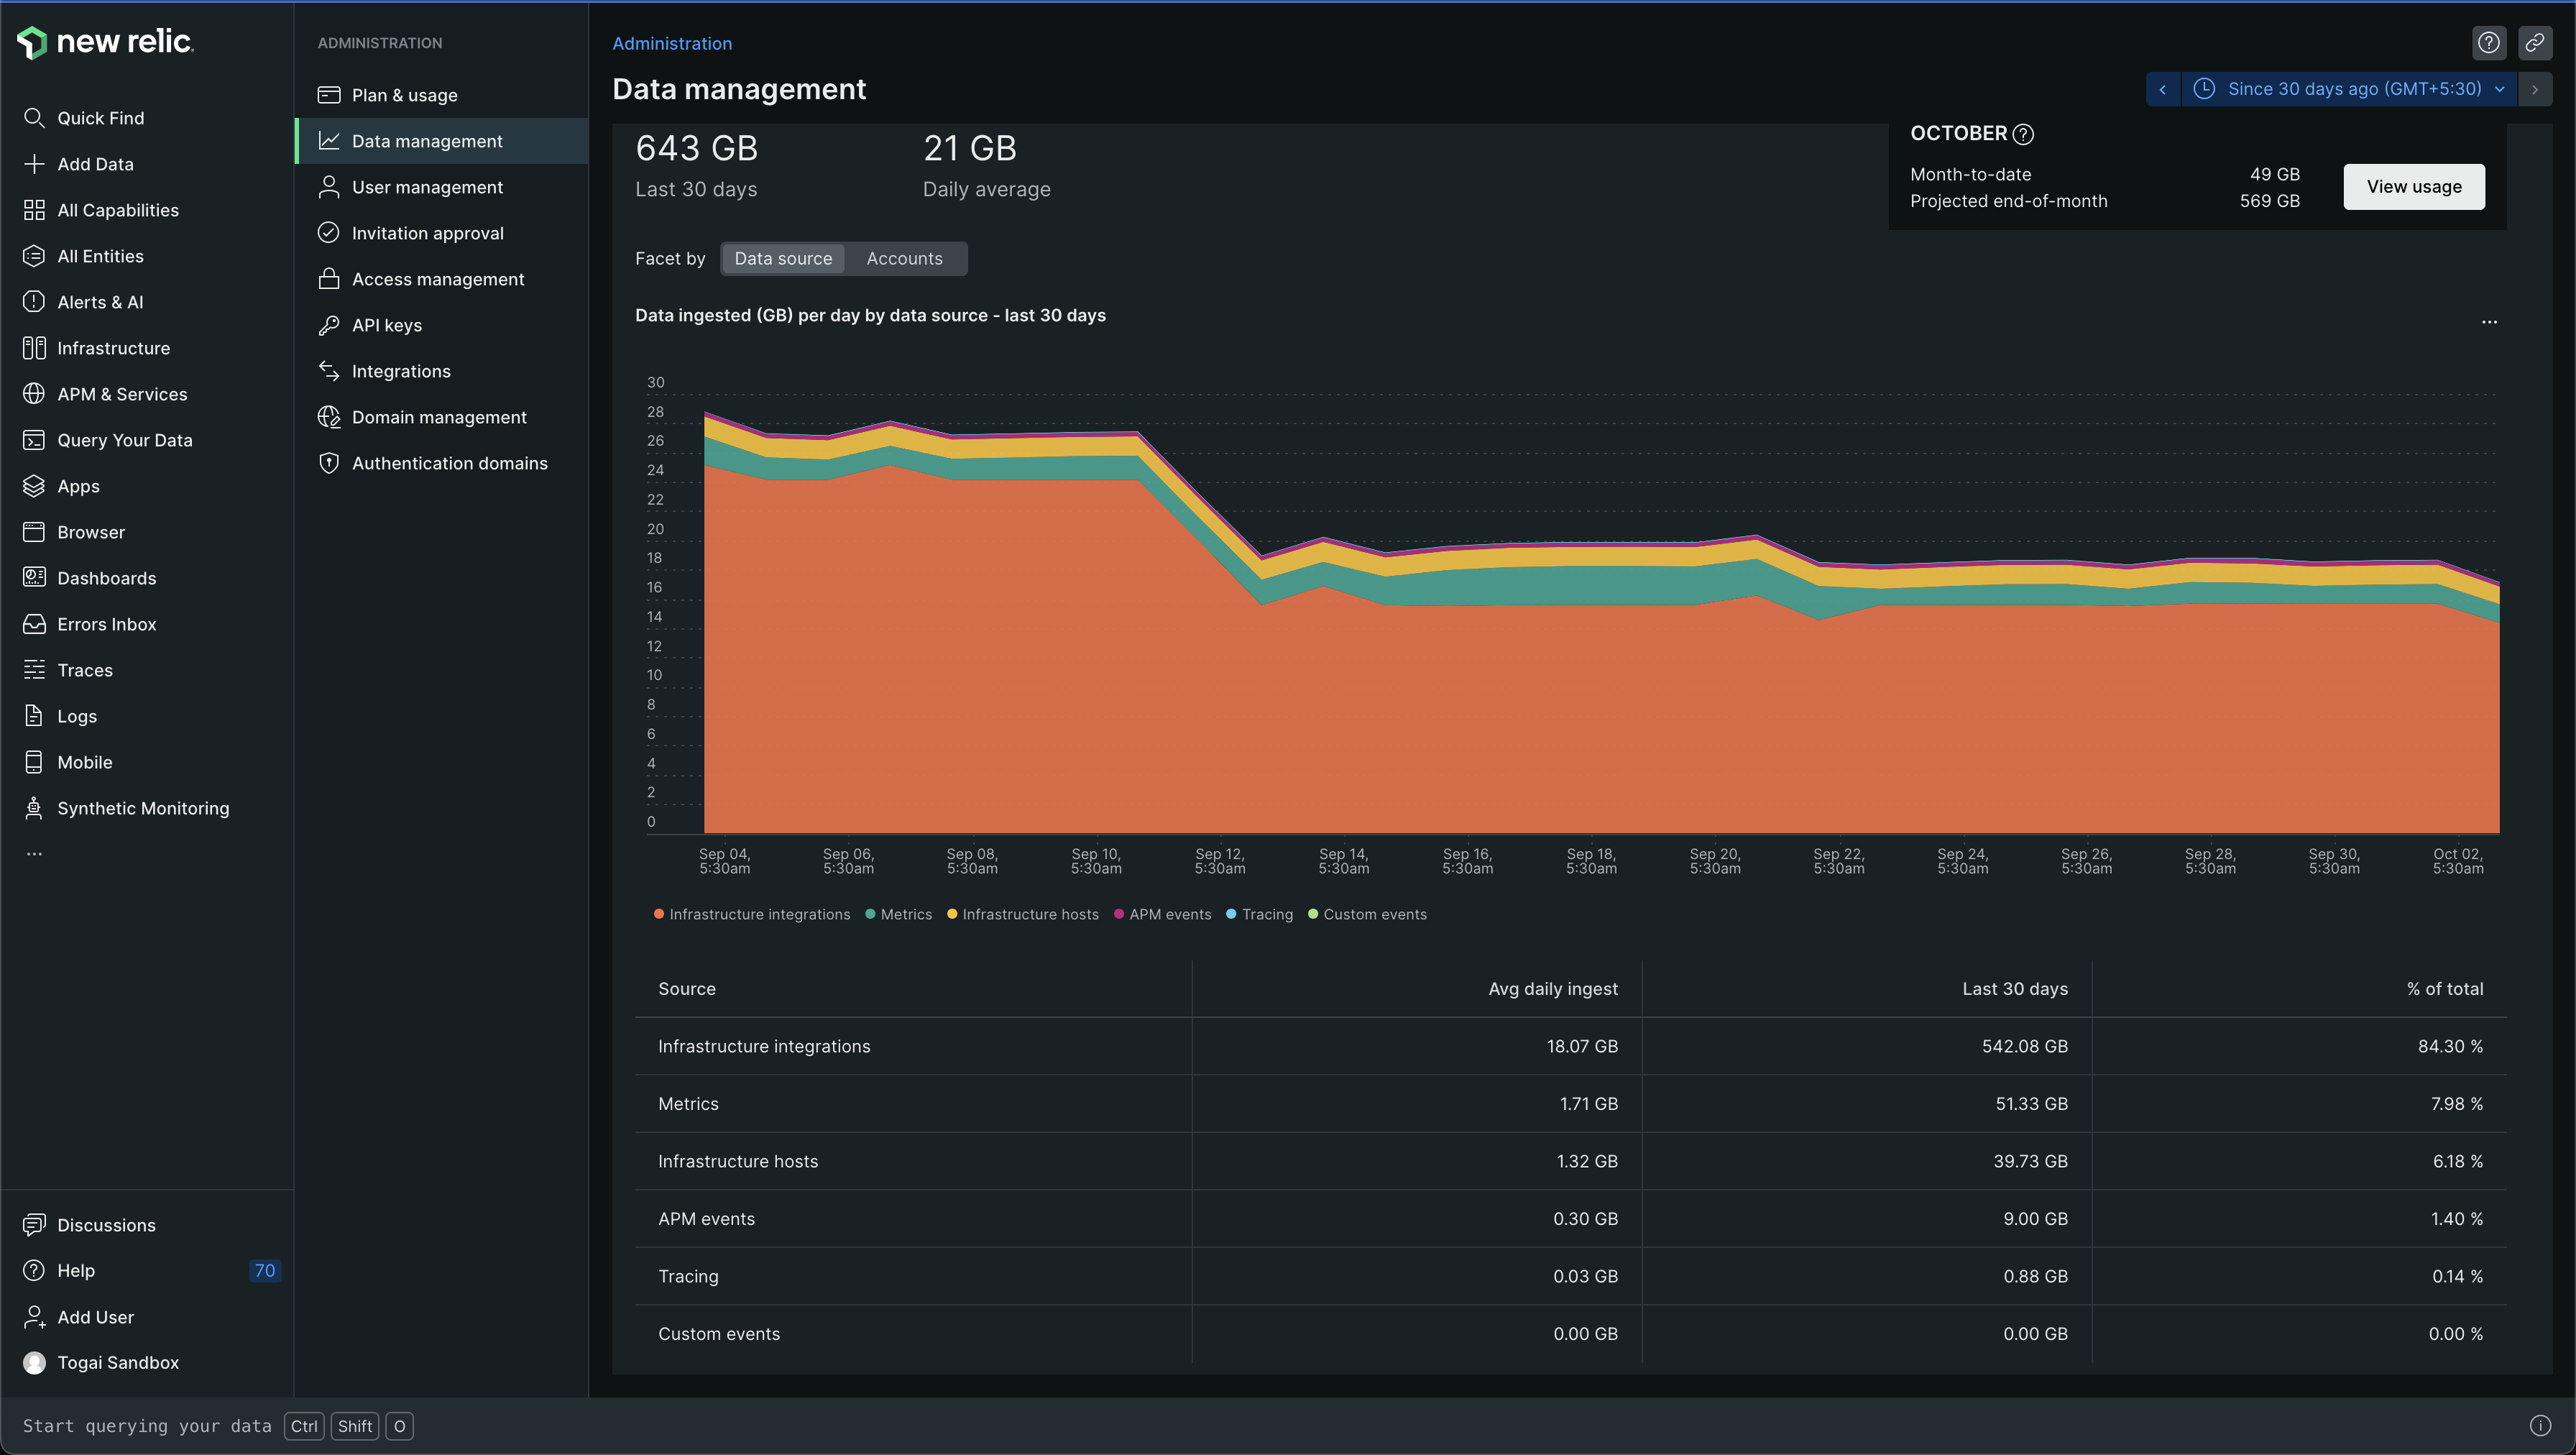
The categories were -
Infrastructure integrations
Metrics
Infrastructure hosts
APM events
Tracing
Custom events
Now, there was no way for me to find out what infrastructure integrations were ingesting lots of data. There were quite a few infrastructure integrations - PostgreSQL, Redis, Nginx
When I got on a call with New Relic Tech support, they were kind enough to show me how to get the data around which infrastructure integration was ingesting too much data
Spoiler: All of the data that I need is present in New Relic and can be queried using New Relic Query Language (NRQL). Let's see how :)
For people who would like to just see dashboards and not query using NRQL and explore and stuff, let's look at some out-of-the-box dashboards that New Relic gives to understand the data ingested by our integrations
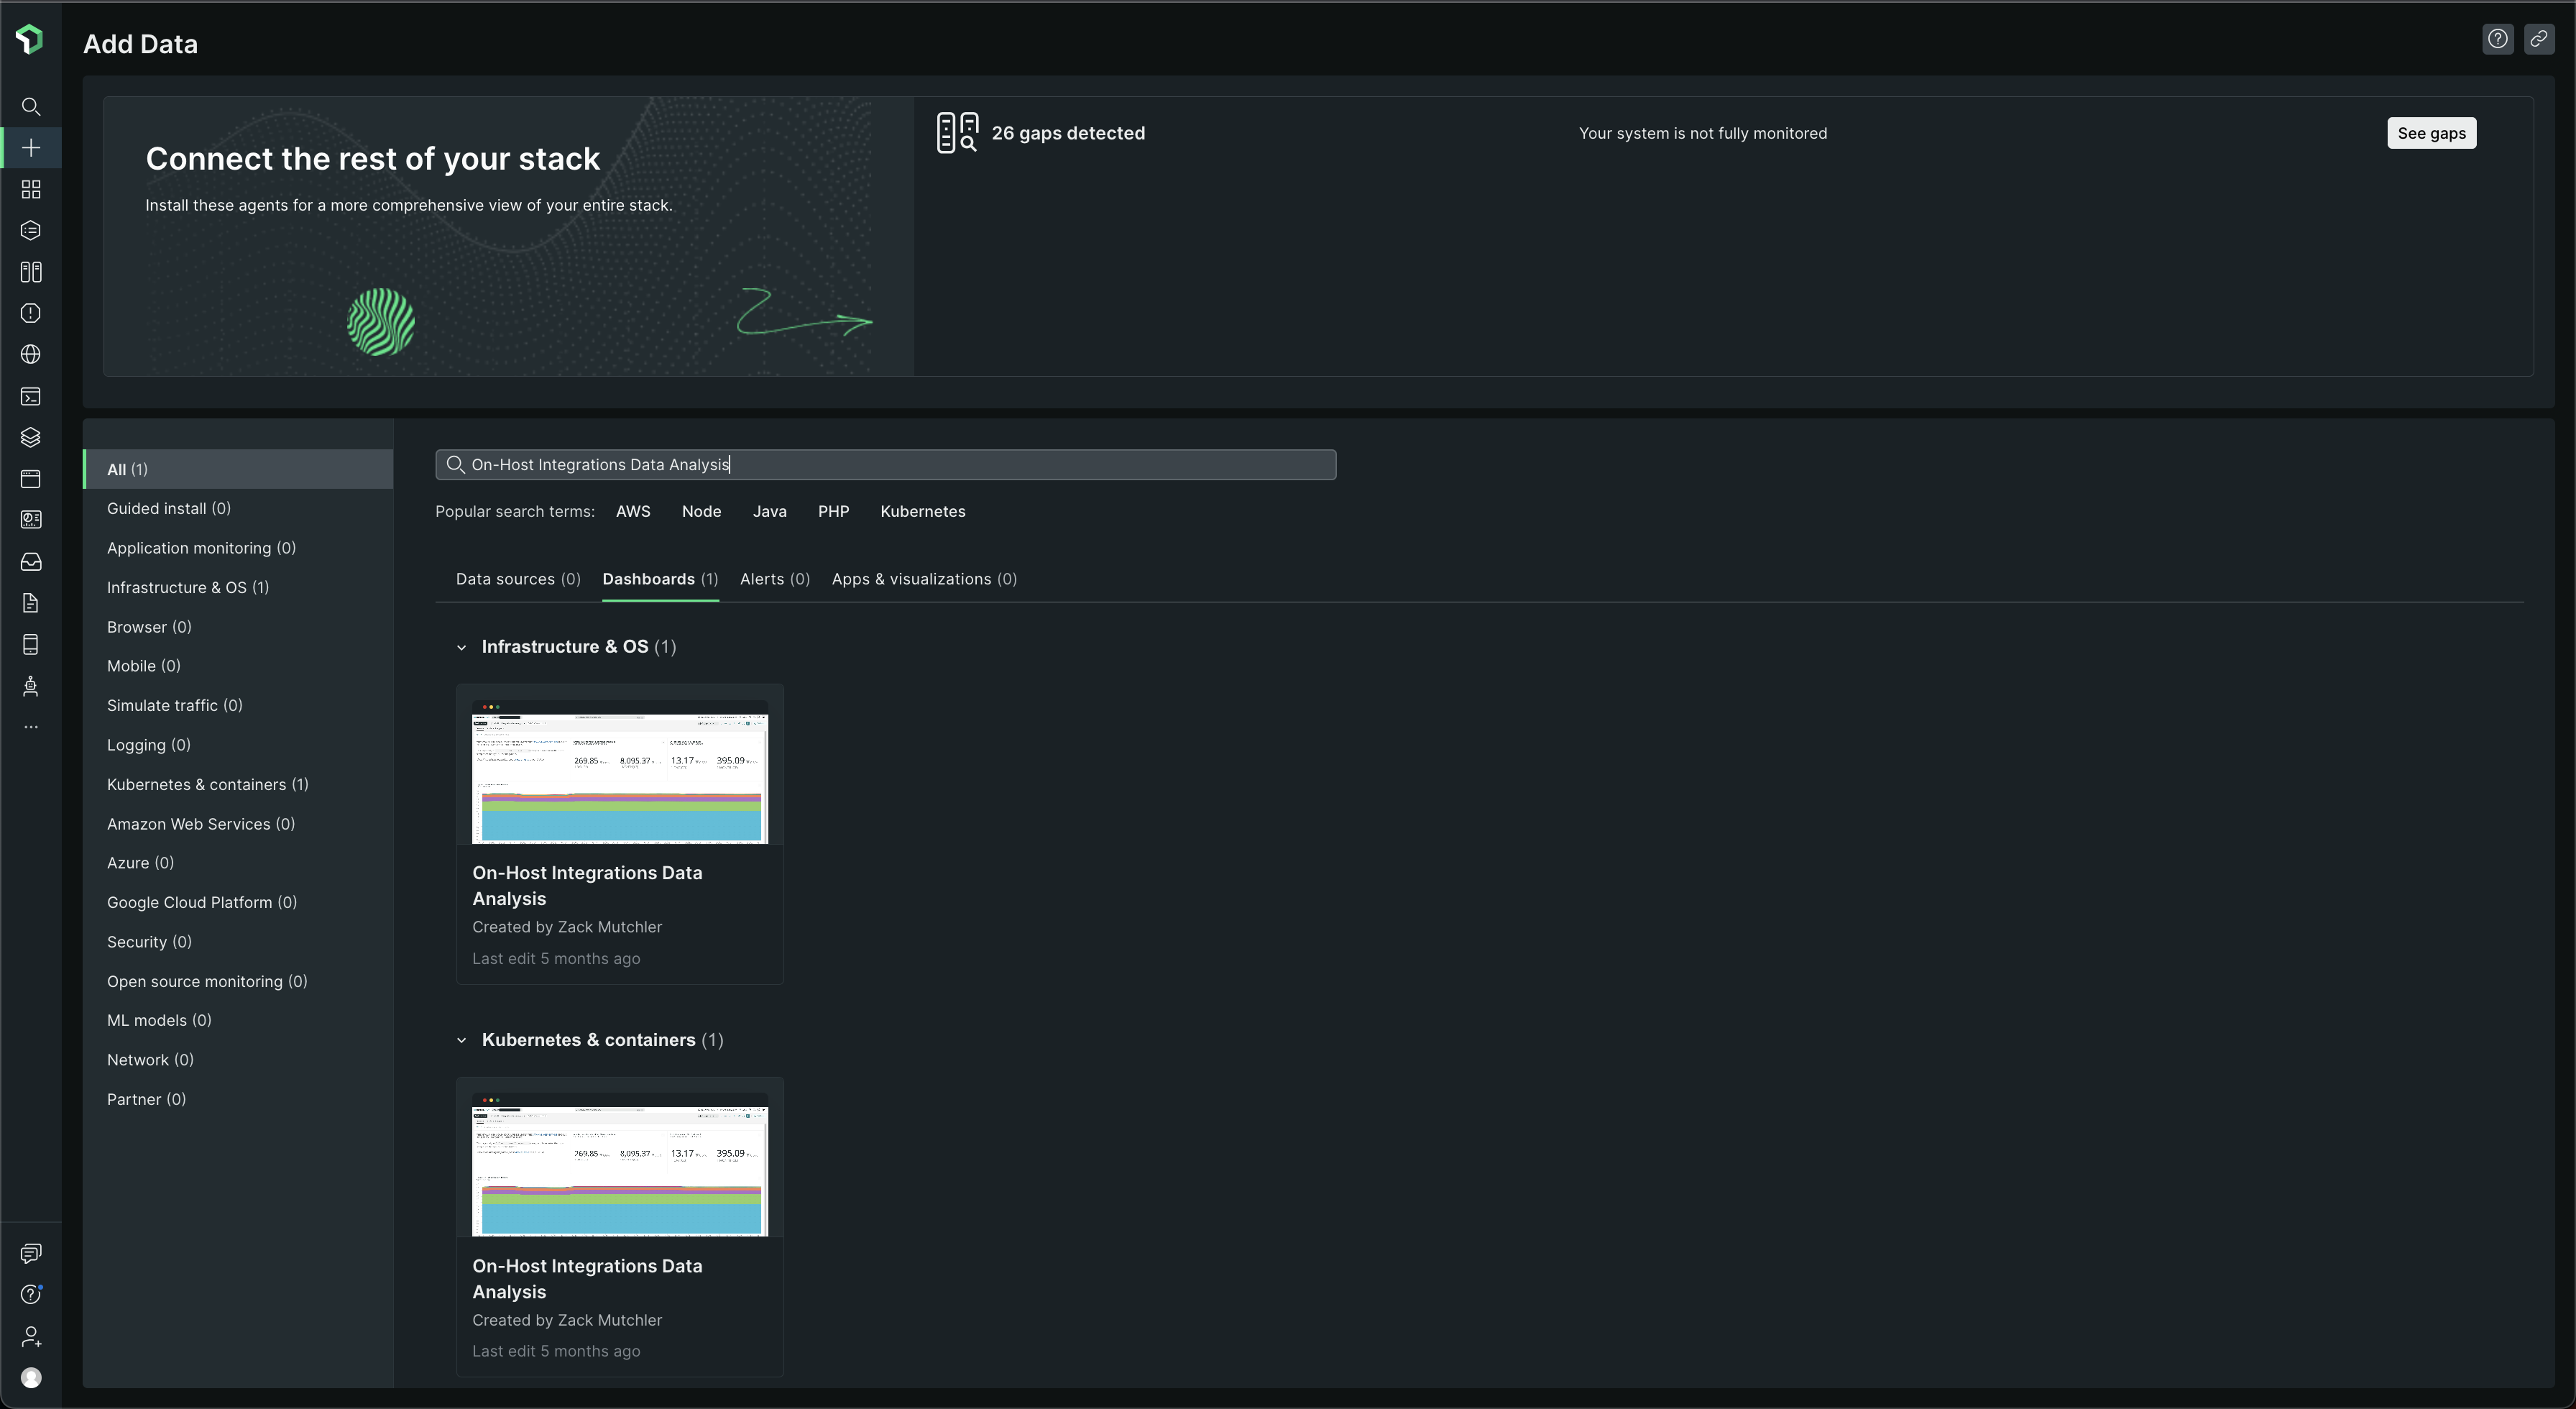
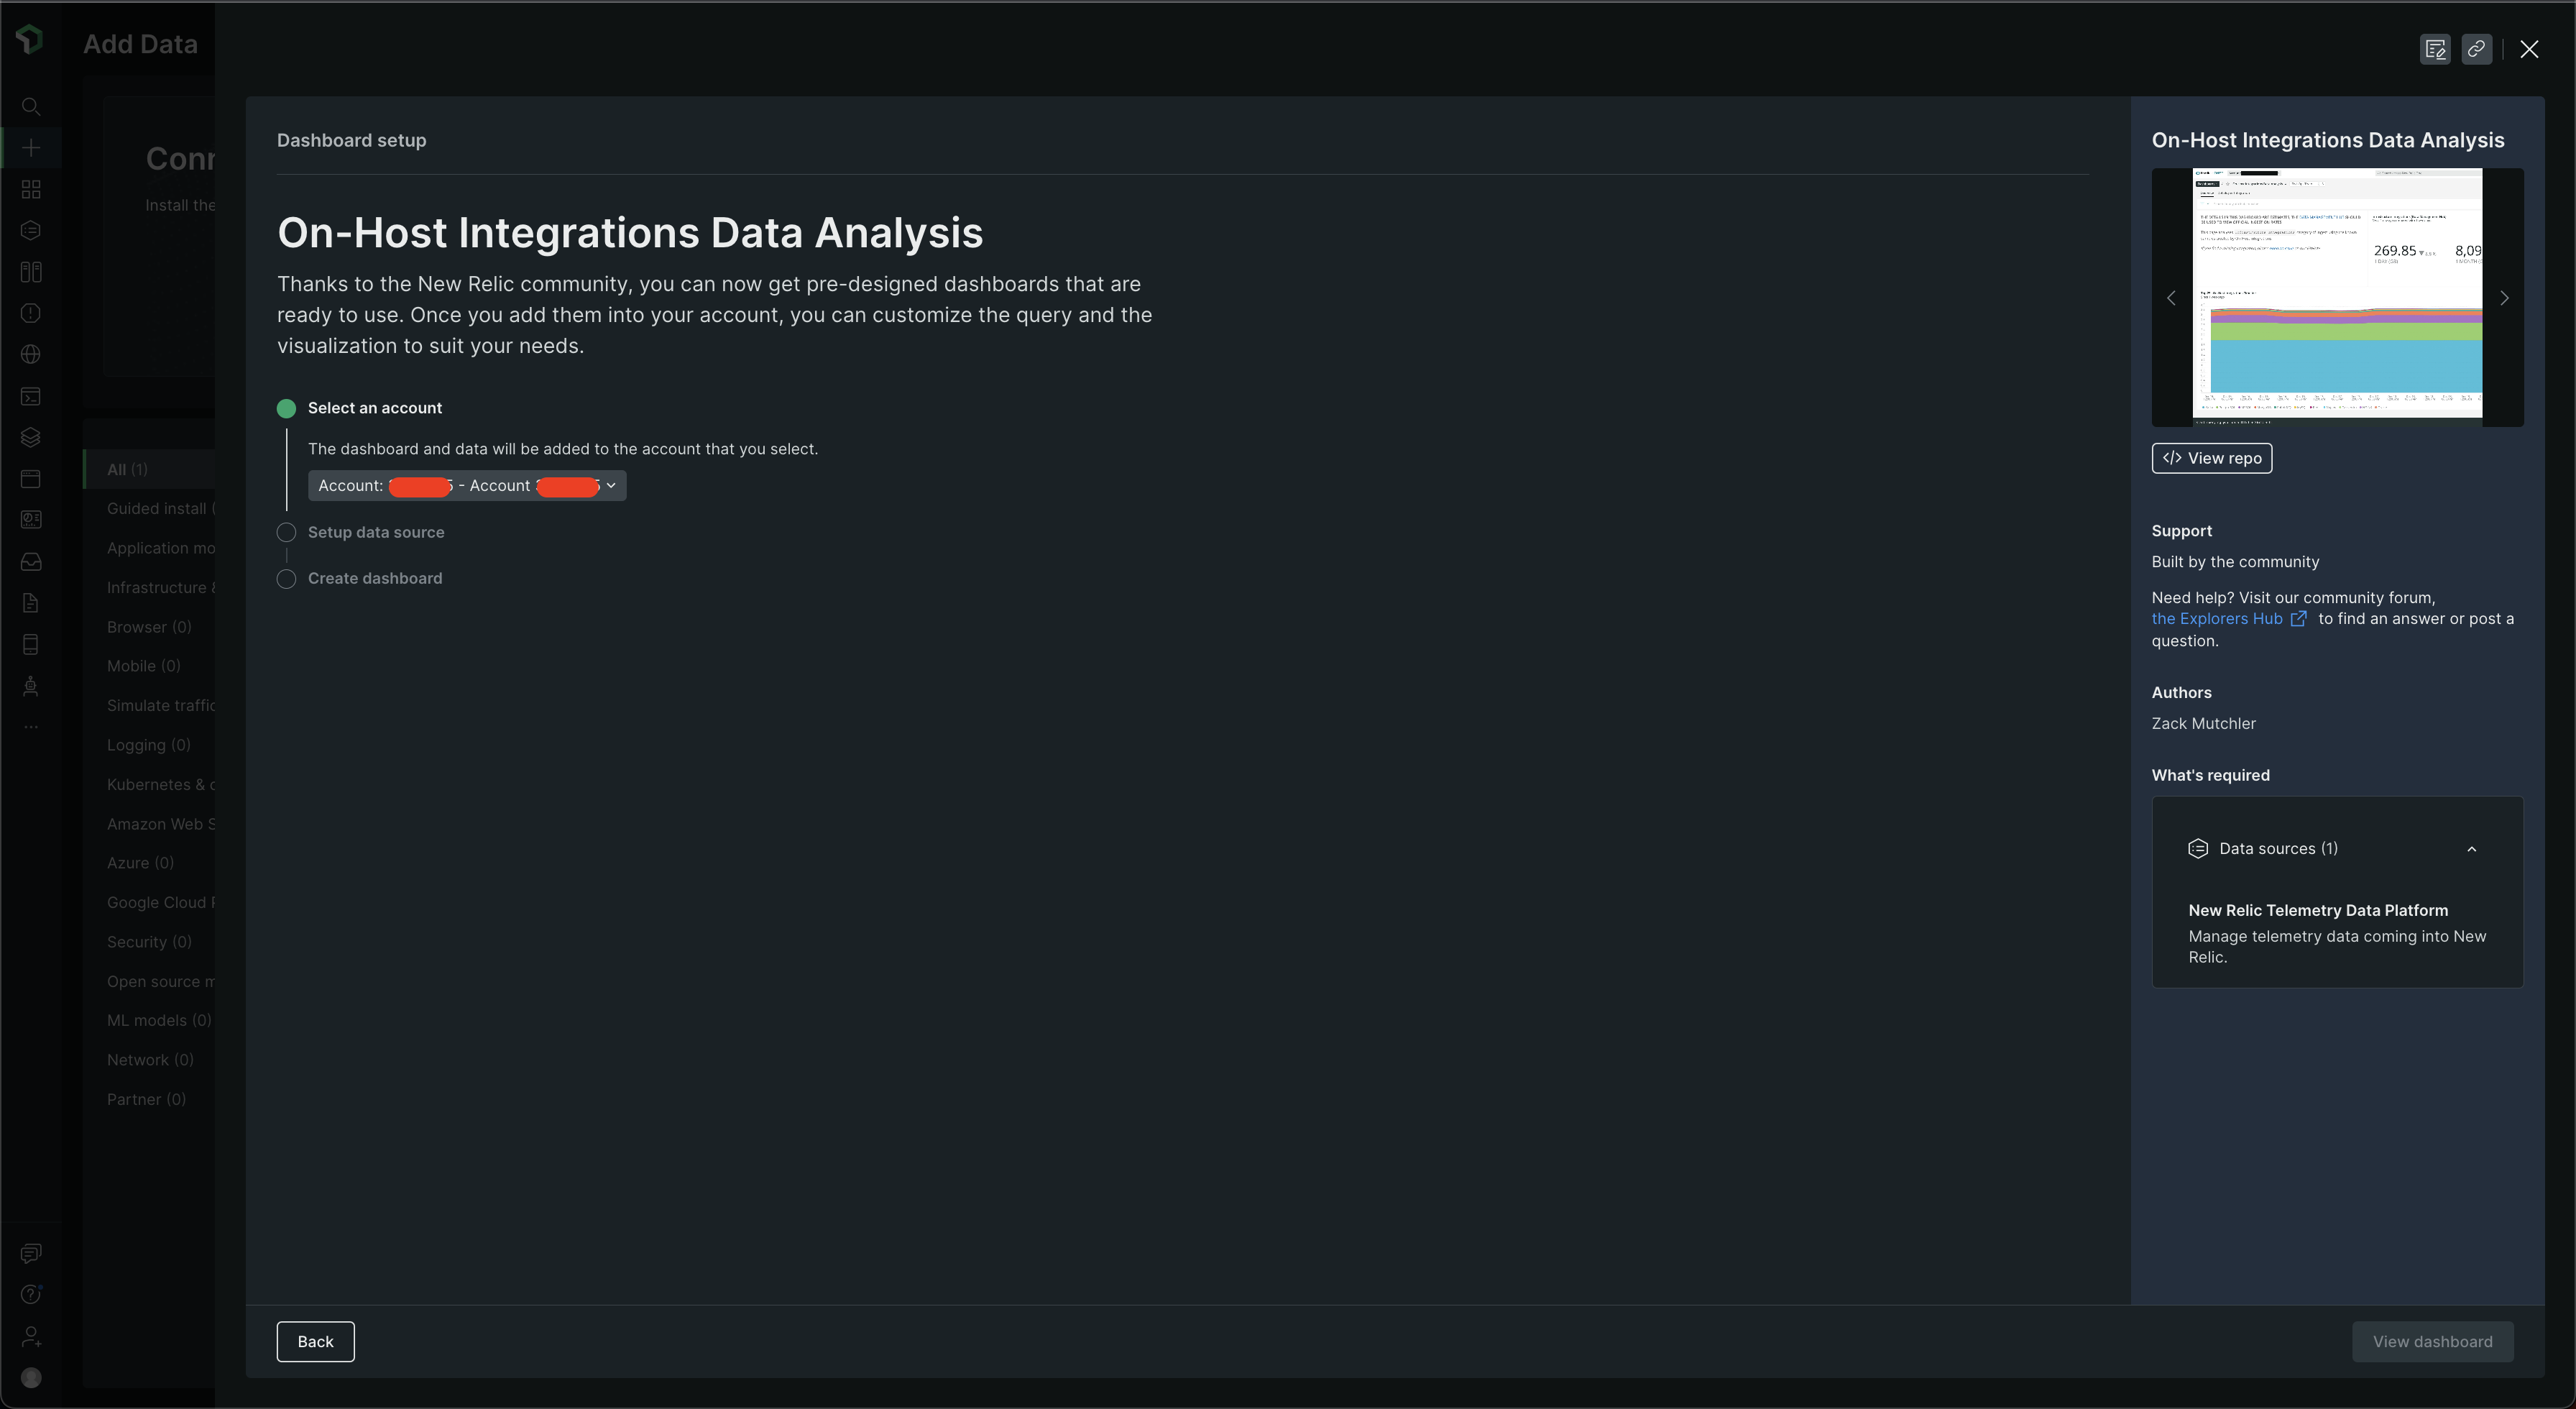
Go to Dashboards, click on + Create Dashboard > Browse pre-built dashboards. Then look for On-Host Integrations Data Analysis 🧐 and you should find it under Infrastructure & OS. Click on it and then choose the account under Select an account and then select Done ✅ ☑️ ✔️ button under Setup data source under New Relic Telemetry Data Platform and your dashboard should be ready! Click on View dashboard.
Some screenshots of how this process would look like -
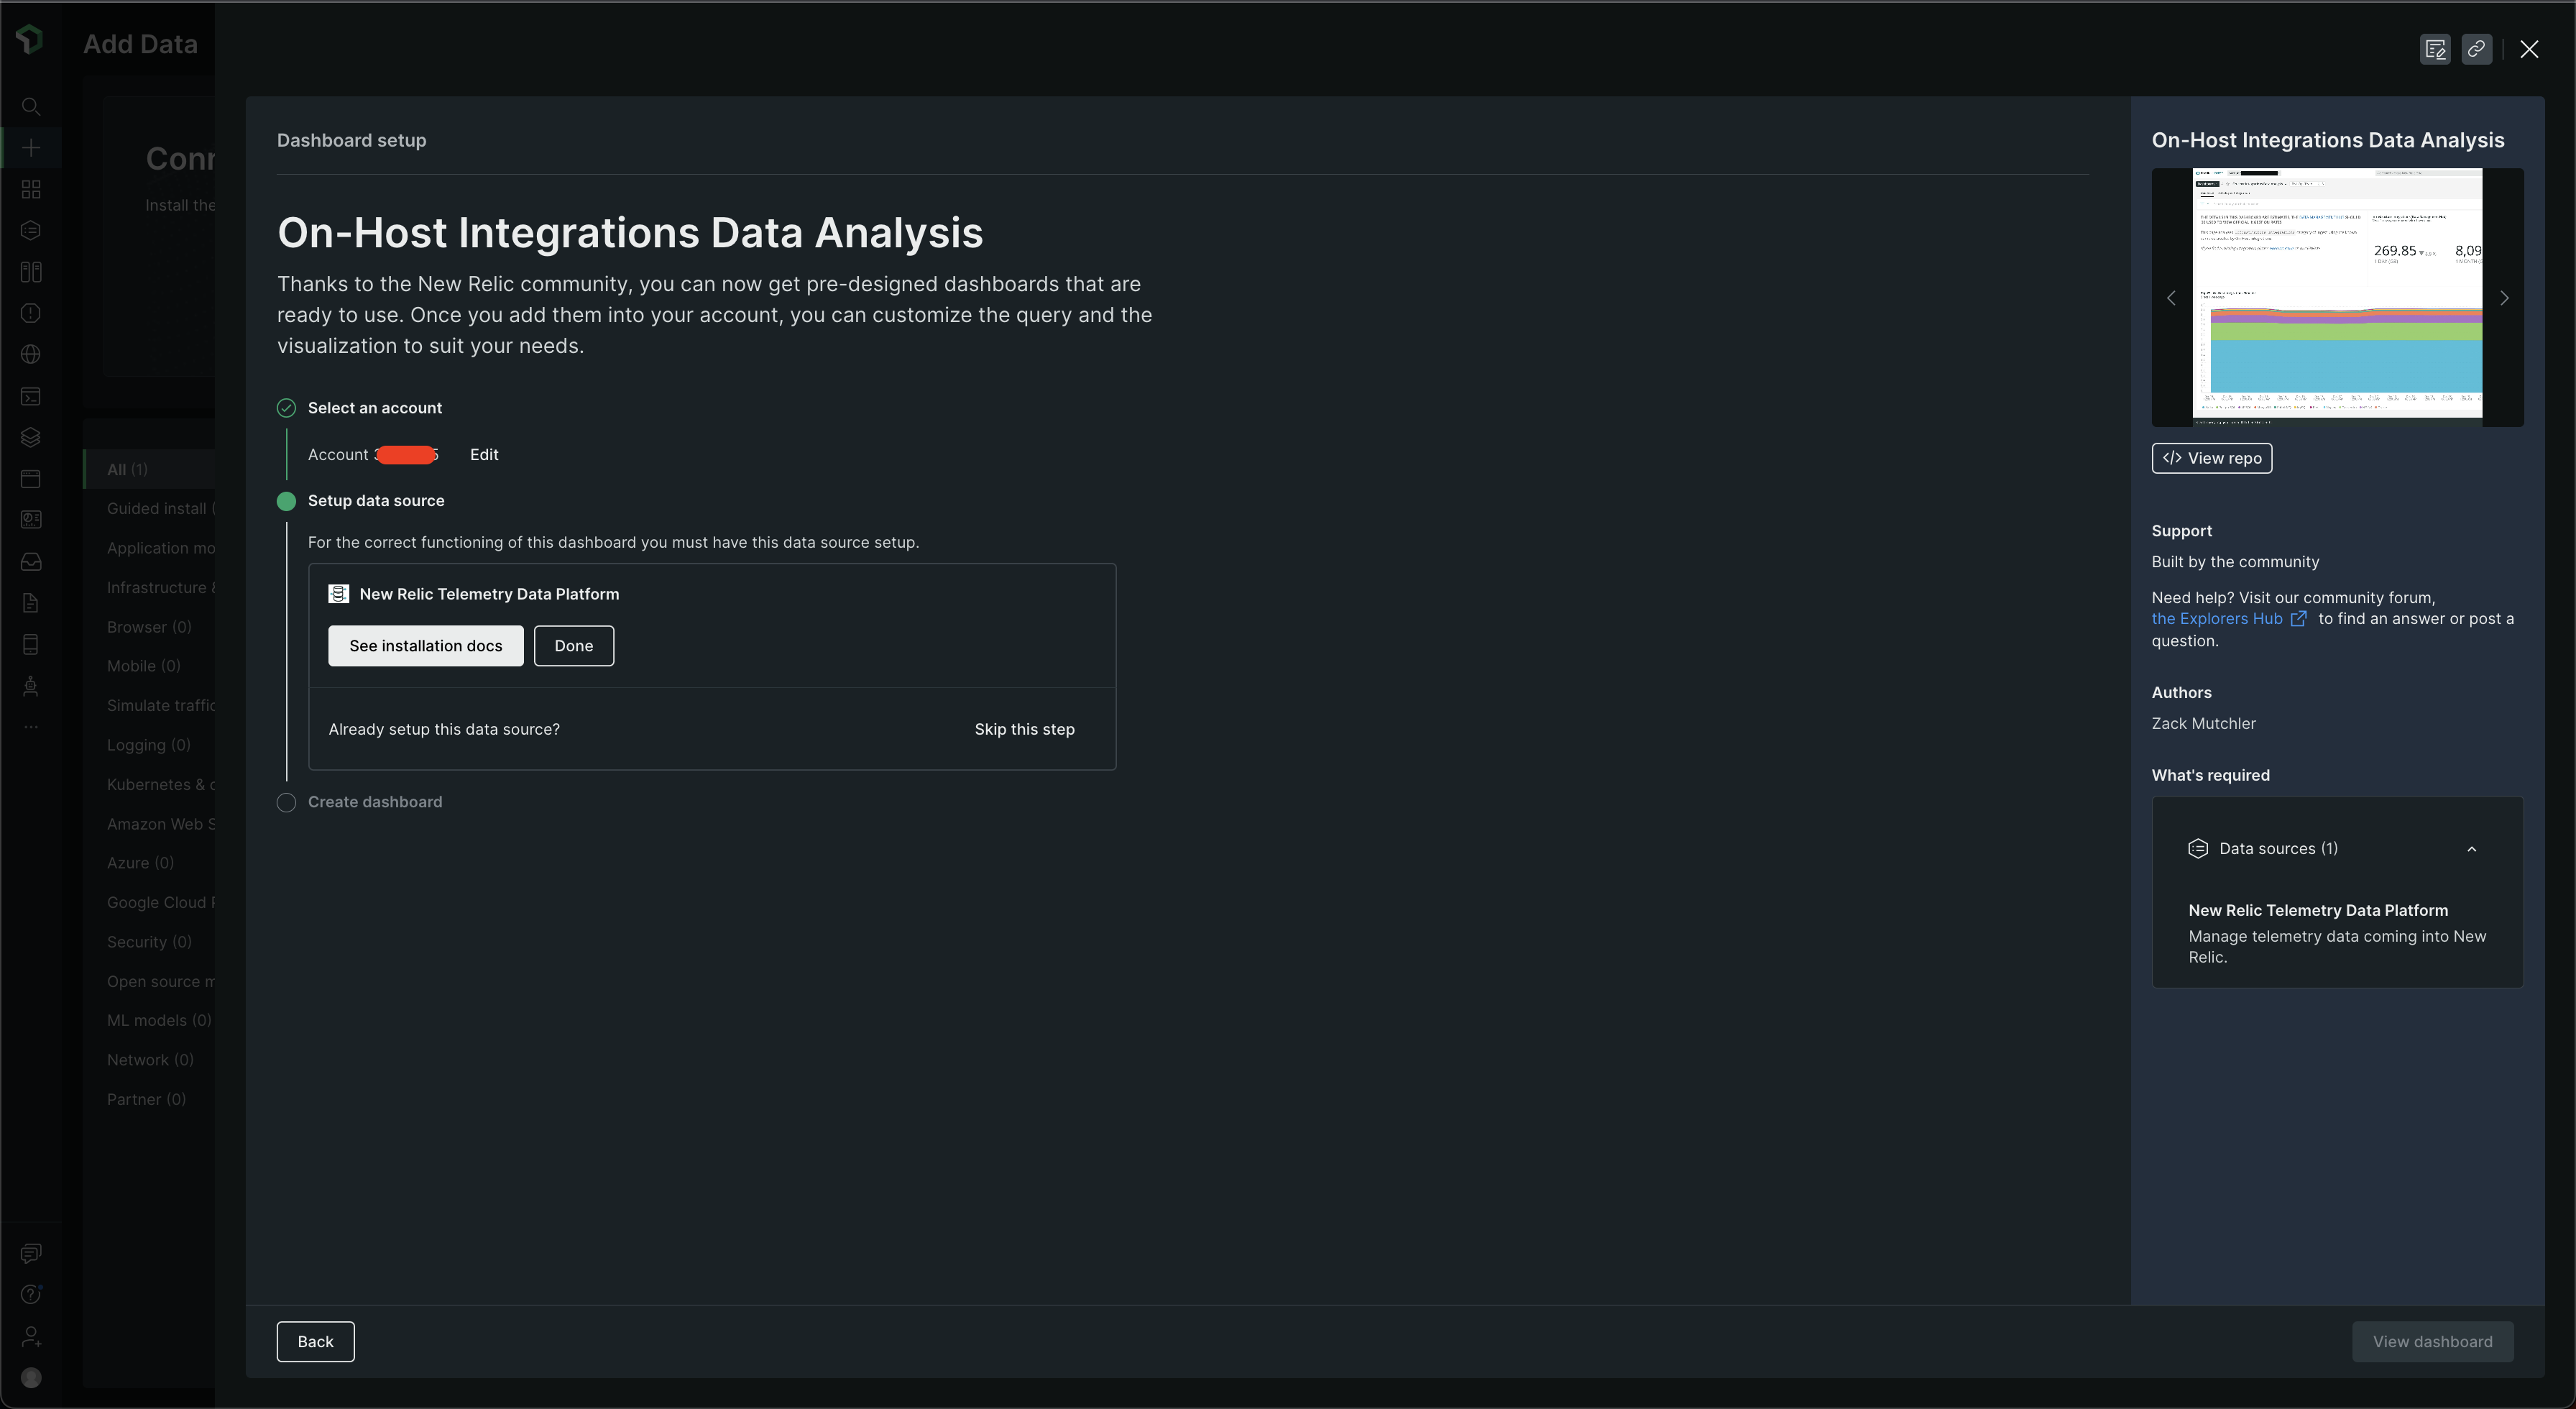
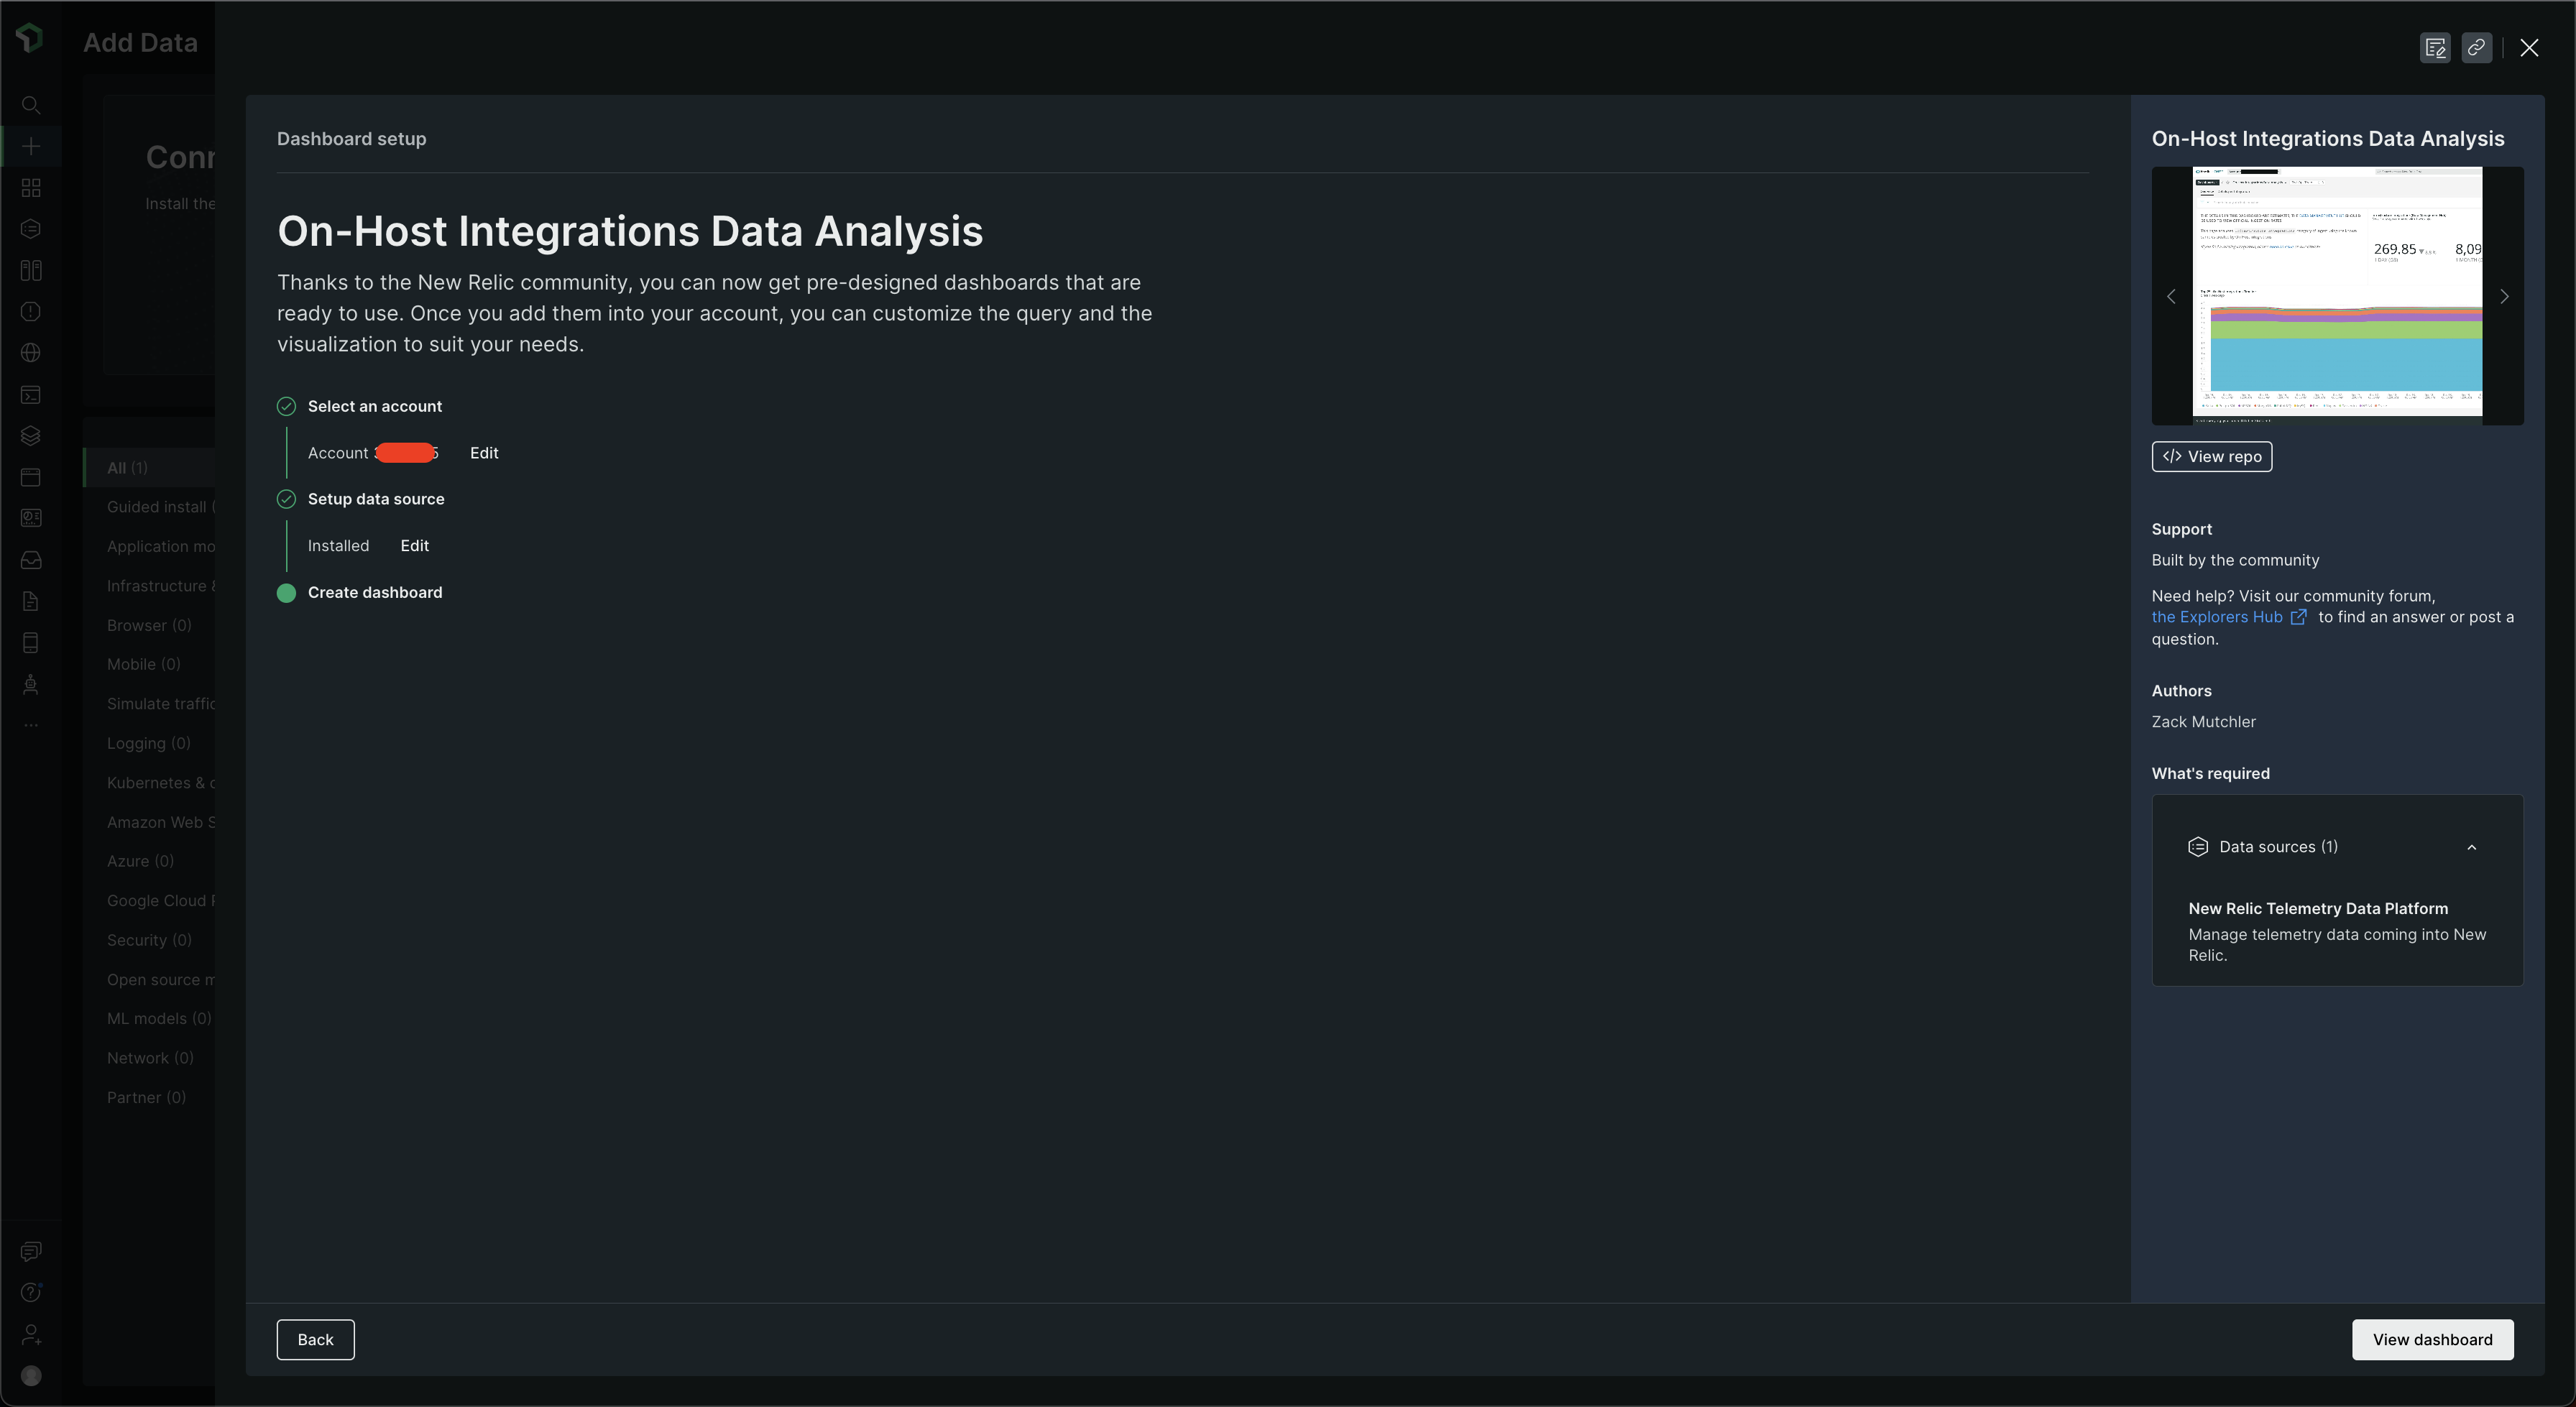
The dashboard should look something like this -
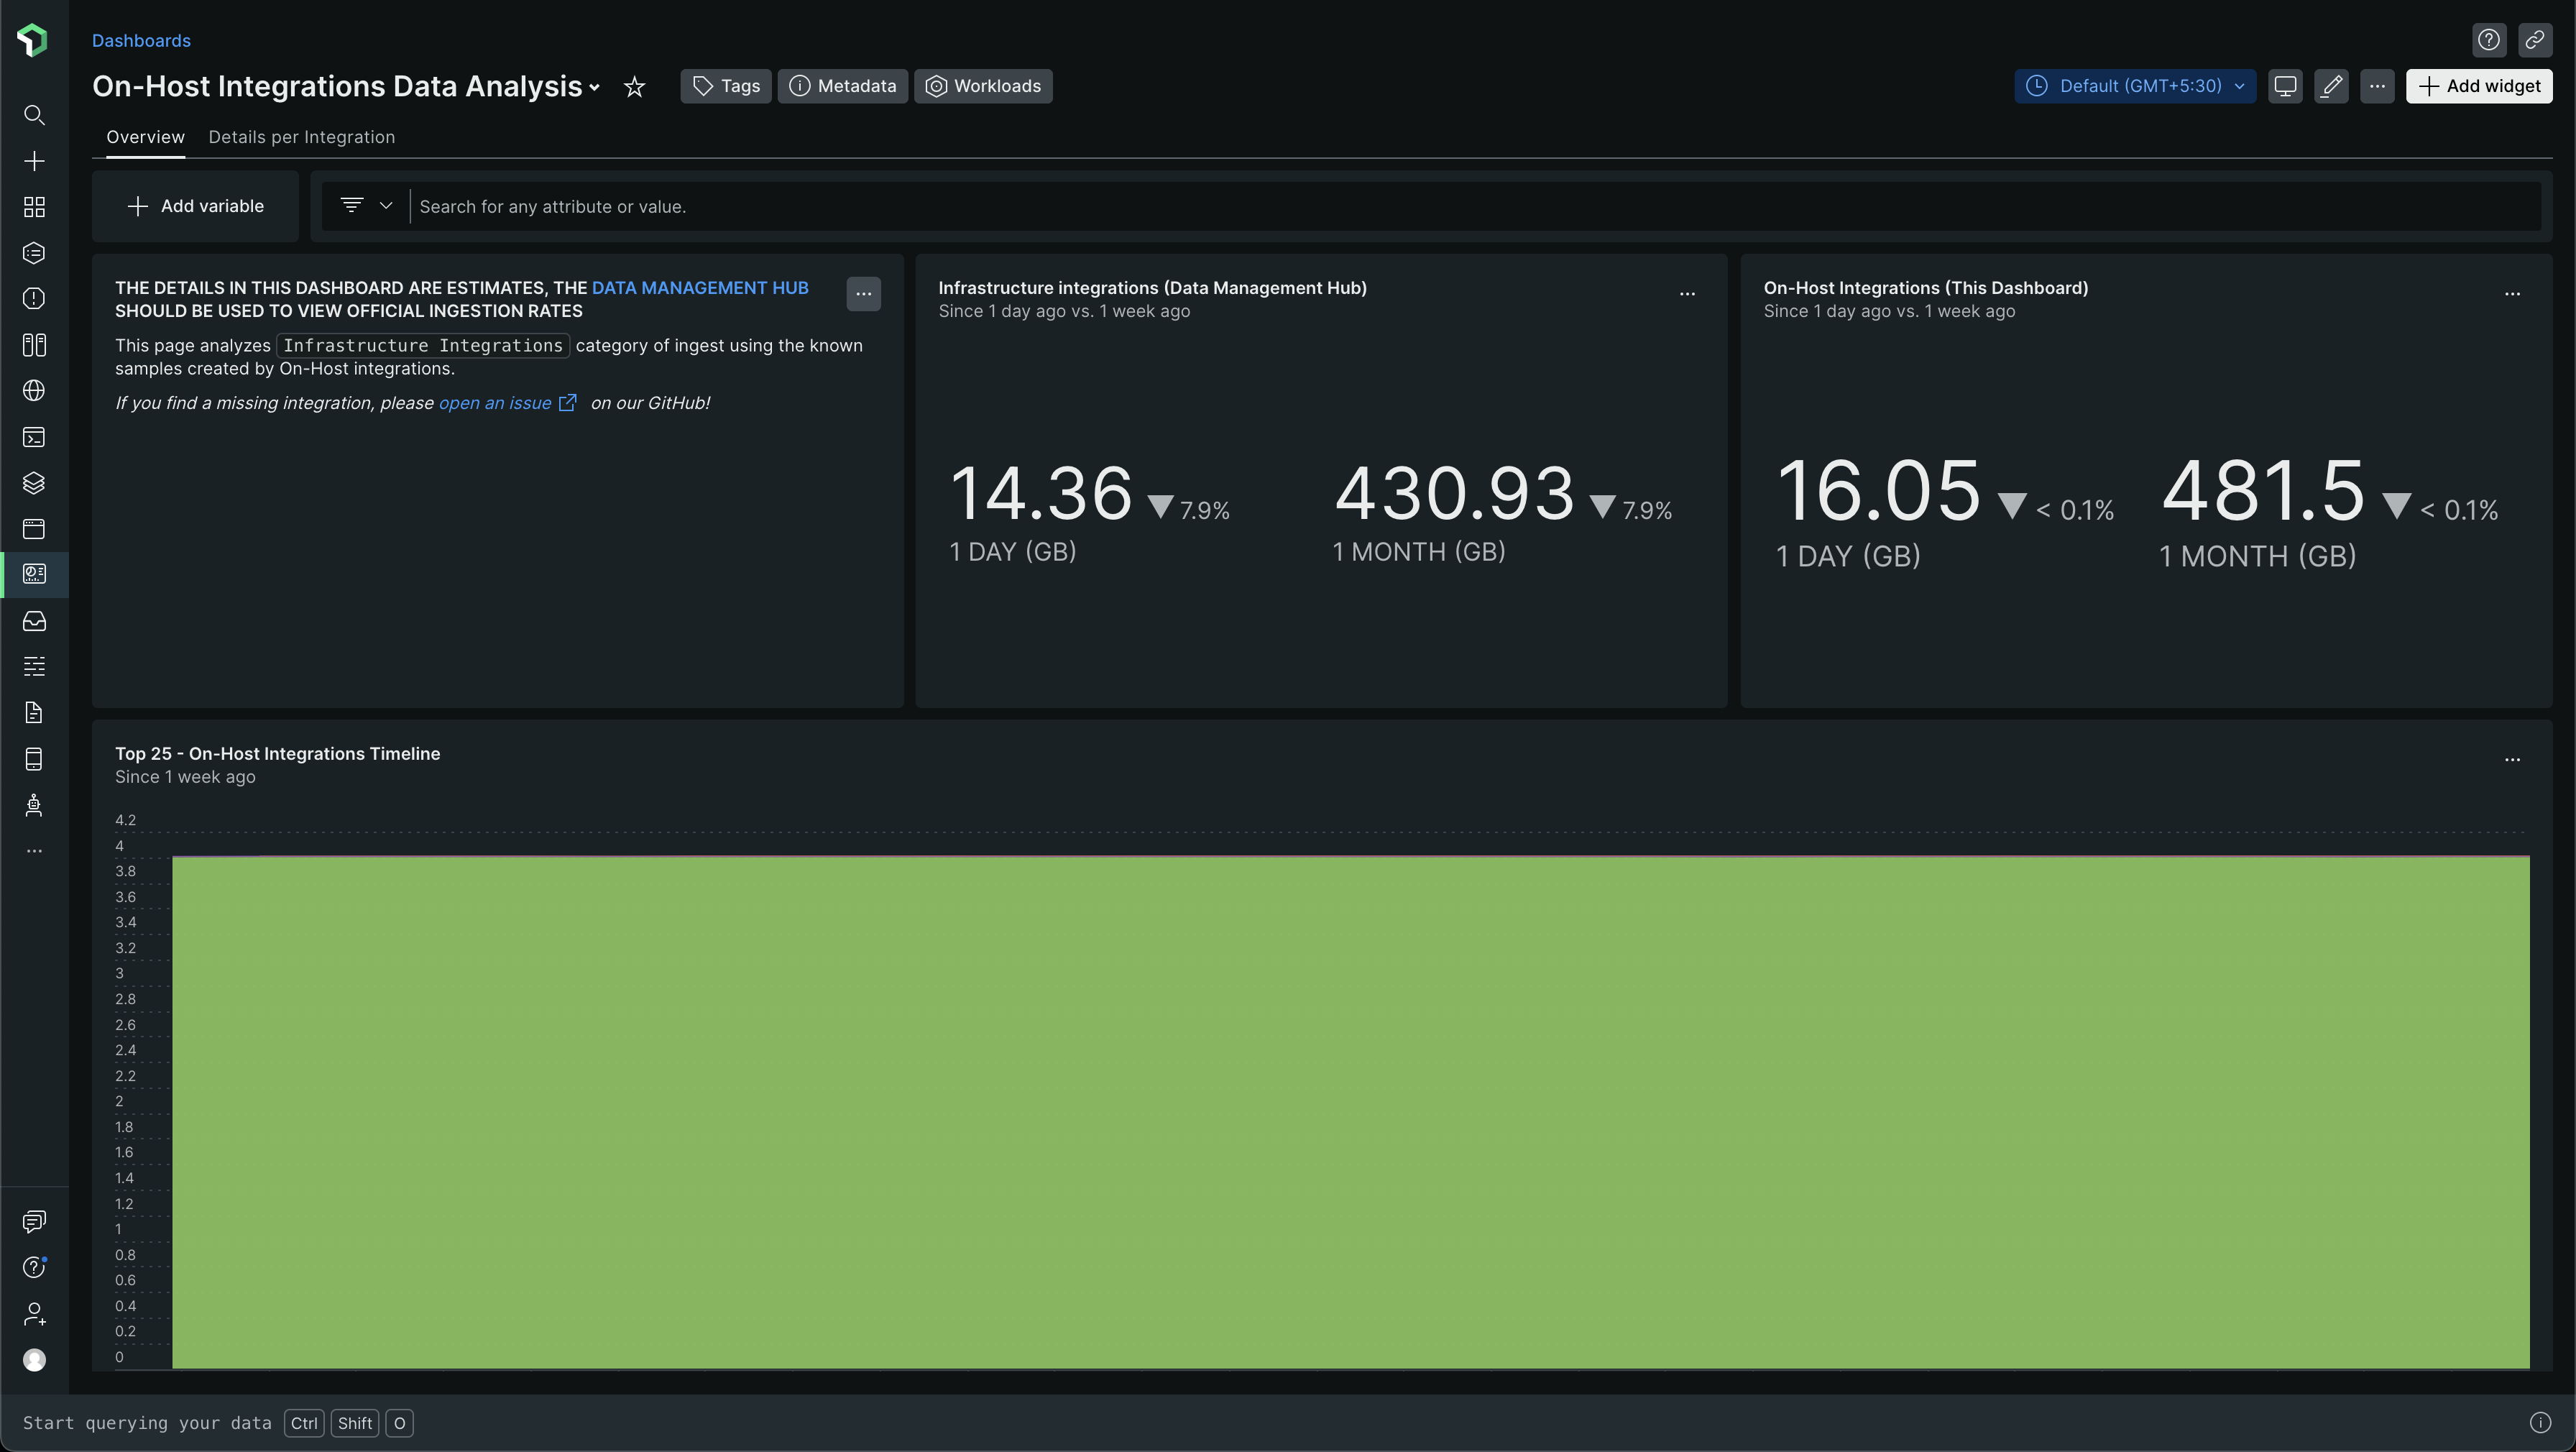
Look at how it has two tabs - Overview and Details per integration
The Details per integration is an important tab! Check it out! It looks like this -
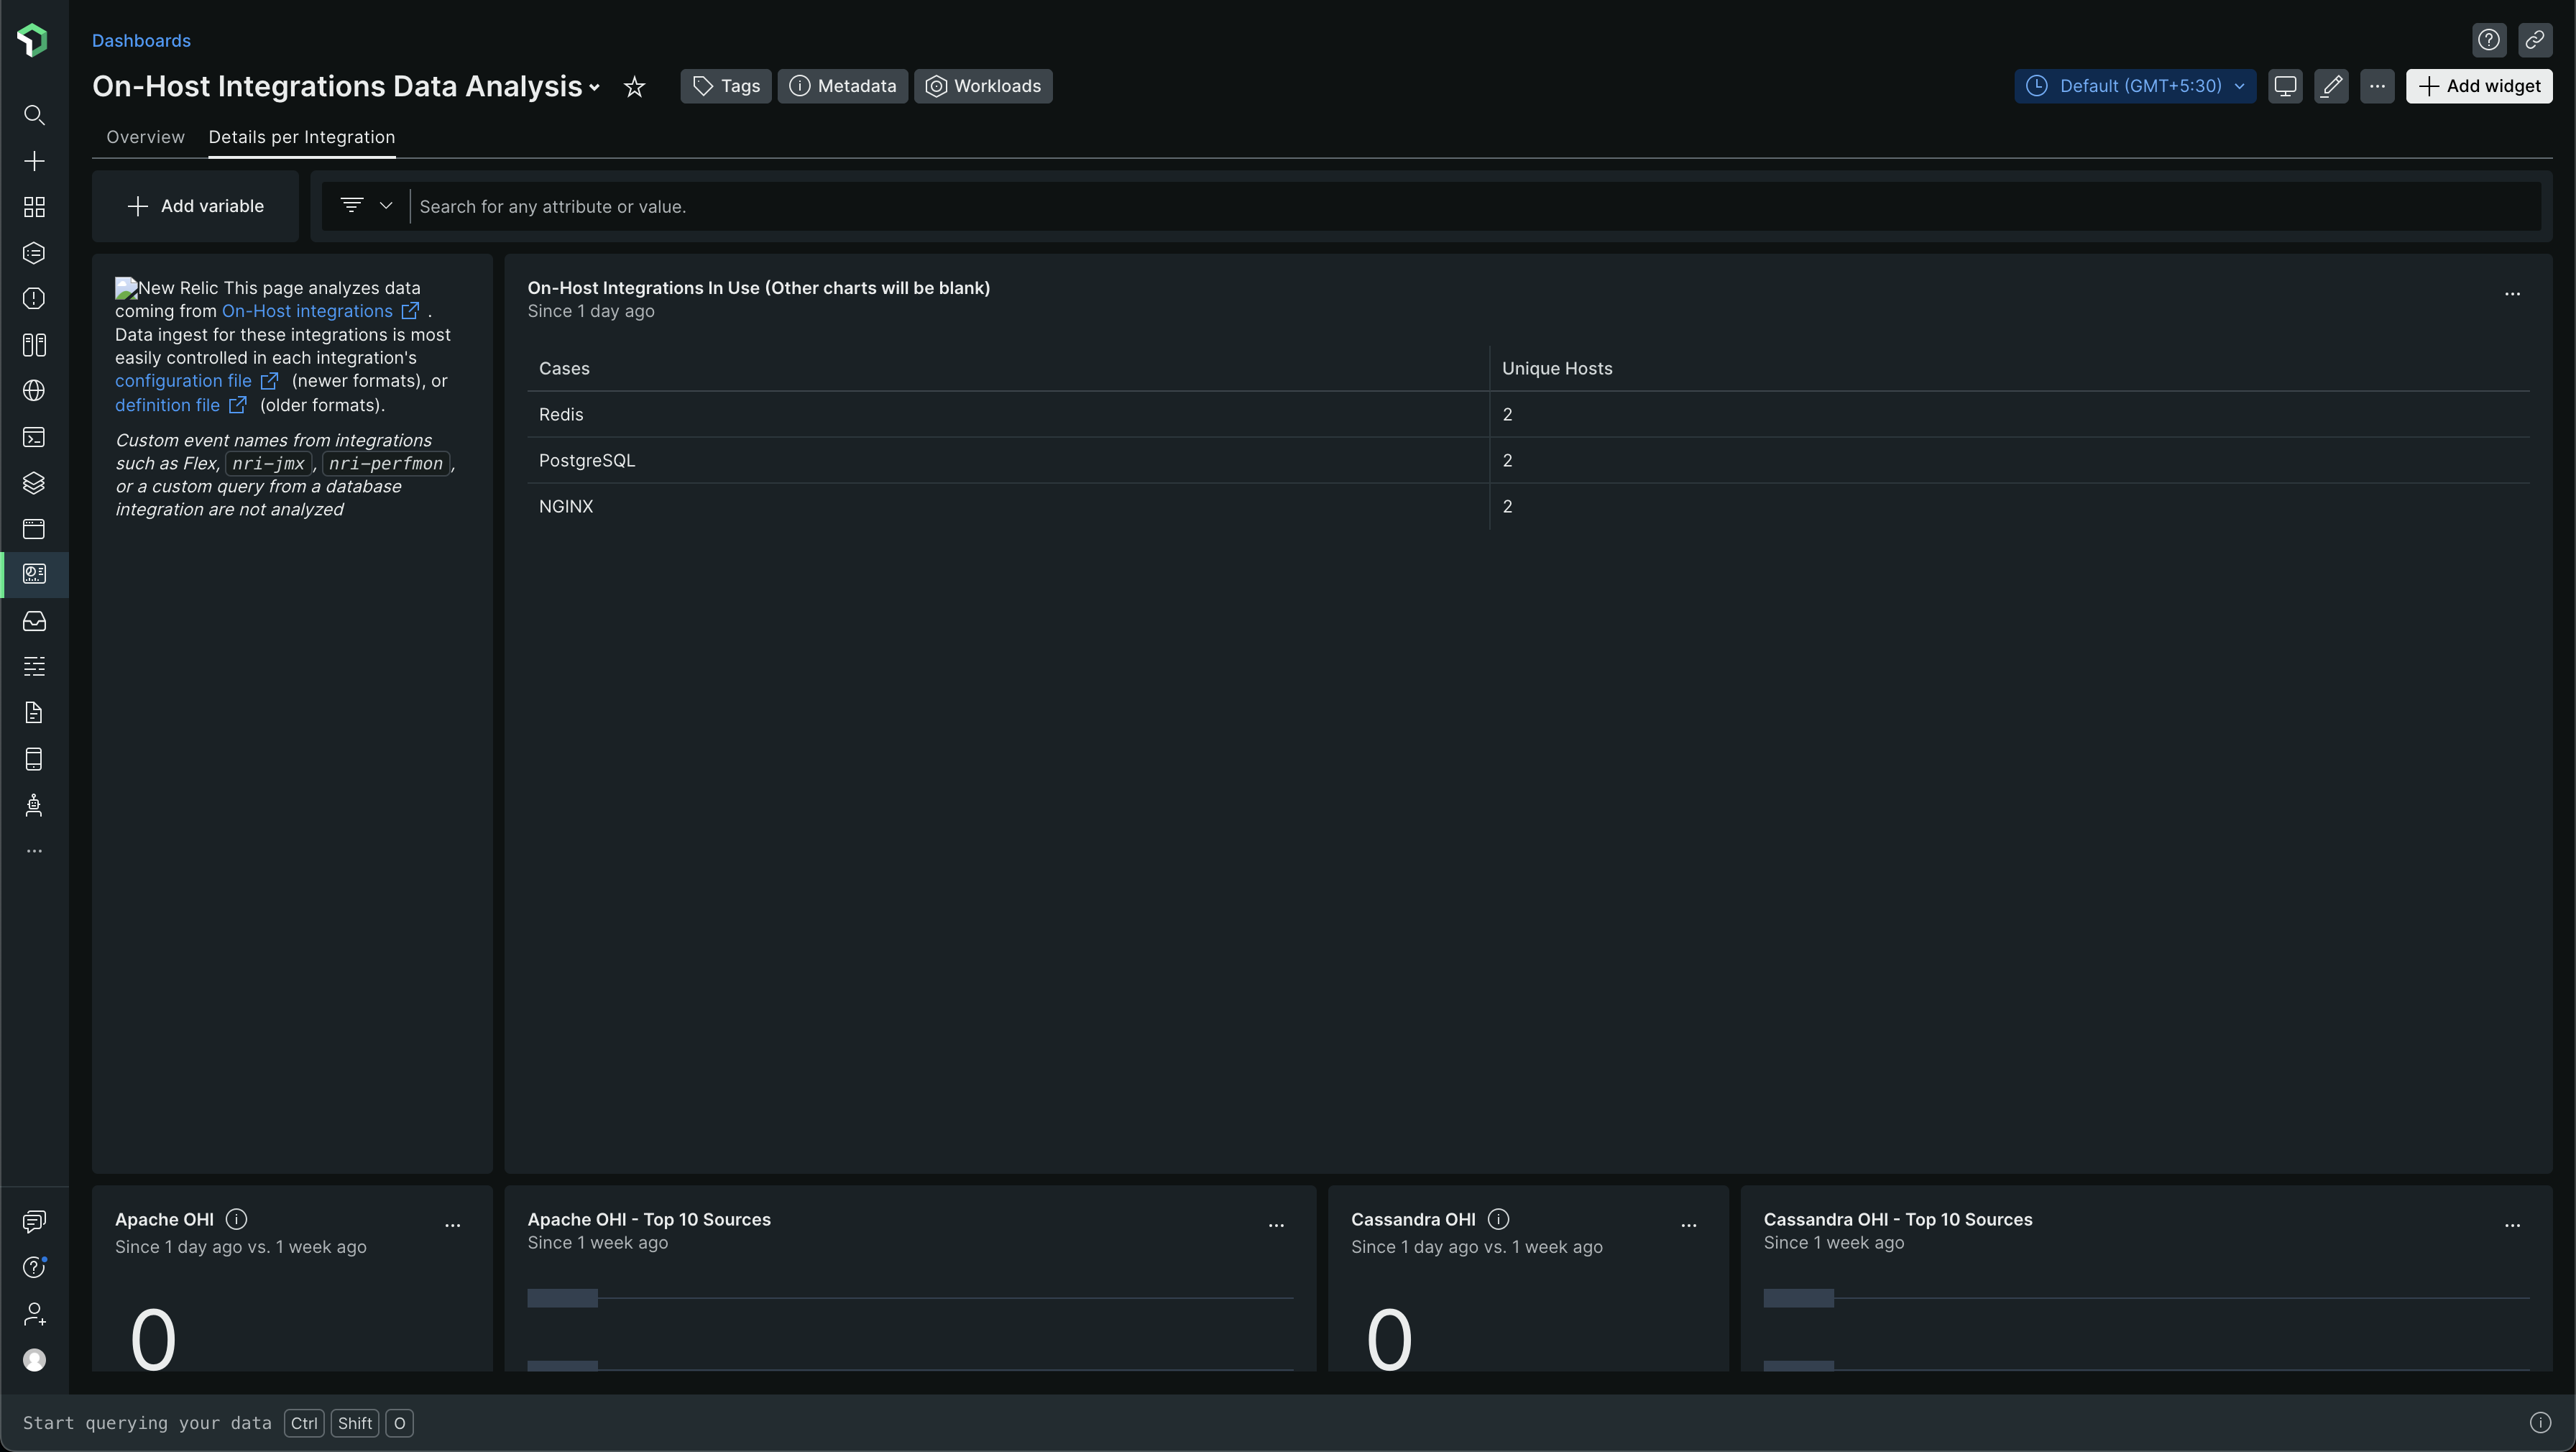
Scrolling down a bit, you will find data for whatever integrations you use. For example, in my case, Nginx, Redis, PostgreSQL
In my case, the data for PostgreSQL was the most -
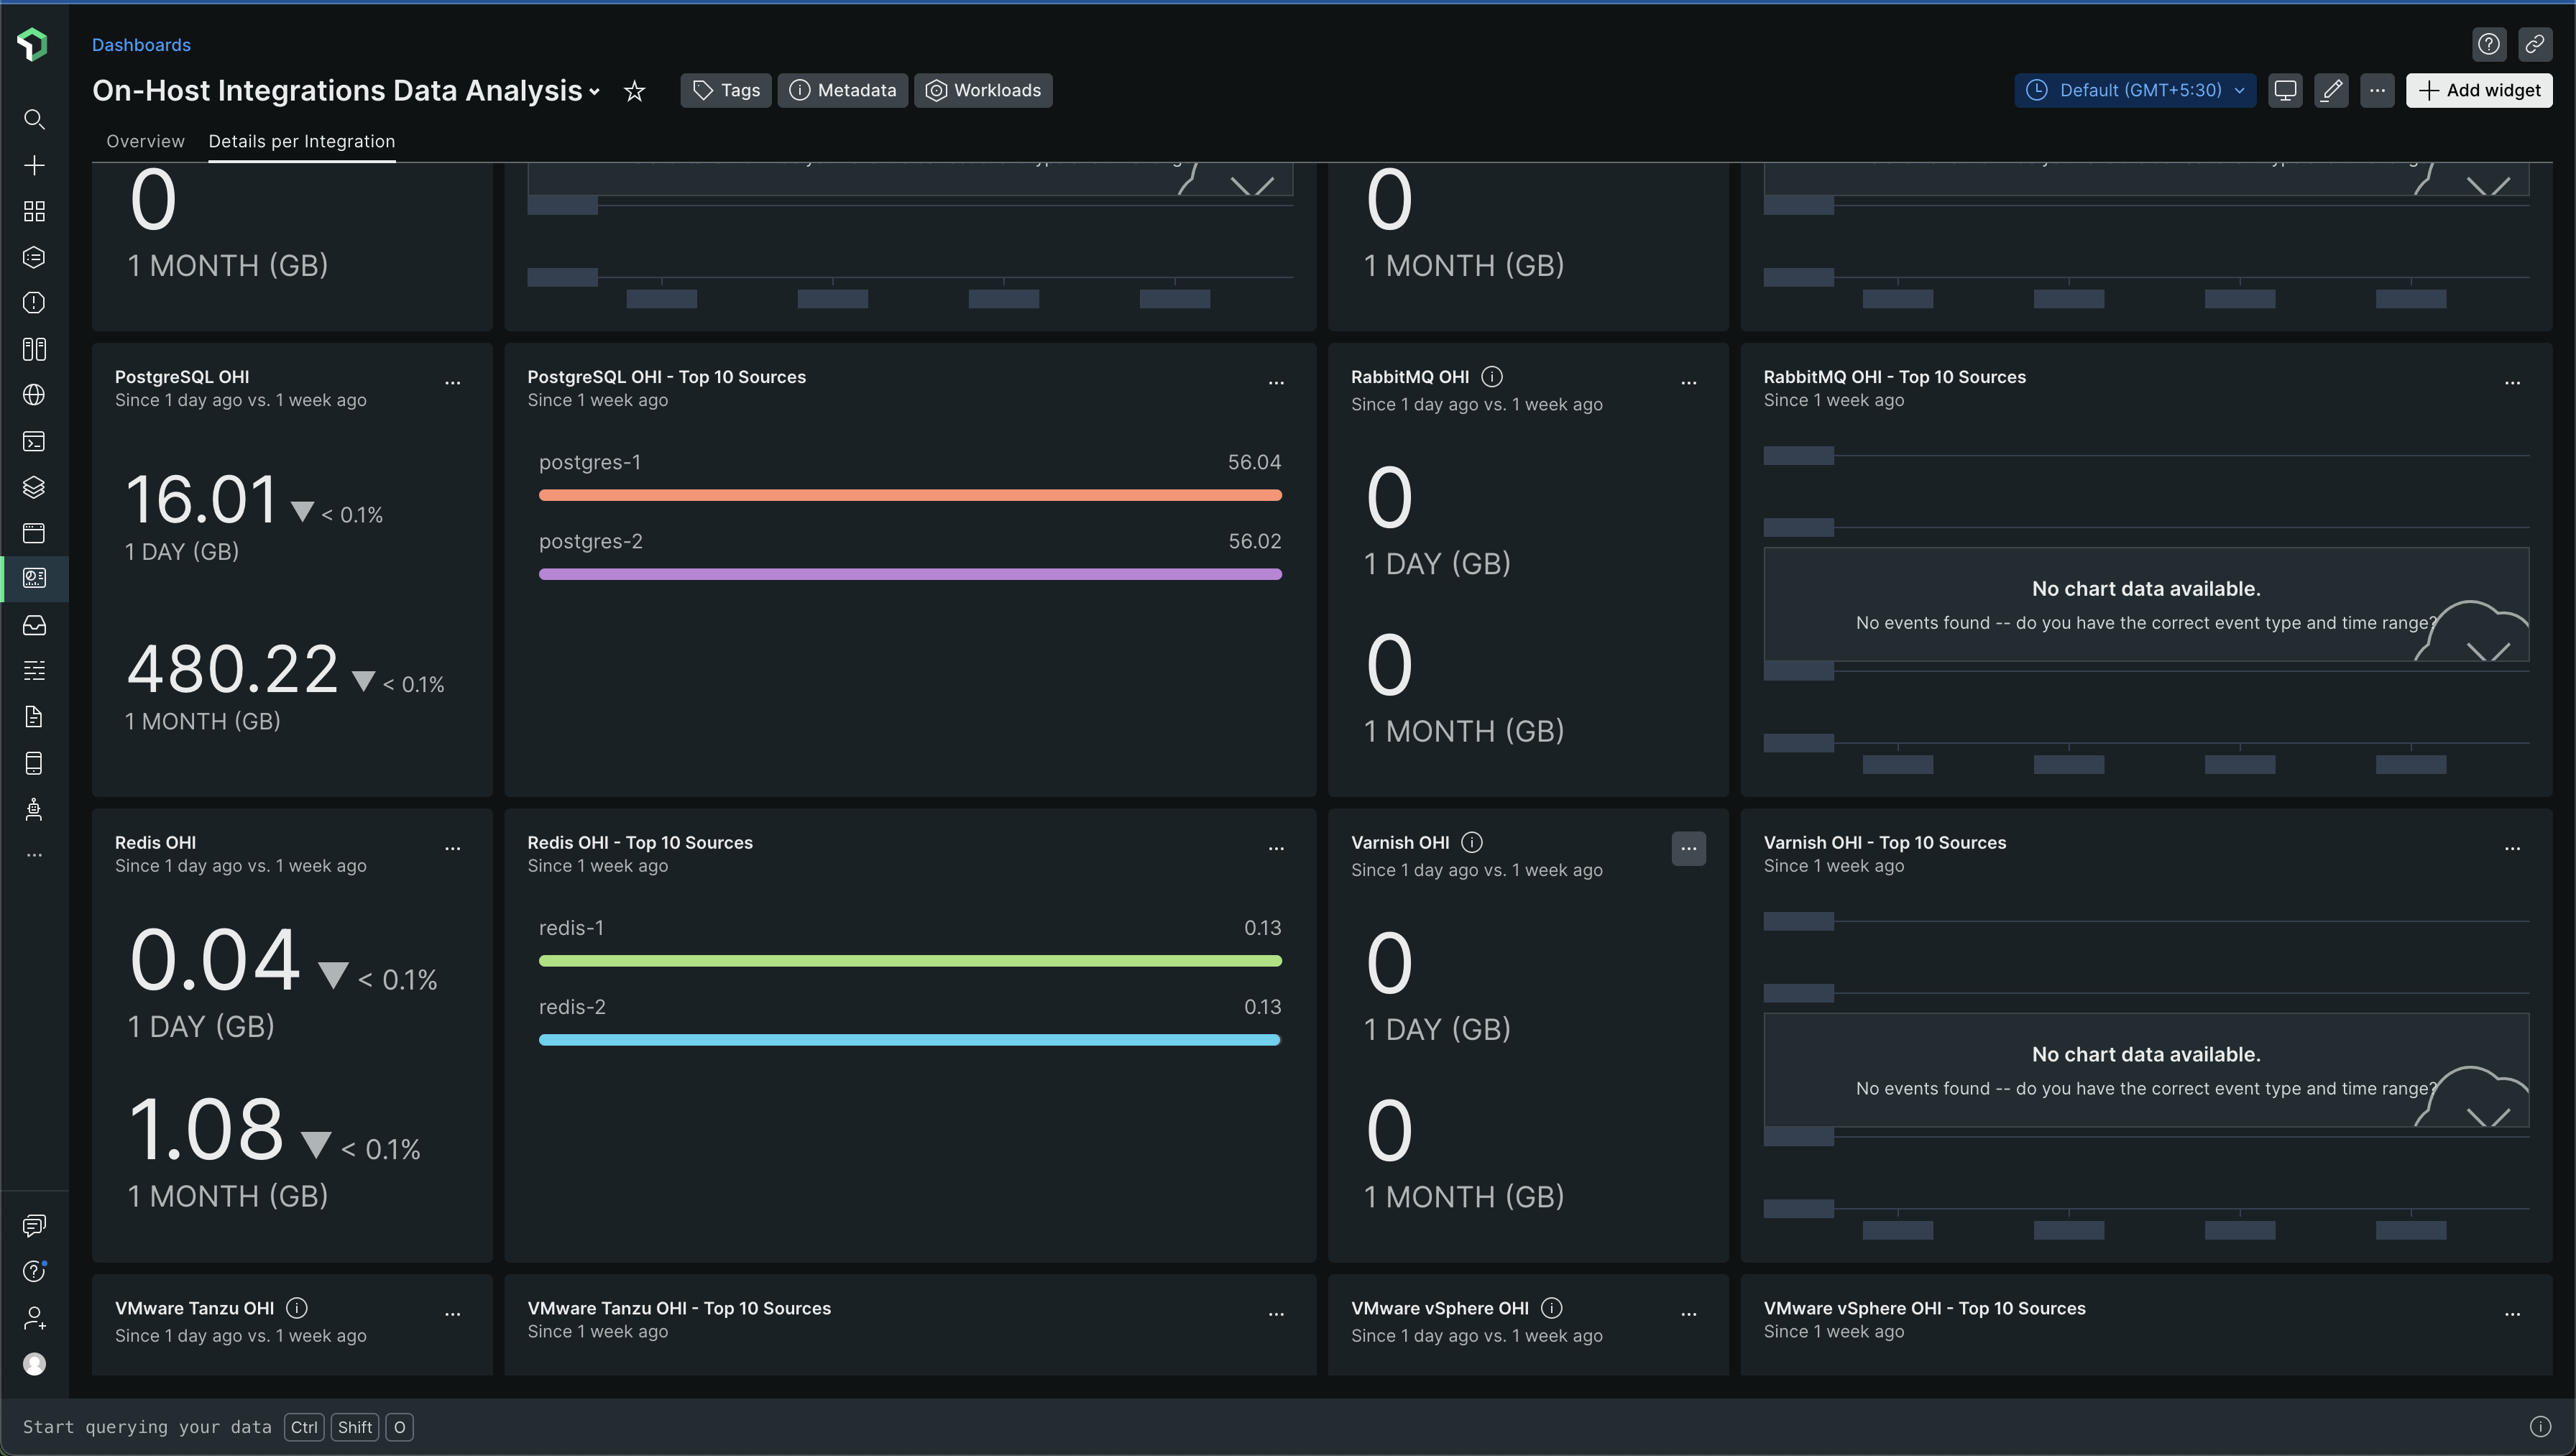
I think OHI is short for On-Host Integration
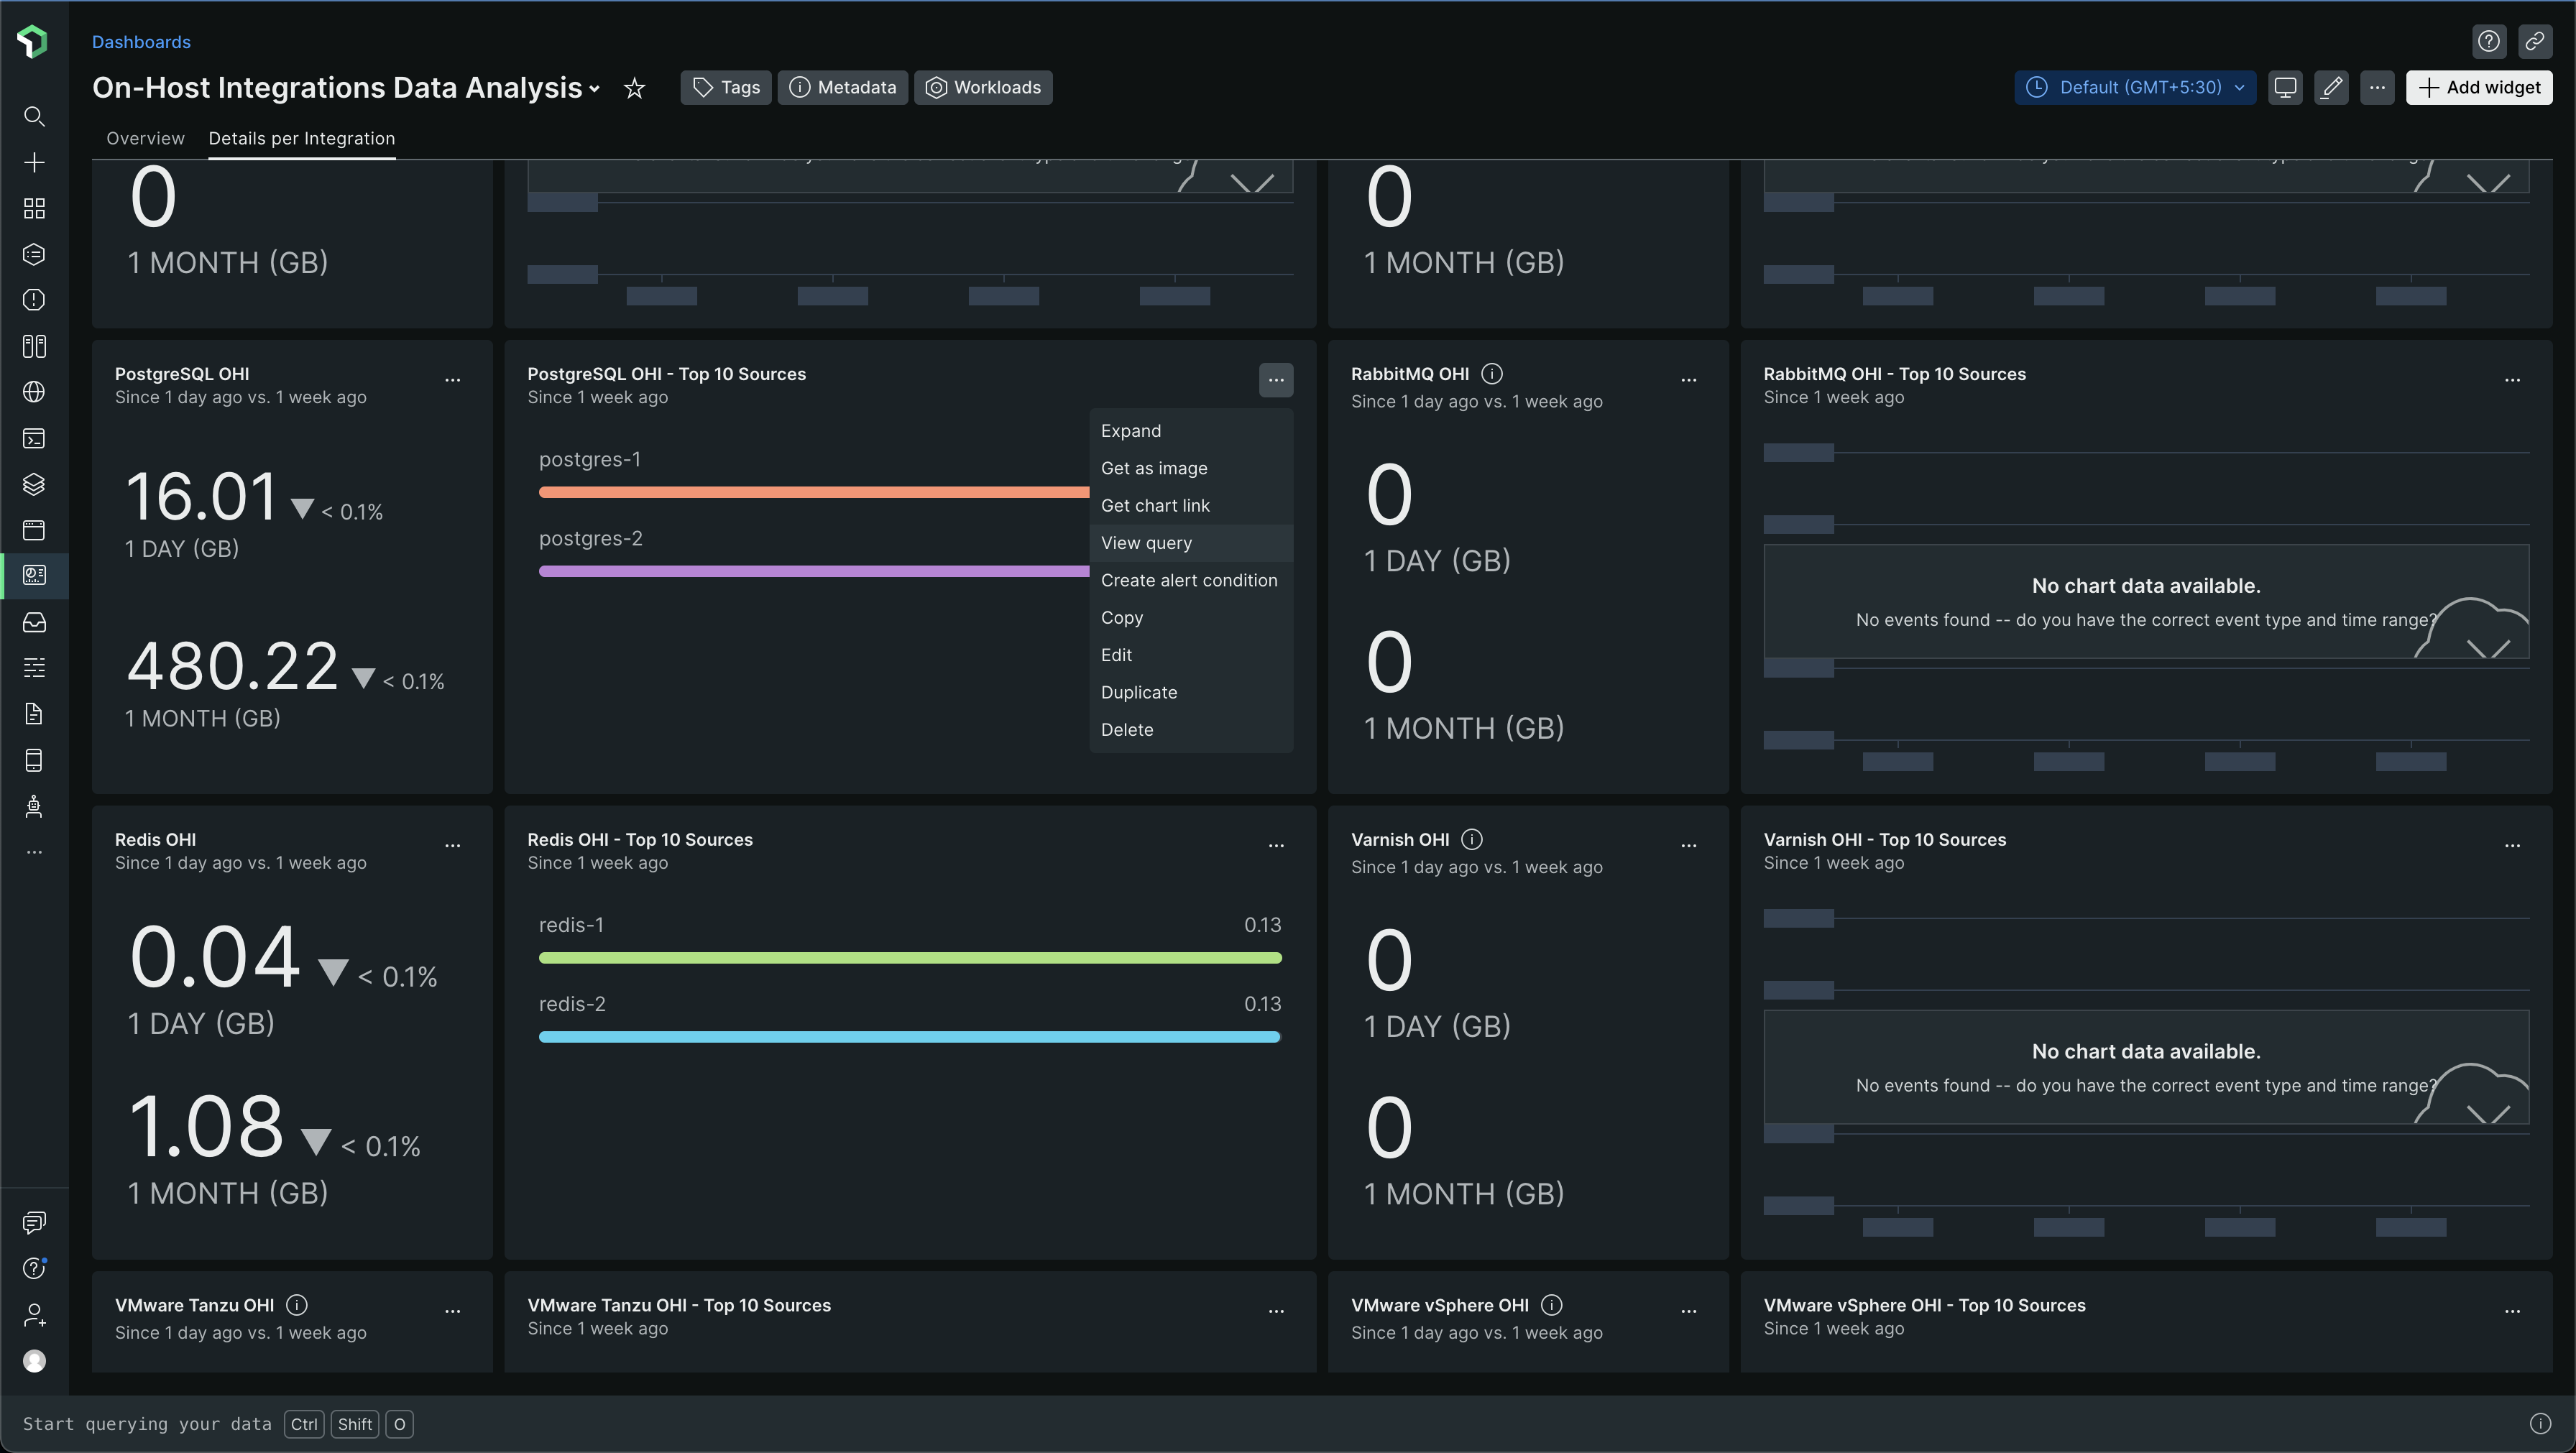
This will help you understand what integrations are ingesting a lot of data into New Relic. You can find the NRSQL for this chart and use it to create your own dashboard!
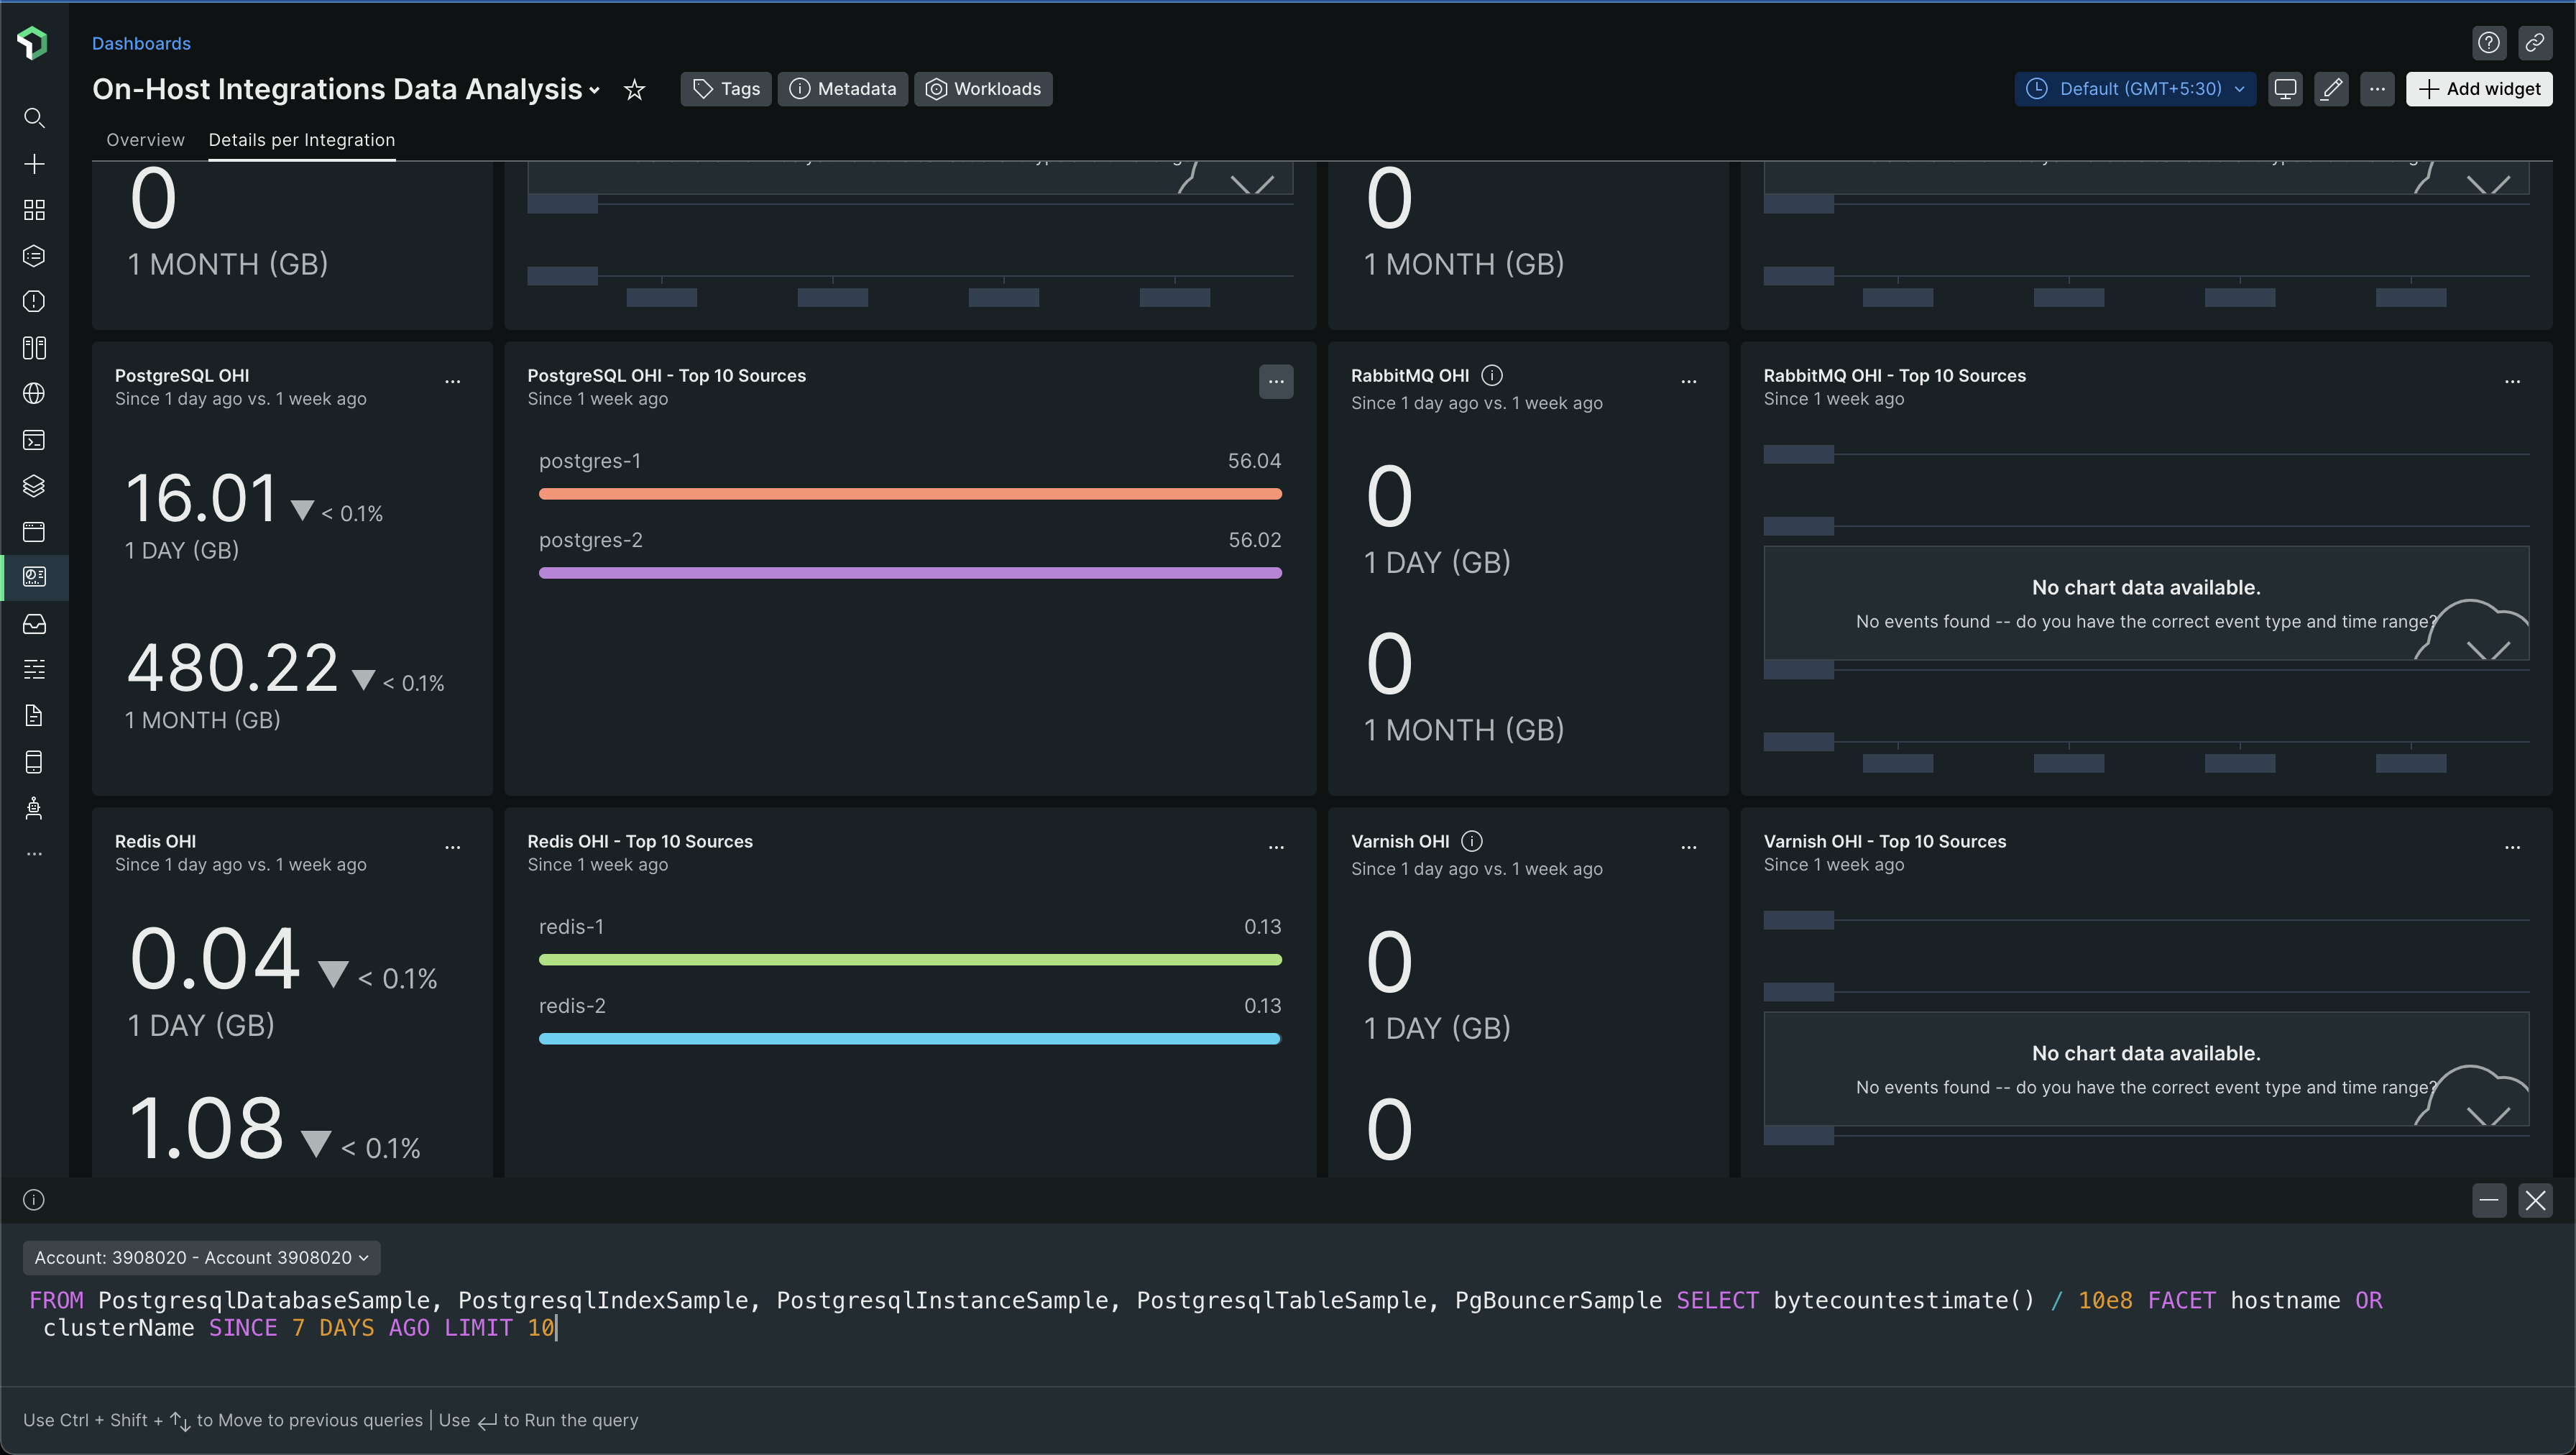
For example, the NRQL for the PostgreSQL chart was -
FROM PostgresqlDatabaseSample, PostgresqlIndexSample, PostgresqlInstanceSample, PostgresqlTableSample, PgBouncerSample SELECT bytecountestimate() / 10e8 FACET hostname OR clusterName SINCE 7 DAYS AGO LIMIT 10
You can also find some visualizations around ingestion in another dashboard, named as Data Ingestion Breakdown
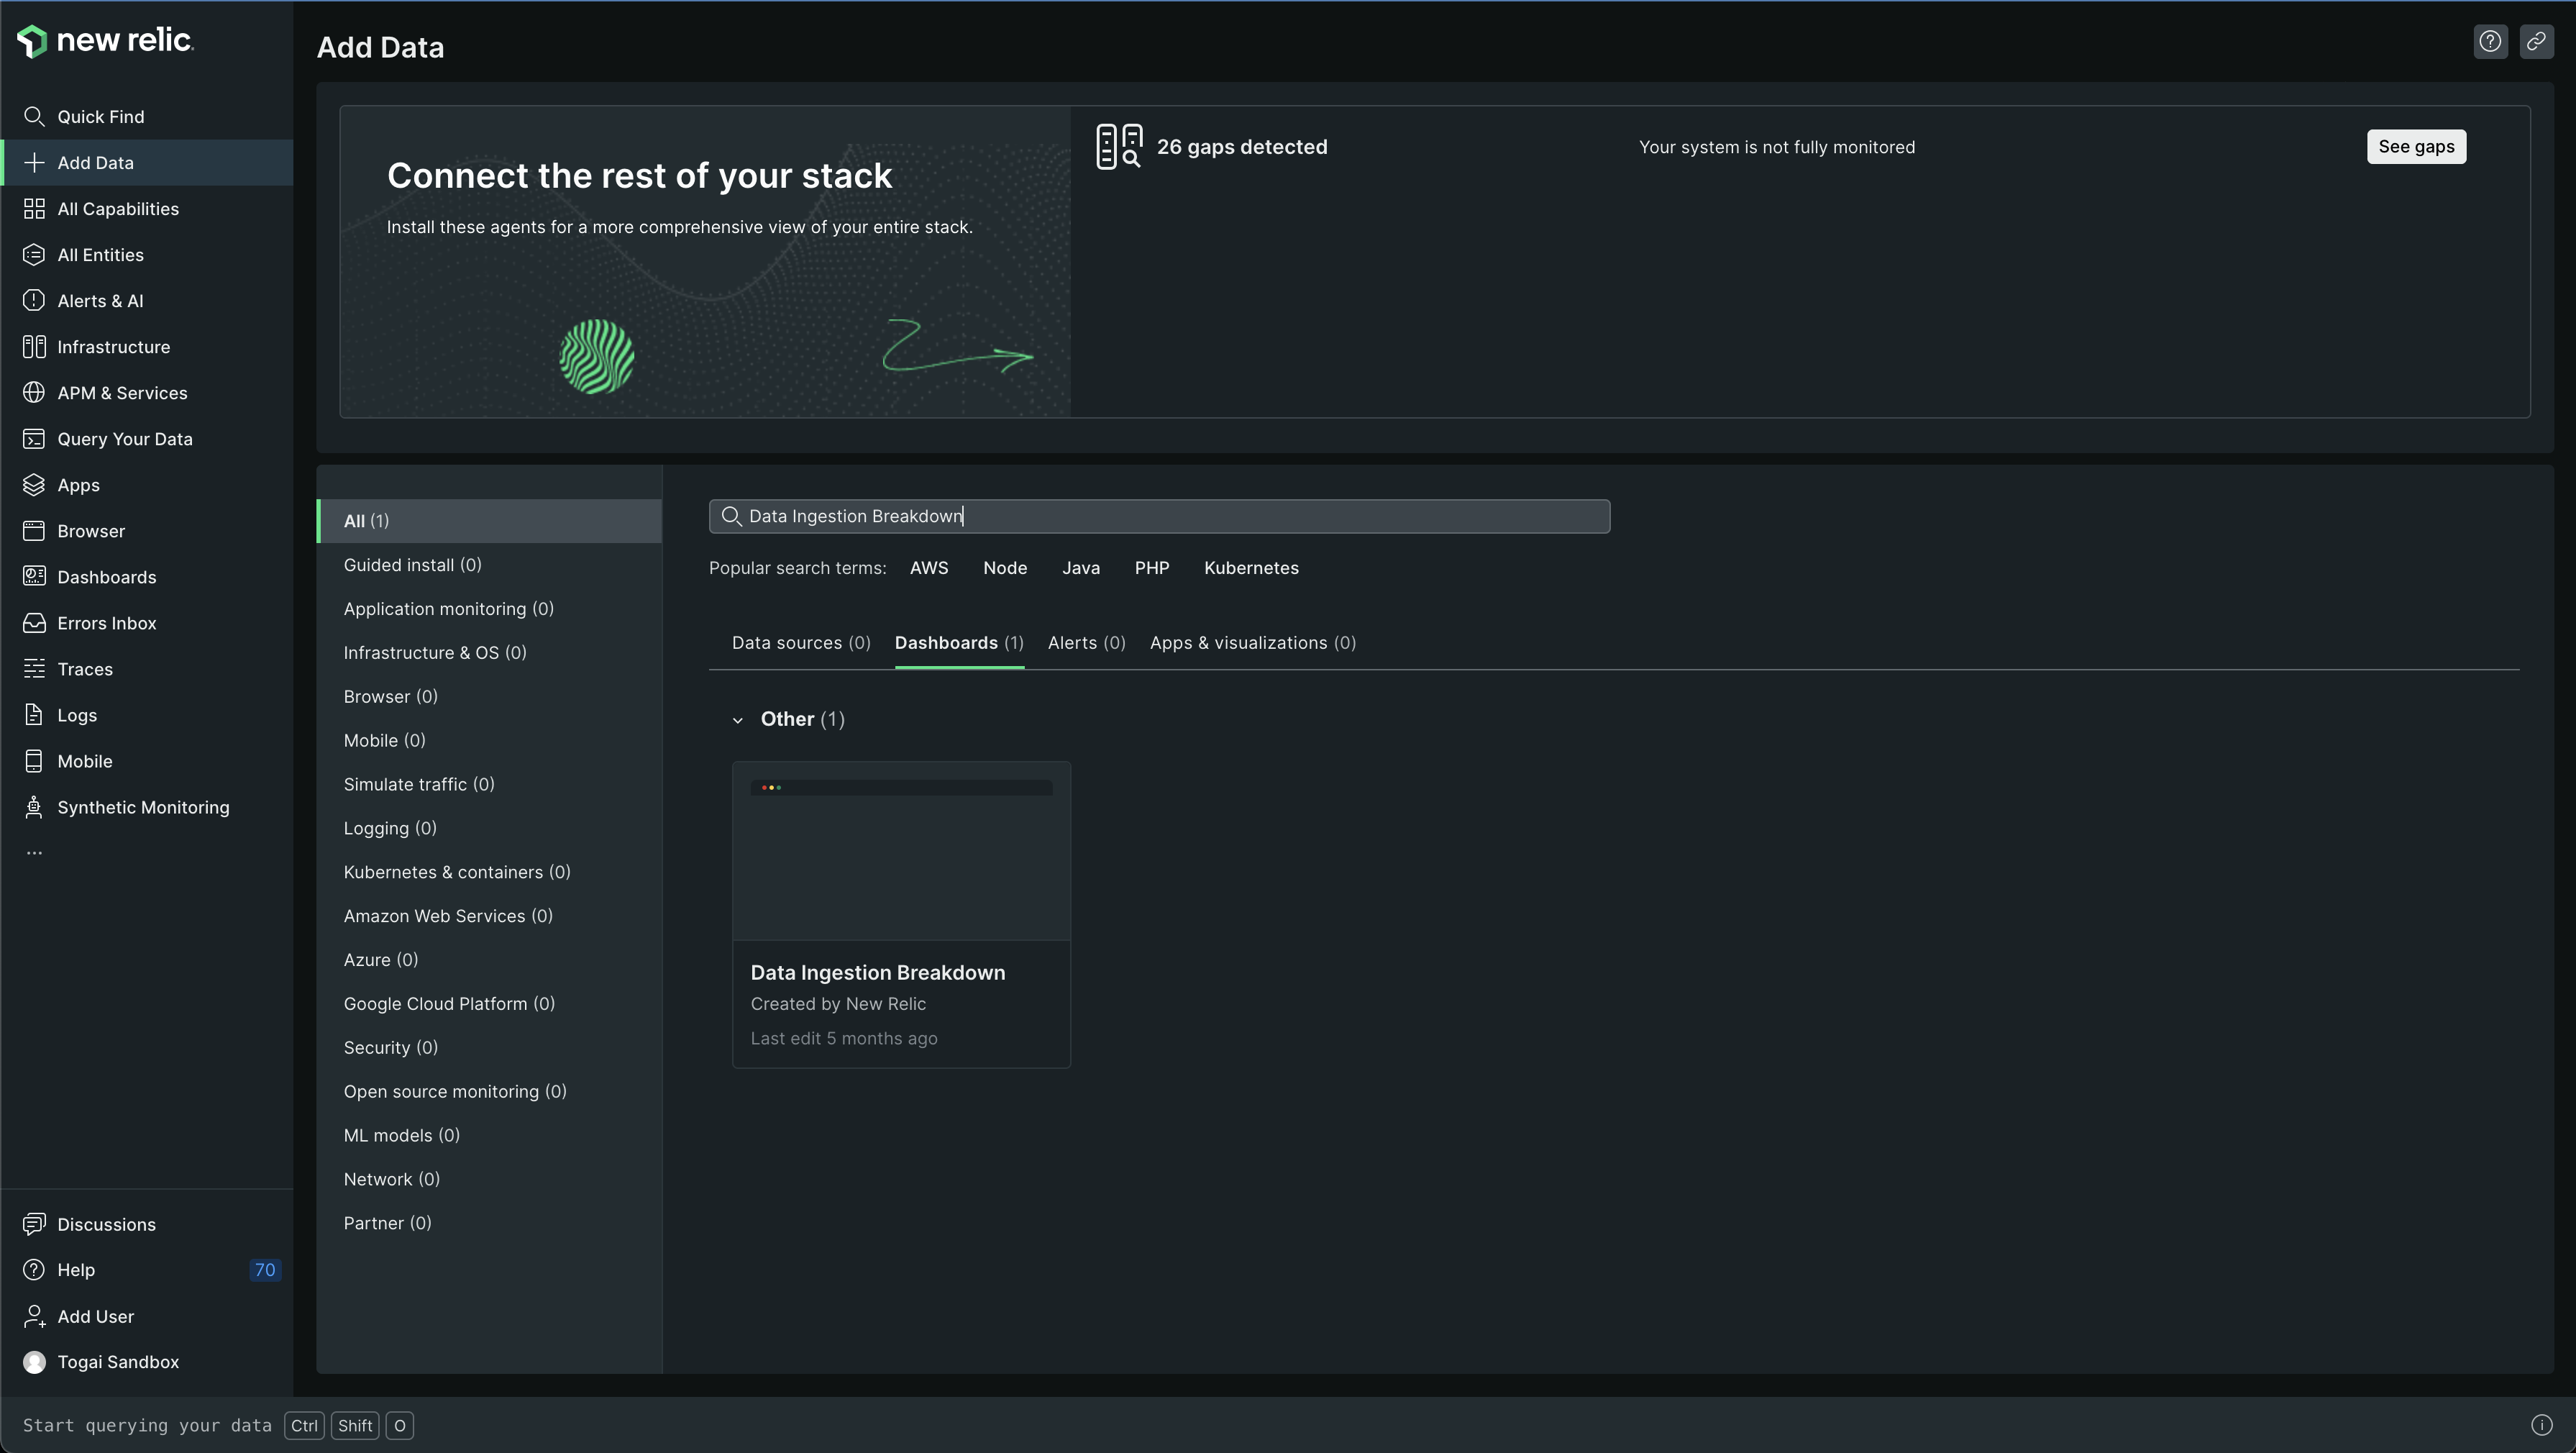
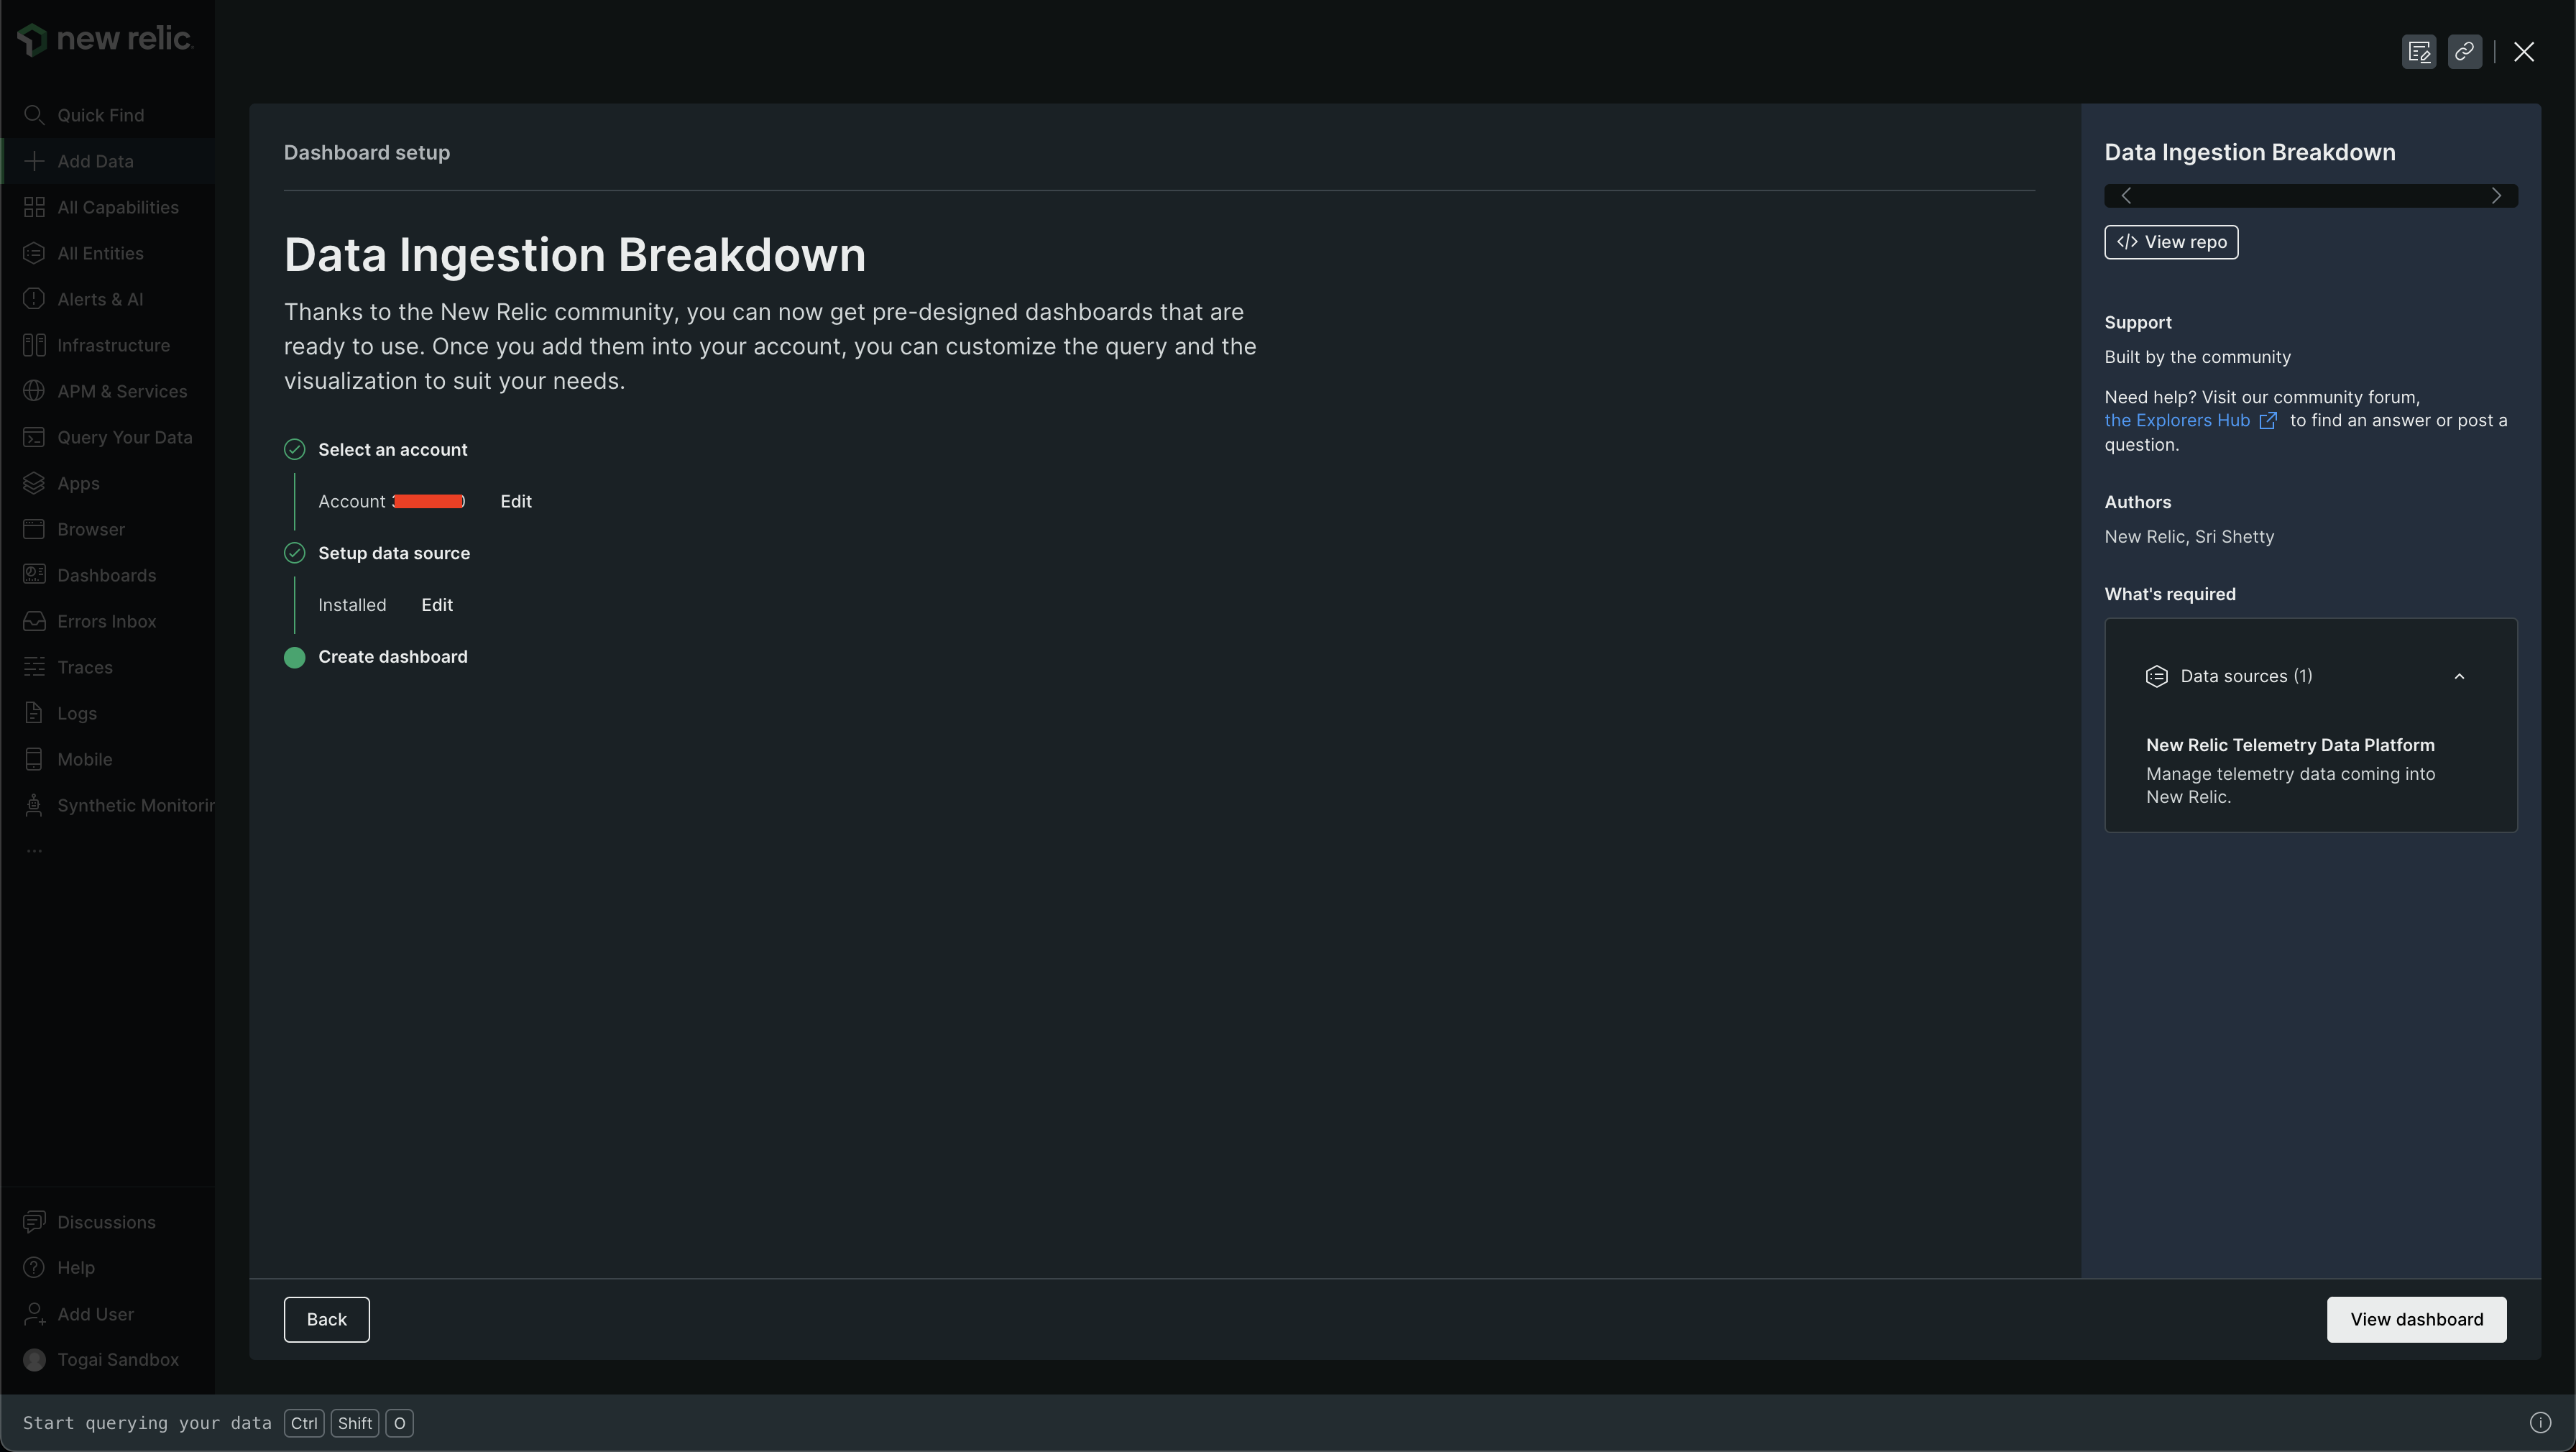
The dashboard will look like this -
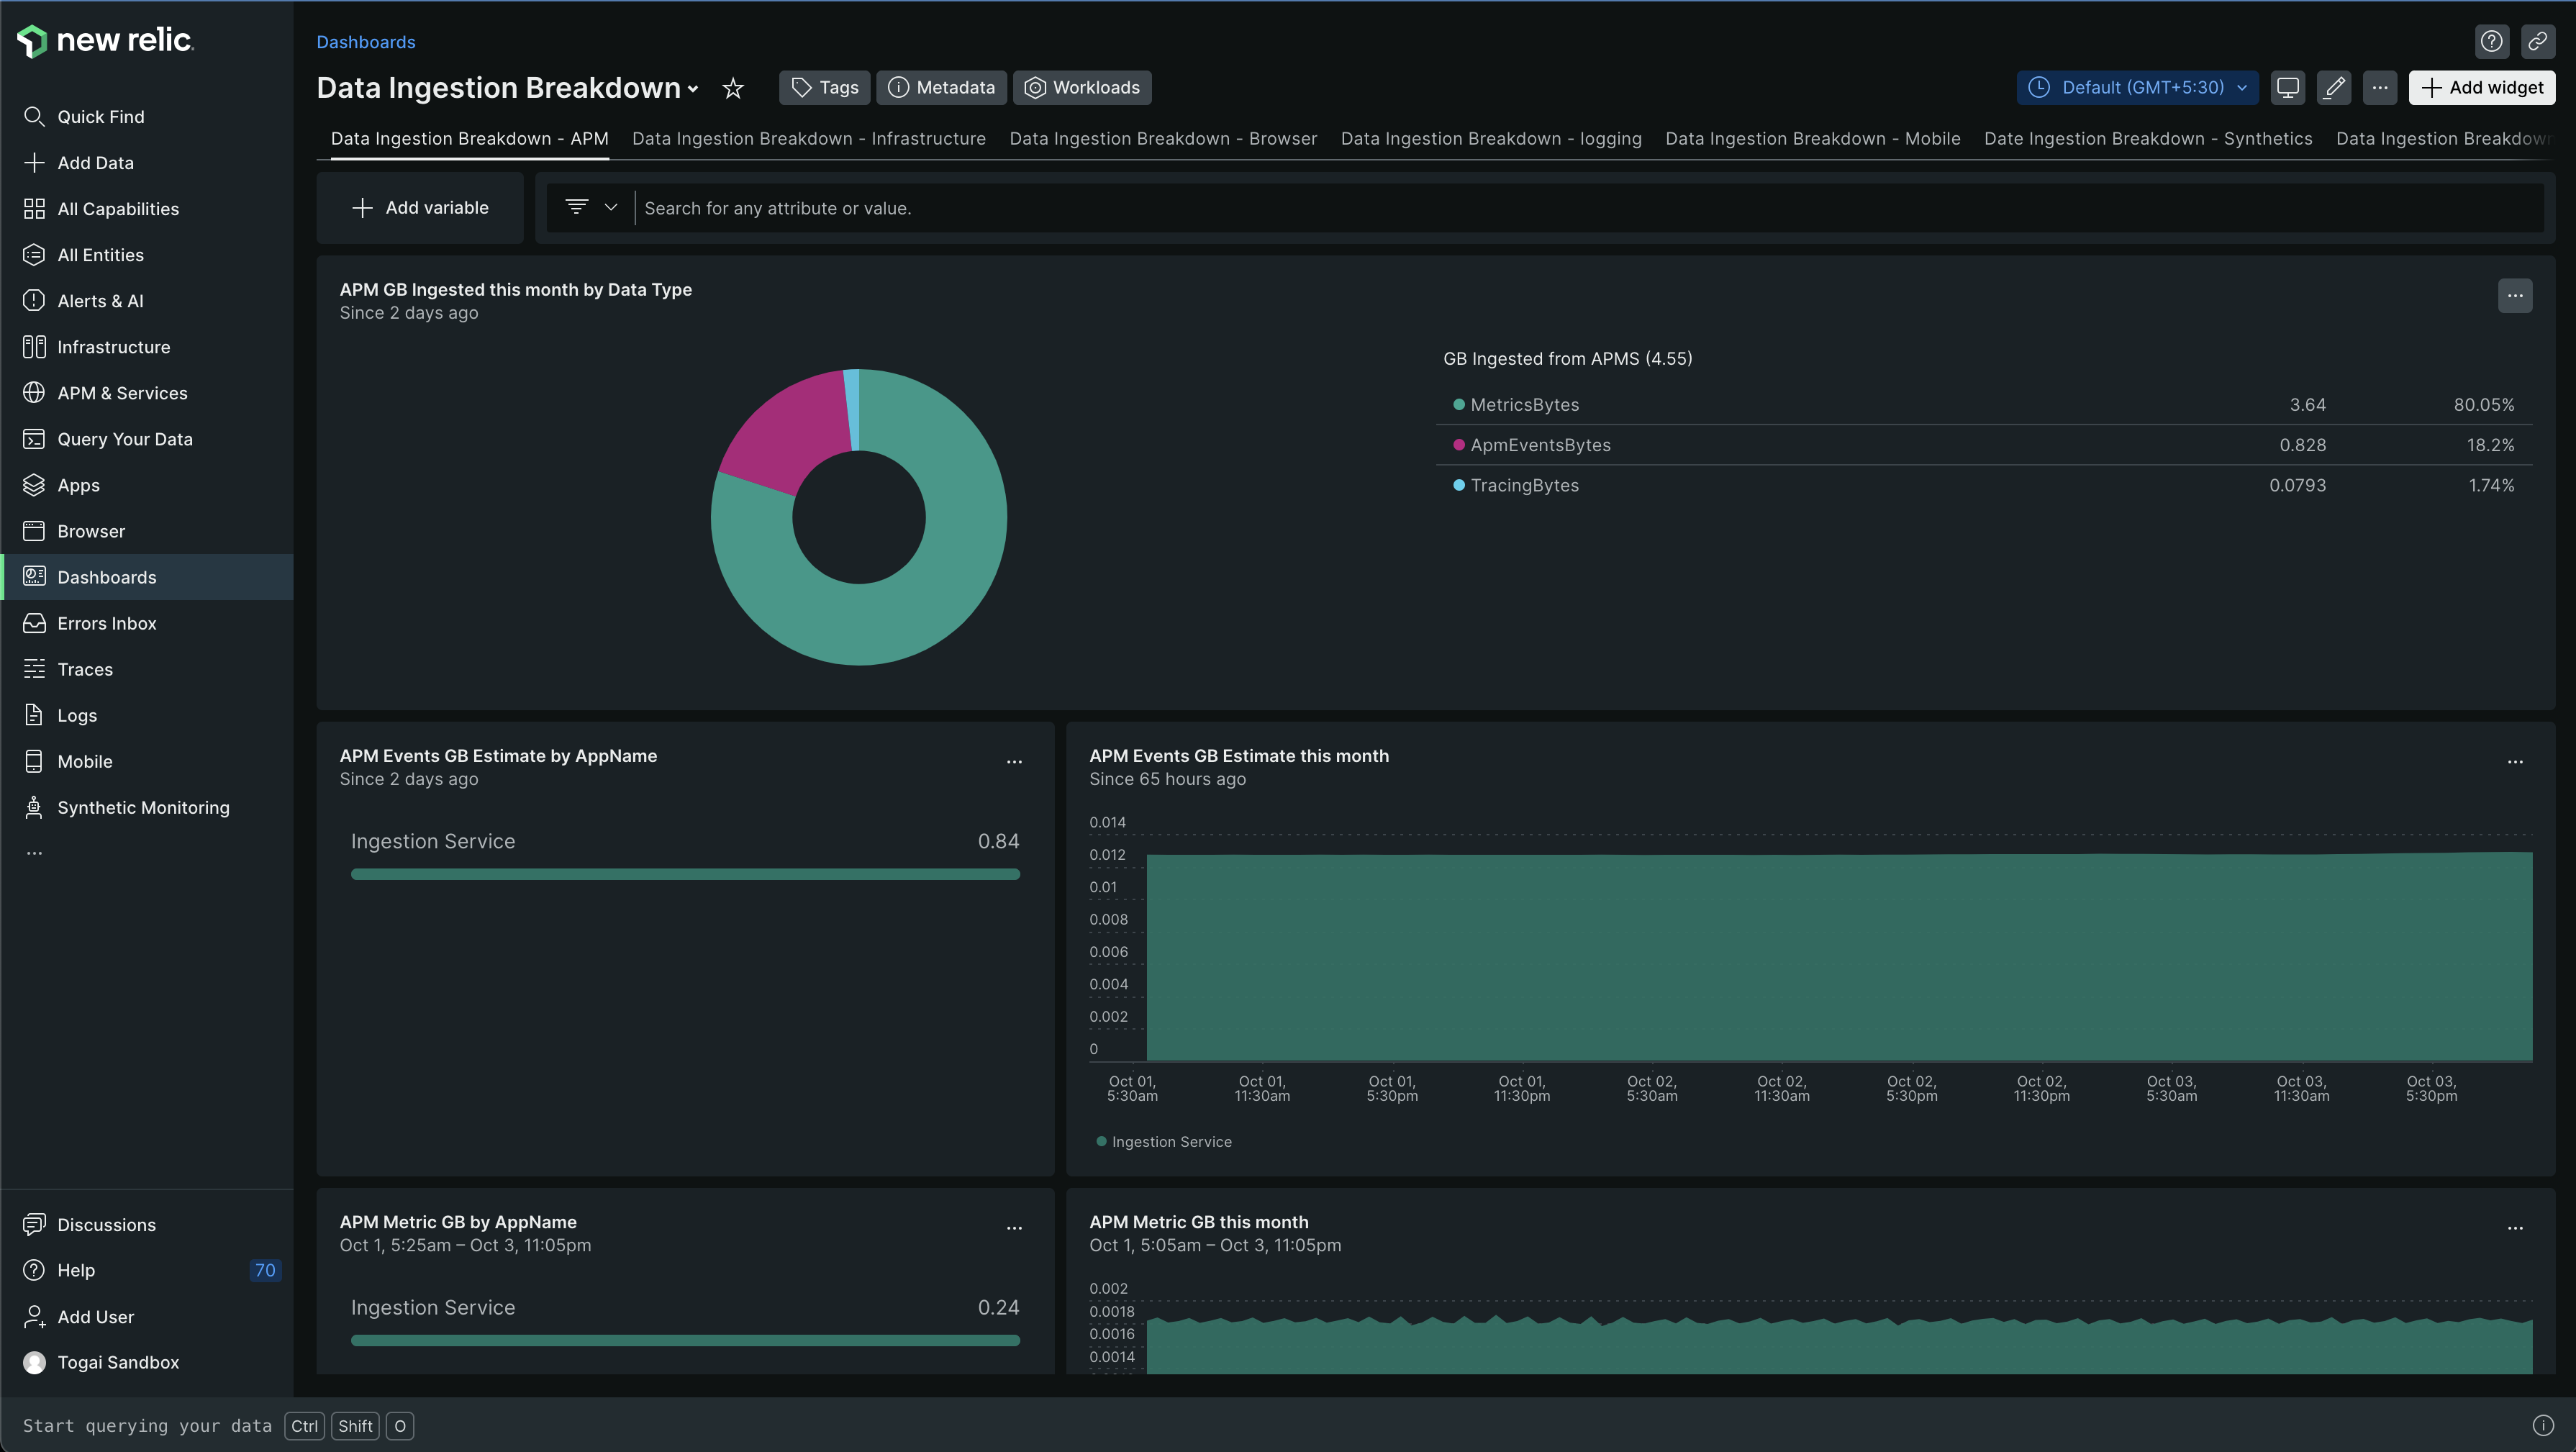
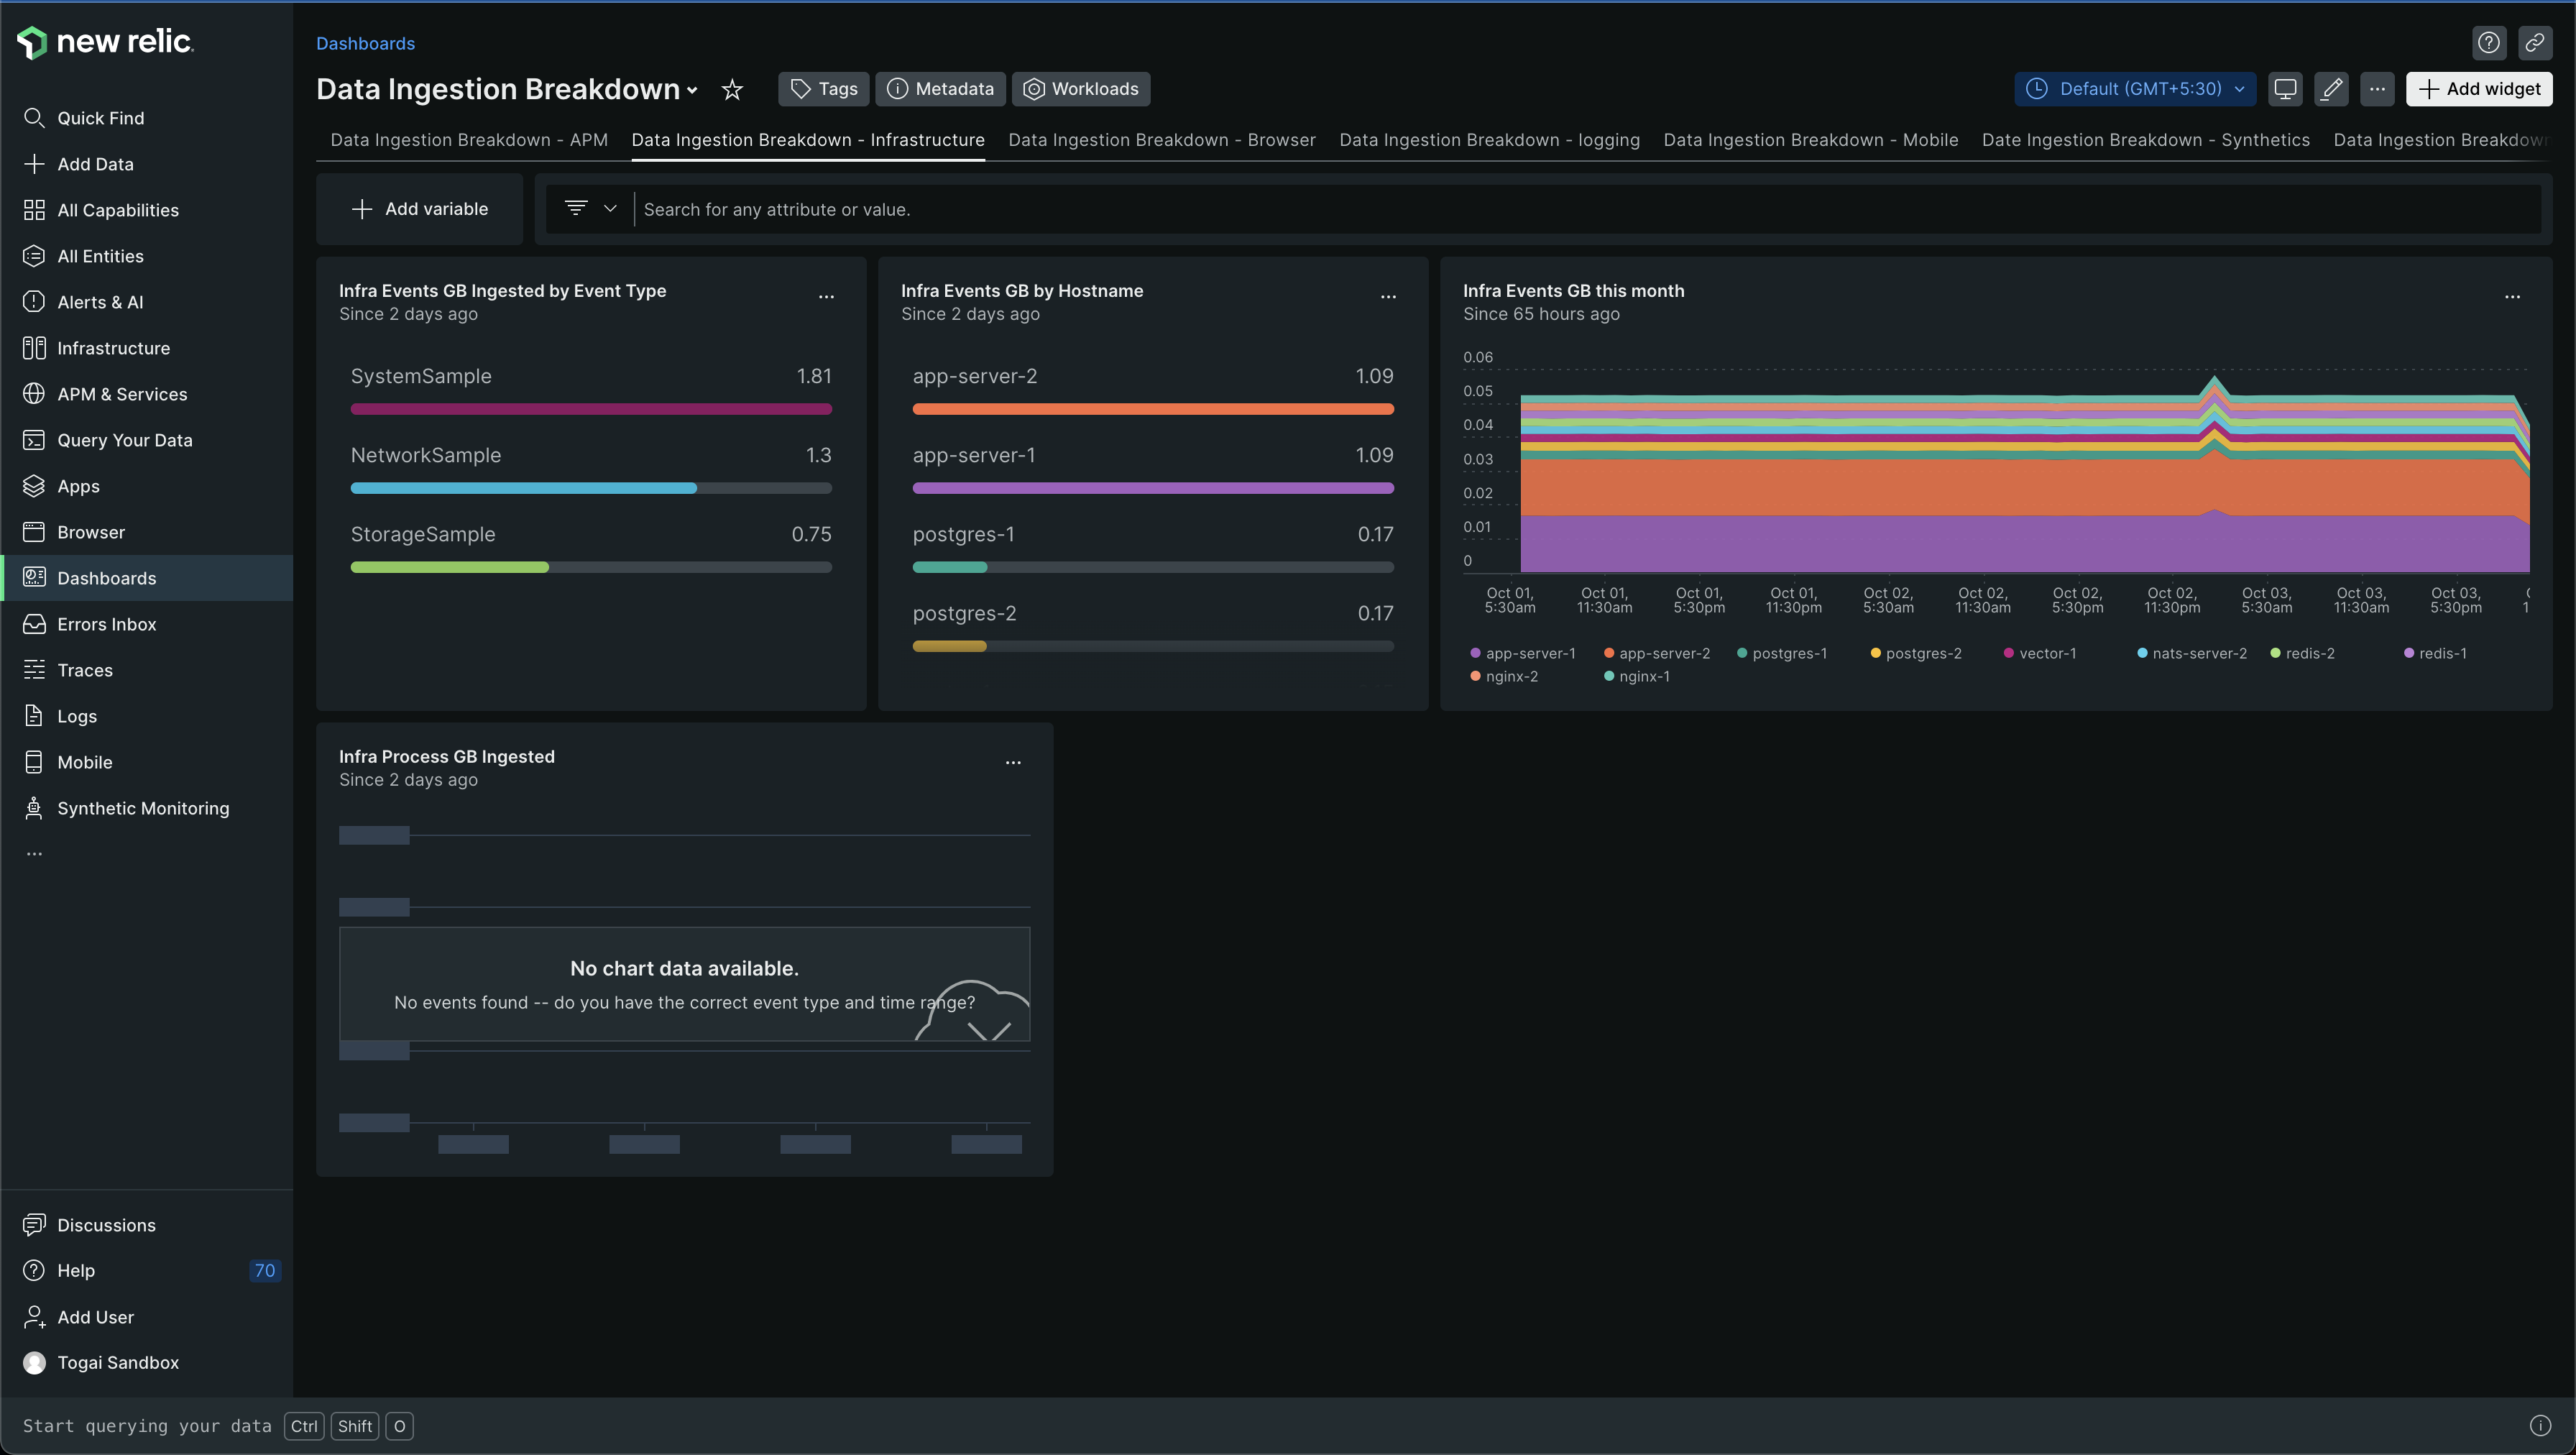
In this dashboard, you can see SystemSample, NetworkSample, StorageSample. These are all different from PostgresDatabaseSample etc. we saw in the previous dashboard and the corresponding NRQL query which showed the sample name
This should help you understand what is ingesting a lot of data in your infrastructure. And then debug why a particular component is ingesting a lot of data.
I'll write ✍️ another blog post on how to find "why a particular component is ingesting a lot of data?" after I debug the problem in our sandbox environment. My guess - either too much data is being sent because of the data in each sample, or too many samples are being sent for some reason.
One thing that differentiates our sandbox environment from other environments is - it's highly used by our customers to do rigorous testing, as they have access to only sandbox and production environment and no one wants to test in production - it would put a lot of load on production in this case 😅 Staging environment is used by our developers and other people to test latest changes, which may or may not break. Production is used mostly just by our customers and a little bit by our developers and team members for testing at a small level, for demos etc.
Maybe because the sandbox environment is being rigorously tested it is causing high data ingestion at the Postgres level. Not sure though. Gotta validate that question and also look at other possibilities by backtracking/tracing the issue
Subscribe to my newsletter
Read articles from Karuppiah Natarajan directly inside your inbox. Subscribe to the newsletter, and don't miss out.
Written by

Karuppiah Natarajan
Karuppiah Natarajan
I like learning new stuff - anything, including technology. I love tinkering with new tools, systems and services, especially open source projects