Building traceroute in javascript
 Frank
Frank
I always found traceroute one of the most interesting network utilities, as it gives you an insight on how data travels through a network. If you ping a server and get a response, it’s easy to forget that the data travelled through a cascade of network devices until it reached its destination. If you do a traceroute you see the ip addresses and response times of all devices (bridges, routers and gateways) between you and the server. While this is helpful for a network administrator to debug network issues, I found it interesting to see the flow of data. Even more so when it’s combined with geolocation software: With free tools like Open Visual Traceroute or web based versions like Online Visual Traceroute you can see the result visualised on a map. But since data packets only have a source and a destination ip, how is it possible to find out the route they take through a network? To understand how traceroute works I decided to create my own in JavaScript using Node.js.
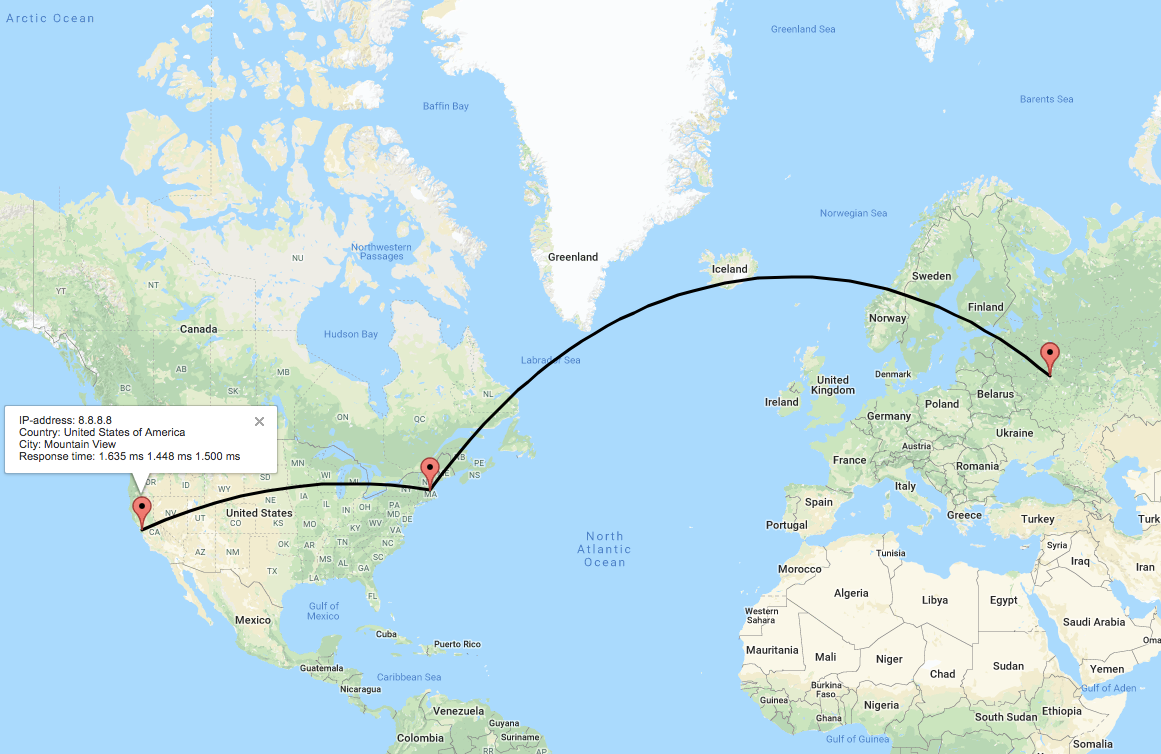
A visual traceroute from Russia to Google’s public dns server 8.8.8.8
What is traceroute exactly and how does it work?
Traceroute is a network utility that sends out a bunch of requests (probes) and collects the responses of all network devices in between. But how come those devices send a response to the sender? Under normal circumstances, a device receives an ip packet, figures out where it needs to go and forwards it. Before doing so it decrements the TTL (time-to-live)value of the ip packet. The TTL value doesn’t really specify a “time” to live, it’s more a “number of hops to live”. A hop is the part of a network path between one network device and another. So if you send a TCP packet with a TTL value of 3, the first network device on the path (let’s say that’s your router at home) will decrease the TTL value to 2 and pass the package on to your ISP. The first device on the ISP’s network will decrease it further to a value of 1 and forward the packet again. The next device in the chain will reduce it again by 1 and the TTL value is now 0. A packet with a TTL value of 0 won’t be passed on anymore. Instead, the device will discard the package. From a sender’s point of view the packet has been dumped somewhere along the way, with no clue of when and where this happened. Luckily most devices are kind enough to let the sender know that they discarded a packet. They send a response using the ICMP protocol with a message that says: “Time-to-live exceeded (Time to live exceeded in transit)”. The default TTL values set by the operating system are high enough to ensure that packets can reach their destination before they die. But if we explicitly set a low TTL value we can trigger a response from devices between us and the destination. This is exactly what traceroute does. It sends out packets with a TTL of 1, 2, 3 and so on until the destination is reached. Each time the packet is able to travel one hop further and every time it expires along the way, we get a response.
Let’s see it in action
Fire up a packet sniffer like Wireshark(and set the filter to “udp and ip.addr == 8.8.8.8") or open the console and start tcpdump by typing “sudo tcpdump -v ‘icmp or udp’”. Go to another window in your console and start a traceroute to Google’s public dns server, which has the ip address 8.8.8.8 by executing “traceroute 8.8.8.8”. You will see an output similar to this:
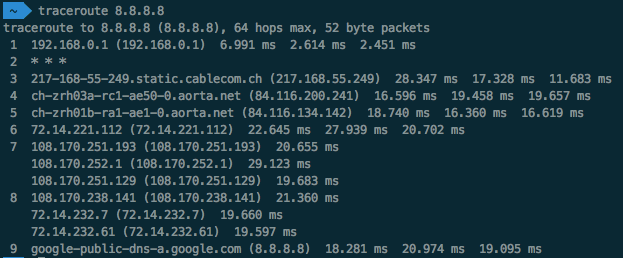
A traceroute to the server 8.8.8.8
The number on the very left is the hop, followed by the ip address of the device and 3 response times in milliseconds. The idea is that those 3 times give you an idea of the average time. So it takes 9 hops from my PC to reach the server 8.8.8.8. For hops 7 and 8 I got a response from a different ip address, every time I sent a package. Let’s check the captured output of Wireshark to see what happened behind the scenes:
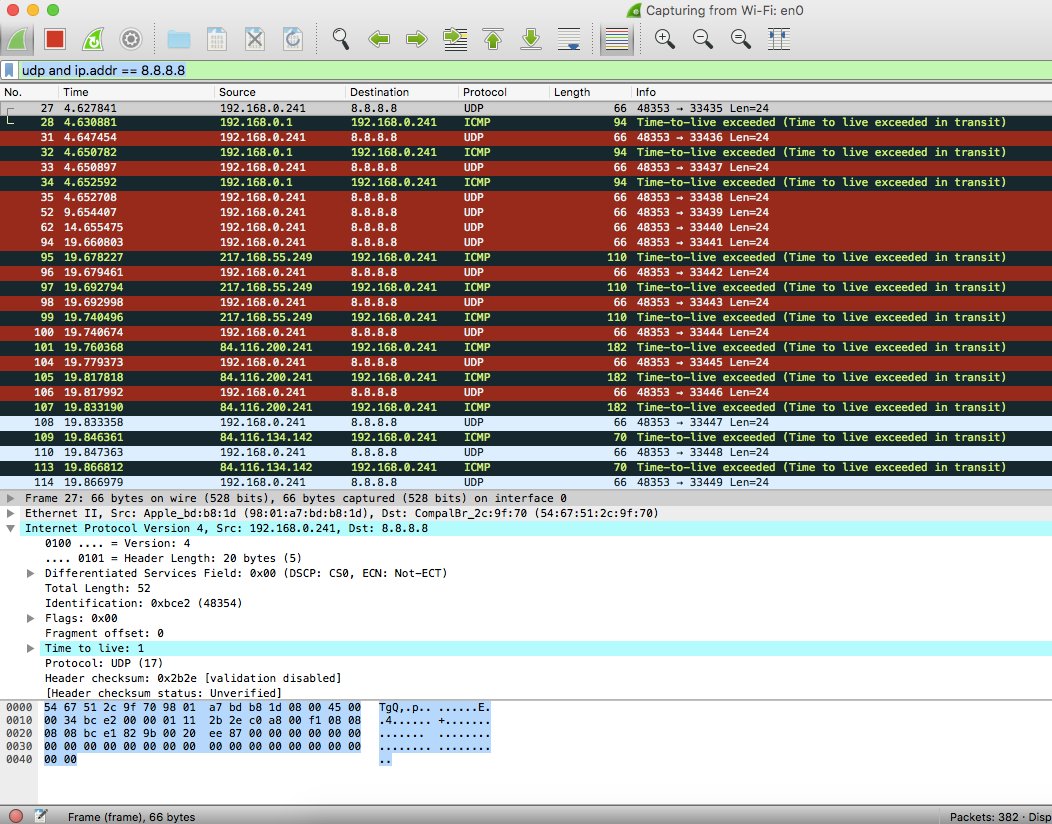
Wireshark capture of a traceroute to the server 8.8.8.8
We can see that three UDP packets have been sent to the destination 8.8.8.8. All of them have a TTL value of 1. Since they expired on the first hop, my router sent me three (one for each request) ICMP responses with the message “Time-to-live exceeded”. Then traceroute sent three probes with a TTL value of 2, but for these Wireshark never saw a response. Seems like my ISP is blocking ICMP responses on his gateway. A hop like this is called a black hole. Then traceroute sent UDP packets with a TTL of 3, 4, 5 and so on until it finally got an answer from the destination server (in our case the server with the ip 8.8.8.8). The server usually replies with an ICMP “Destination unreachable (Port unreachable)”. This is because the UDP packets are sent with a destination port number between 33434 and 33534, which is the reserved range for traceroute and not a valid port for an application. Pretty simple, but also very clever huh? Let’s see how we could build a tool like that in Node.js. What do we need?
We need to send UDP packets with a specified TTL.
We need to catch the ICMP responses and measure the elapsed time between request and response. We can use the destination port in the response to distinctively match it to a request and therefore increase the destination port for every request.
Traceroute can resolve a domain name to an ip address and also do a reverse dns lookup for ip addresses to get the symbolic name. So let’s also implement this.
Oh and let’s try to make everything with a maximum of 100 lines of code. Why? Because I’m sure we can!
A simple traceroute implementation in Node.js
First, let’s import some modules that we need. Dgram lets us send UDP packets and we use raw-socket to catch the ICMP responses. Dns-then is just a promise wrapper to the dns module that we use for dns lookup and reverse lookup.
Now we build a function that always sends out 3 packets, before increasing the TTL value and the port:
Next, we need to catch the ICMP responses, match the port number to the current request and do a reverse dns lookup if required.
The handleReply function called in the above snippet is in charge of formatting and logging the result. If the destination or the maximum number of hops is reached the program will exit. If not the sendPacket function is called again.
These are all the building blocks we need for the basic functionality of traceroute. Now we stick everything together and we are good to go. Check and download the complete source code.
Let’s run it and see what we get:
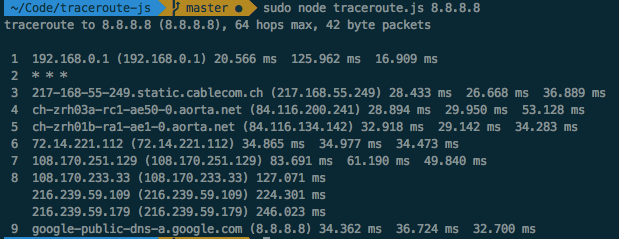
Output of our traceroute implementation
And let’s compare it to the native implementation:

Output of the built-in traceroute on OSX
As you can see the two traceroutes are very similar, but hops 7 and 8 are different. This is due to the fact that packets are being routed dynamically and don’t always take the same route, i.e. when you run the same traceroute twice you might get two different outputs.
Final Thoughts
This is only a very basic implementation to understand the core concept. The traceroute utility comes with a whole bunch of additional functionality like ASN lookup or support for different protocols. There are cases where firewalls block the UDP packets and you want to fall back to ECHO_PING for your requests. Play around with the code and implement additional features as you like. I hope you had fun and learned something.
Subscribe to my newsletter
Read articles from Frank directly inside your inbox. Subscribe to the newsletter, and don't miss out.
Written by
