Unlocking the Power of Grafana: Features, Usage, and Use Cases
 Rohit Deore
In the fast-paced world of DevOps, where speed and effectiveness are crucial, having tools for smooth monitoring and clear visualization is vital. Grafana, an impressive open-source platform for analytics and monitoring, has become a cornerstone for DevOps professionals. In this blog, we'll take a closer look at Grafana's features, how it's used in real-world DevOps scenarios, and the various situations where it proves incredibly useful.
Understanding Grafana
Features
1. Multi-Data Source Integration:
- Grafana supports a wide array of data sources, including popular DevOps tools like Prometheus, InfluxDB, Elasticsearch, and more. This flexibility allows for comprehensive monitoring of diverse components in the DevOps ecosystem.
2. Dynamic Dashboards:
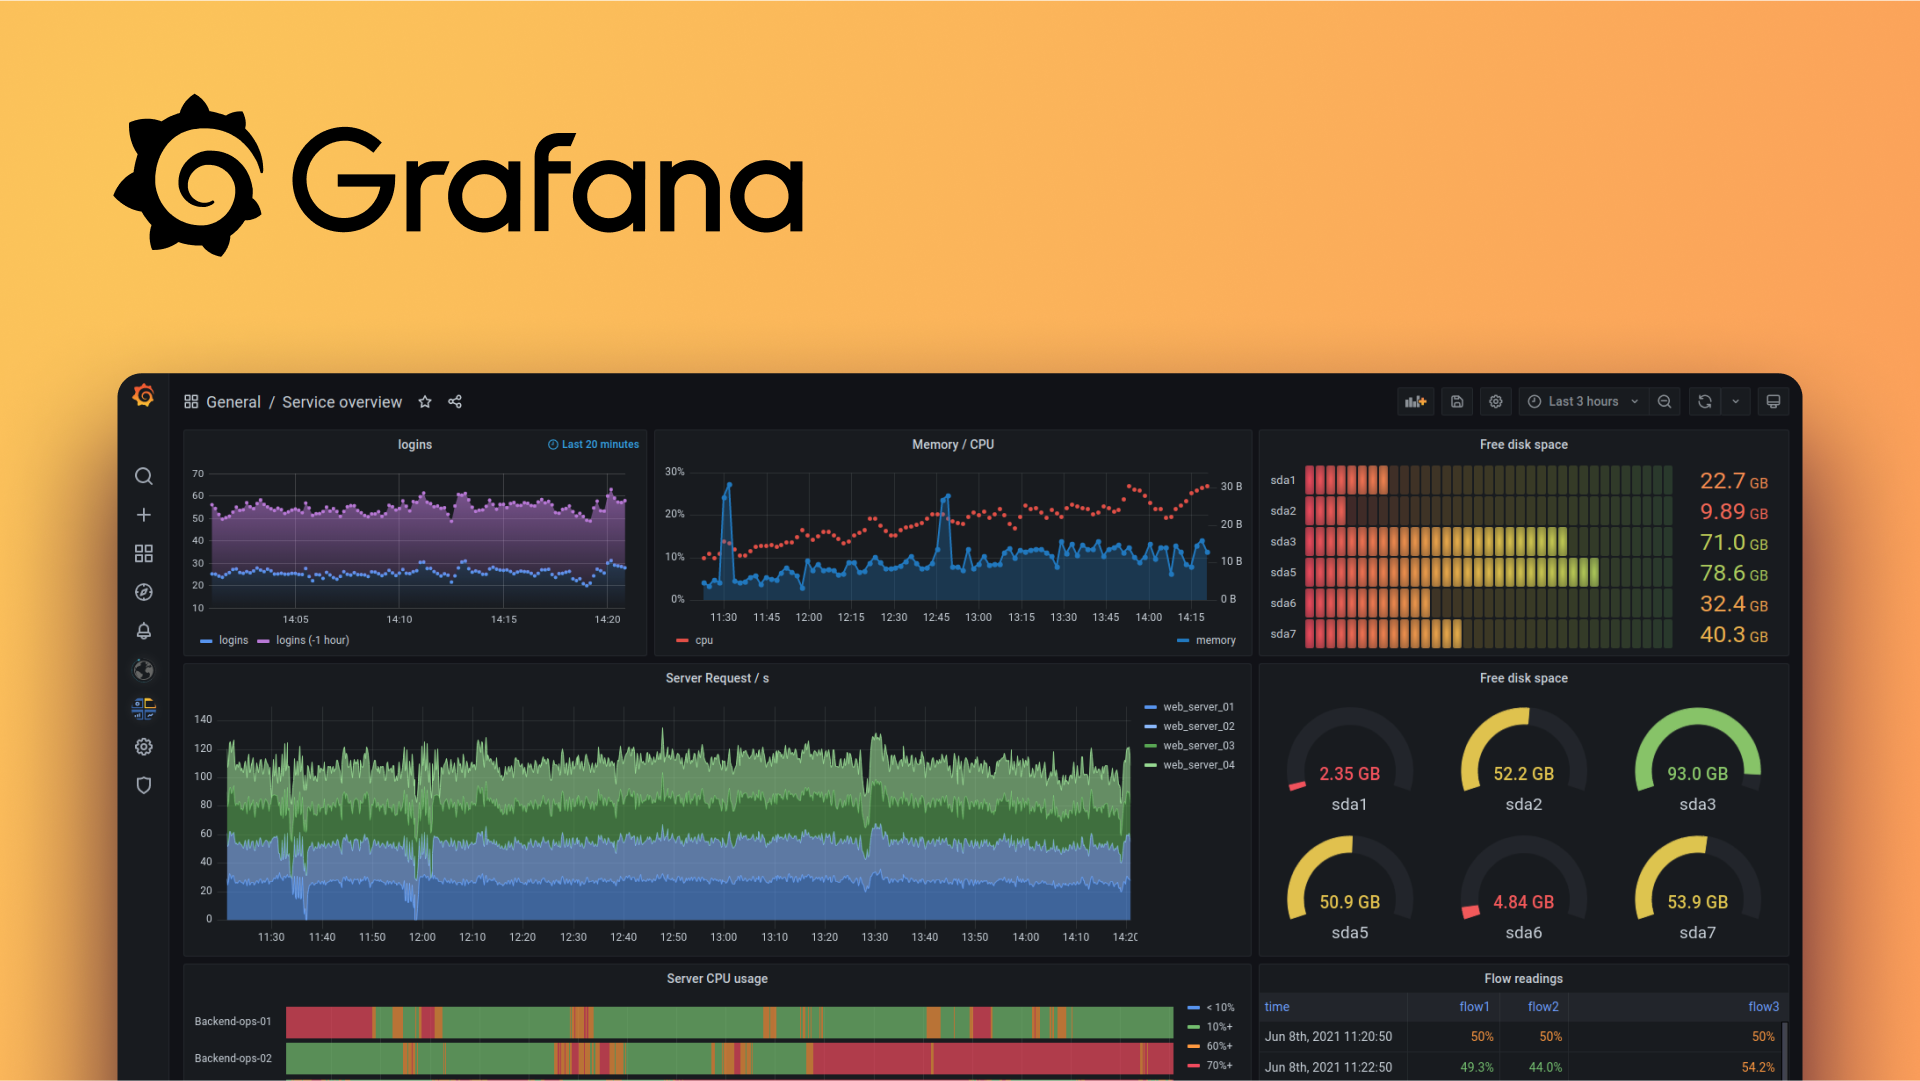
- DevOps teams can create highly customizable dashboards to monitor key performance indicators (KPIs), system health, and operational metrics. The drag-and-drop interface facilitates real-time visualization.
3. Alerting and Notification:
- Grafana excels in setting up alerts based on predefined thresholds. Notifications can be delivered via channels like email, Slack, or other messaging platforms, ensuring prompt responses to critical incidents.
4. Plugins and Extensibility:
- Grafana offers a wide range of add-ons that easily work with different DevOps tools. This flexibility lets you customize your monitoring setup to match exactly what your DevOps setup requires.
5. Annotations and Contextualization:
- In Grafana, teams can attach notes to graphs, giving extra details about deployments, code releases, or important events. This makes it easier to connect metrics with specific actions or incidents.
6. Templating for Dynamic Dashboards:
- Grafana allows for template variables, which means you can create dashboards that change dynamically. This is really helpful for easily switching between different views and contexts.
7. Role-Based Access Control (RBAC):
- Administrators can define granular access controls, ensuring that team members have appropriate permissions to view, edit, or manage dashboards and data sources.
Practical Usage
1. Continuous Integration/Continuous Deployment (CI/CD) Pipelines:
- Grafana helps teams keep an eye on their CI/CD pipelines in real-time. It tracks important numbers like how often builds succeed, how frequently deployments happen, and how long it takes for changes to go live. This information gives teams the power to spot problems and make their work processes smoother.
2. Infrastructure Monitoring:
- DevOps practitioners can use Grafana to monitor server performance, network latency, and resource utilization. By visualizing these metrics, teams can proactively address issues and ensure optimal system performance.
3. Container Orchestration:
- Grafana works smoothly with container management systems such as Kubernetes and Docker Swarm. This helps DevOps teams keep an eye on the health of containers, how resources are being used, and how well the cluster is performing.
4. Application Performance Monitoring (APM):
- When you connect APM tools like Prometheus or Jaeger to Grafana, it helps DevOps teams keep tabs on how the application is performing. This includes how fast it responds, how often errors happen, and how many resources it's using. This makes it easier to spot and fix any performance problems.
Use Cases
1. Automated Monitoring and Alerting:
- With Grafana, you can set up automatic alerts based on specific limits you define. This means that when something important happens, DevOps teams get instant notifications. This lets them quickly respond to urgent situations.
2. Capacity Planning and Scaling:
- By looking at past data, Grafana helps DevOps teams prepare for increased demands. This way, they can smartly decide how to allocate resources and make sure systems grow as needed to meet demand.
3. Incident Management and Root Cause Analysis:
- Grafana's visualization capabilities assist in incident management. DevOps teams can correlate metrics with specific incidents, facilitating faster root cause analysis and resolution.
4. Security Monitoring:
- With Grafana, DevOps teams can keep an eye on important security metrics. This includes things like alerts from intrusion detection systems (IDS), logs from firewalls, and records of authentication attempts. This helps to spot potential security risks and take action before they become a problem.
Thank You for Reading!
Thank you for taking the time to read my blog. I hope you found it informative and valuable. Your interest and engagement mean a lot to me.
If you have any questions, comments, or suggestions, please feel free to reach out. I would love to hear from my readers!
Keep Exploring...
Subscribe to my newsletter
Read articles from Rohit Deore directly inside your inbox. Subscribe to the newsletter, and don't miss out.
Written by

Rohit Deore
Rohit Deore
Student and Developer