Leveraging AI and External Data for Internal Clarity
 Khoa Lam
Ever feel like finding answers inside a big company is like piecing together a puzzle? Sometimes, you can't find the info you need, or there's an overload of conflicting data. And when it's time to share, there's always that looming worry about accidentally surfacing something confidential.
While it's tempting to dig into the "Why" (governance, internal process, etc.), I took a different approach here. As I began experimenting with ServiceNow's course catalog on Now Learning, my goal was simple: find information the way our customers do, by using what's available to everyone.
Step 1: Collect Data
I used Python to pull information from Now Learning, focusing on just the on-demand courses, and output it cleanly into a CSV.
Step 2: Brainstorm with ChatGPT
With this mountain of data (more than 70,000 words worth!), I had a conversation with ChatGPT. I asked it to dive in, analyze, and among other things, give me some tips on organizing and curating the content. If you're curious, here is the full conversation.
Step 3: Make It Visual
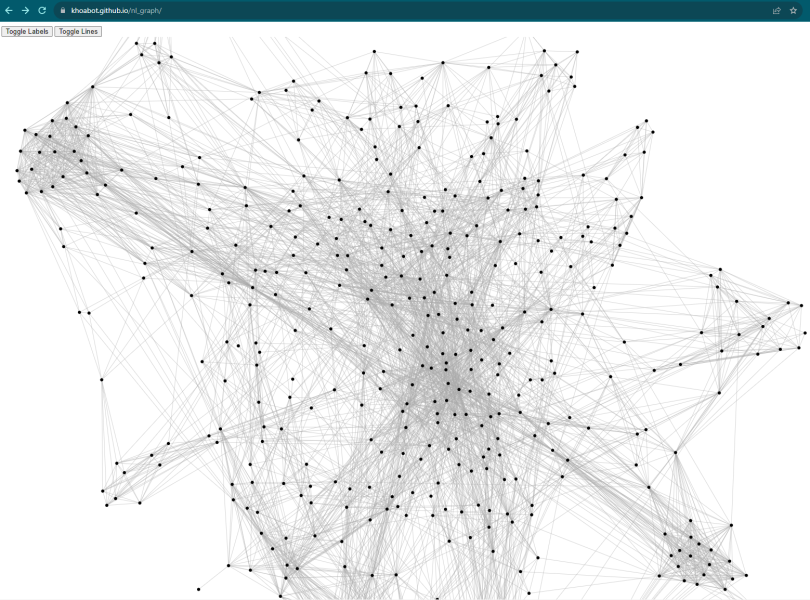
While raw data offers valuable insights, I prefer visual representation whenever possible. Turning the data set into a knowledge graph (which ChatGPT even provides JSON for) might help unearth nuanced insights and detect patterns that might be less apparent in a purely textual format.
Final Thoughts
Here are some ways I believe our team can gain clarity through this approach:
Spotting the Missing Pieces: Visuals can efficiently highlight gaps. Where is our content lacking? Where might there be redundancy? Do certain aspects appear misaligned? Perhaps we need to refine our taxonomy?
Strategic Planning: Visual indicators of content-rich areas guide decisions about essential updates and resource allocation. Imagine the insights we could gain by overlaying this external-facing graph with an internal one.
Enhancing User Experience: Visual tools serve as guides and can even predict user needs by suggesting relevant courses. Behind the scenes, a comprehensive knowledge graph can enable highly personalized and effective recommendations in any context.
Transparent Communication: For those not deeply involved in daily content operations, visual representations offer a clear and simplified overview of complex datasets.
Mapping the Learning Journey: Visual structures suggest logical course sequences, ensuring learners progress from foundational concepts to more advanced topics - akin to assembling a jigsaw puzzle piece by piece.
I'll do my part to continue the dialogue on applying AI to refine our learning and knowledge strategy and, more importantly, enhance the customer experience.
This entire process, augmented at every stage by ChatGPT, took merely a handful of hours. While I do have technical skills, the efficiency gains for technical troubleshooting and researching/applying different approaches were remarkable.
This is a duplicate post from my LinkedIn article.
Subscribe to my newsletter
Read articles from Khoa Lam directly inside your inbox. Subscribe to the newsletter, and don't miss out.
Written by

Khoa Lam
Khoa Lam
Inspiration chasing technologist. Craftsman of clarity. Advocate for style points.


