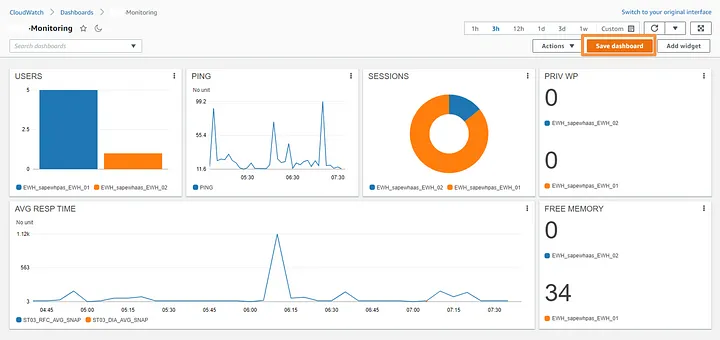
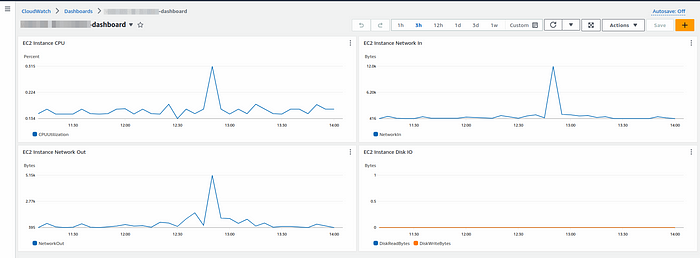
Cloud Watch dashboard for monitoring EC2 instance using Terragrunt.
 Mahira Technology Private Limited

OverView :-
#CloudWatch dashboards provide a centralized and customizable view of your #EC2 metrics, such as CPU utilization, network traffic, disk I/O, and more. By creating a dedicated dashboard, you can monitor the health and performance of your EC2 instances at a glance, enabling you to make informed decisions and take proactive actions to optimize resource utilization and maintain application stability.
Pre-Requestisites:-
An AWS account with appropriate permissions to create CloudWatch dashboards.
#Terraform & #Terragrunt installed on your local machine.
#AWS credentials properly configured.
Step 1:- Open an virtual editor (vs code) for developing the code.
Step 2:- For creating cloud watch dashboard using terragrunt, Create a directory named cloud-watch-dashboard in your home directory. In that cloud-watch-dashboard directory create a one-more folder with name (module)and create two files called main.tf and variable.tf in the module Folder.
step 3:- Open the main.tf file and paste the below code to create a cloud watch dashboard.
resource "aws_cloudwatch_dashboard" "main" {
  dashboard_name = var.dashboard_name
  dashboard_body = <<EOF
  {
    "widgets" : [
      {
        "type": "metric",
        "x": 0,
        "y": 0,
        "width": 12,
        "height": 6,
        "properties": {
          "metrics": [
            ["AWS/EC2",
            "CPUUtilization",
            "InstanceId",
            "${var.instance_id}"
            ]
          ],
          "period": 300,
          "stat": "Average",
          "region": "${var.region}",
          "title": "EC2 Instance CPU"
        }
      },
      {
        "type": "metric",
        "x": 0,
        "y": 10,
        "width": 12,
        "height": 6,
        "properties": {
          "metrics": [
            ["AWS/EC2", "NetworkIn",
            "InstanceId",
            "${var.instance_id}"
            ]
          ],
          "period": 300,
          "stat": "Average",
          "region": "${var.region}",
          "title": "EC2 Instance Network In"
        }
      },
      {
        "type": "metric",
        "x": 0,
        "y": 16,
        "width": 12,
        "height": 6,
        "properties": {
          "metrics": [
            ["AWS/EC2",
            "NetworkOut",
            "InstanceId",
            "${var.instance_id}"
            ]
          ],
          "period": 300,
          "stat": "Average",
          "region": "${var.region}",
          "title": "EC2 Instance Network Out"
        }
      },
      {
        "type": "metric",
        "x": 0,
        "y": 22,
        "width": 12,
        "height": 6,
        "properties": {
          "metrics": [
            ["AWS/EC2",
            "DiskReadBytes",
            "InstanceId",
            "${var.instance_id}"],
            ["AWS/EC2",
            "DiskWriteBytes",
            "InstanceId",
            "${var.instance_id}"
            ]
          ],
          "period": 300,
          "stat": "Average",
          "region": "${var.region}",
          "title": "EC2 Instance Disk IO"
        }
      }
    ]
  }
EOF
}
step 4: Define variables in variable.tf file for the above main.tf file.
variable "instance_id" {
    type = string
    description = "Id of the instance"
}
variable "dashboard_name" {
    type = string
    description = "Name of the Dashboard"
}
variable "region" {
   type = string
   description = "default region"
}
Step 5:- After setting up all those things in the module folder. create one folder named cloud-watch in the cloud-watch-dashboard directory, within that cloud-watch folder create a file called terragrunt.hcl
Step 6 :- Here, we are defining the variable values and deploying our code using terragrunt. u can use the below code to create the dashboard using terragrunt.
terraform {
  source = "../Dashboard"
}
include "root" {
  path = find_in_parent_folders()
}
locals {
  instance_id = "i-jjb8967799756njbd"
  region = "us-east-1"
}
inputs = {
  dashboard_name = "ec2-cloud_watch-dashboard"
  instance_id    = local.instance_id
  region         = local.region
 }
Step-7 :- After completed all those file setup.Open the terminal.
Step-8:- Locate to your cloud-watch folder which is being created in your module directory.(as shown in the below picture)

Step-9 :- In that location only you need to perform the command terragrunt init.
Step-10: After completion of the initialization. Next need to perform terragrunt plan.After successfully planed. Next need to perform terragrunt apply.
Step 11:- once it is applied. Login to your #AWS console.
Step 12: In your #AWS management console, Search for cloud watch service.
Step 13:- you can see the cloudwatch dashboard has been created.

Source-code link :- “https://github.com/MahiraTechnology/Mahira-medium.git***”***
Conclusion :-
CloudWatch dashboards provide a centralized view of your #AWS resources, allowing you to #monitor performance, #troubleshoot issues, and make informed decisions based on #real-time data. With #Terraform, you can define and manage your dashboards as code, enabling repeatability, #version control, and easy collaboration within your #infrastructure-as-code workflow.
Subscribe to my newsletter
Read articles from Mahira Technology Private Limited directly inside your inbox. Subscribe to the newsletter, and don't miss out.
Written by

Mahira Technology Private Limited
Mahira Technology Private Limited
A leading tech consulting firm specializing in innovative solutions. Experts in cloud, DevOps, automation, data analytics & more. Trusted technology partner.