Empowering User-Specific Dashboard Access: Creating User Groups and Tailored Views in Grafana
 Mahira Technology Private Limited
Introduction : -
Grafana is an open-source data visualization and monitoring platform that allows you to query, visualize, and alert on time-series data. It supports various data sources such as Graphite, Prometheus, InfluxDB, Elasticsearch, and more. Grafana provides a user-friendly interface that allows you to create and share dashboards, set up alerts, and build custom plugins.
Step 1) Installing grafana :-
Go to Grafana's official website and install Grafana on Ubuntu
sudo apt-get install -y adduser libfontconfig1
wget https://dl.grafana.com/enterprise/release/grafana-enterprise_9.4.7_amd64.deb
sudo dpkg -i grafana-enterprise_9.4.7_amd64.deb
after downloading and unpacking the Grafana
NOTE: starting on installation, please execute the following statements to configure Grafana to start automatically using the system.
sudo /bin/systemctl daemon-reload
sudo /bin/systemctl enable grafana-server
sudo /bin/systemctl start grafana-server
we can check if Grafana is properly installed or not using this command
sudo service grafana-server status
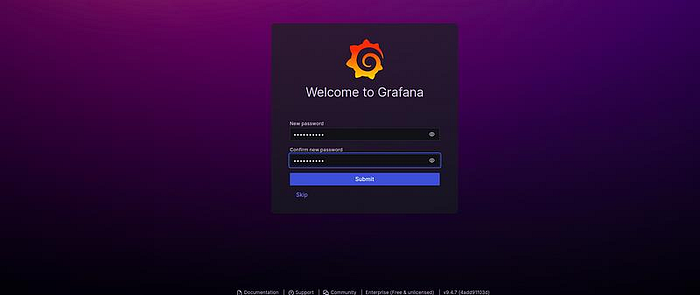
By default, Grafana will be listening on http://localhost:3000. The default login is “admin” / “admin”.
Step 2: Add users : -
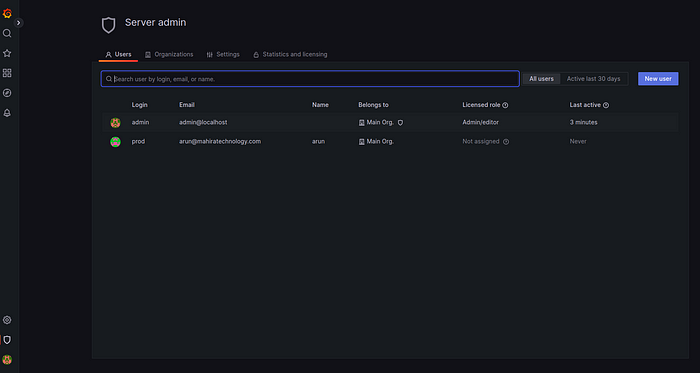
Repeat the following steps for each of the employees in the table to create the new user accounts:
Log in as a user that has the Server Admin role.
On the sidebar, click the Server Admin (shield) icon.
Choose Users from the menu drop-down, then click New User.
Enter the Name, Email, Username, and Password
Click the Create User button to create the account.
When you create a user they are granted the Viewer role by default, which means that they won’t be able to make any changes to any of the resources in Grafana. That’s ok for now, you’ll grant more user permissions by adding users to teams in the next step.
Step 3: Create a team: -
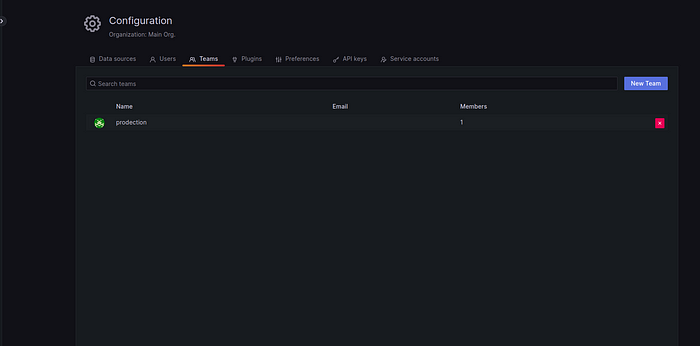
Create the teams.
In the sidebar, hover your mouse over the Configuration (gear) icon and click Teams.
Click New Team.
In Name, enter the name of the team: either a name. You do not need to enter an email(its not mandatory)
Click Create.
Click on the Teams link at the top of the page to return to the Teams page and create a second team if needed
Step 4: Add a user to a team:-
Repeat these steps for each user to assign them to their team. Refer to the table above for team assignments.
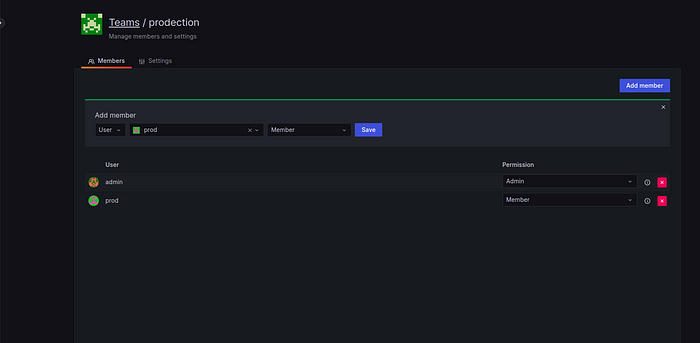
Click the team name and add members to that team.
Click Add Member.
In the Add Team member box, click the drop-down arrow to choose the user you want to add to the team.
Click Add to Team.
When you’re done, you’ll have teams with users assigned to each you created.
step 5: Add a folder for the team:-
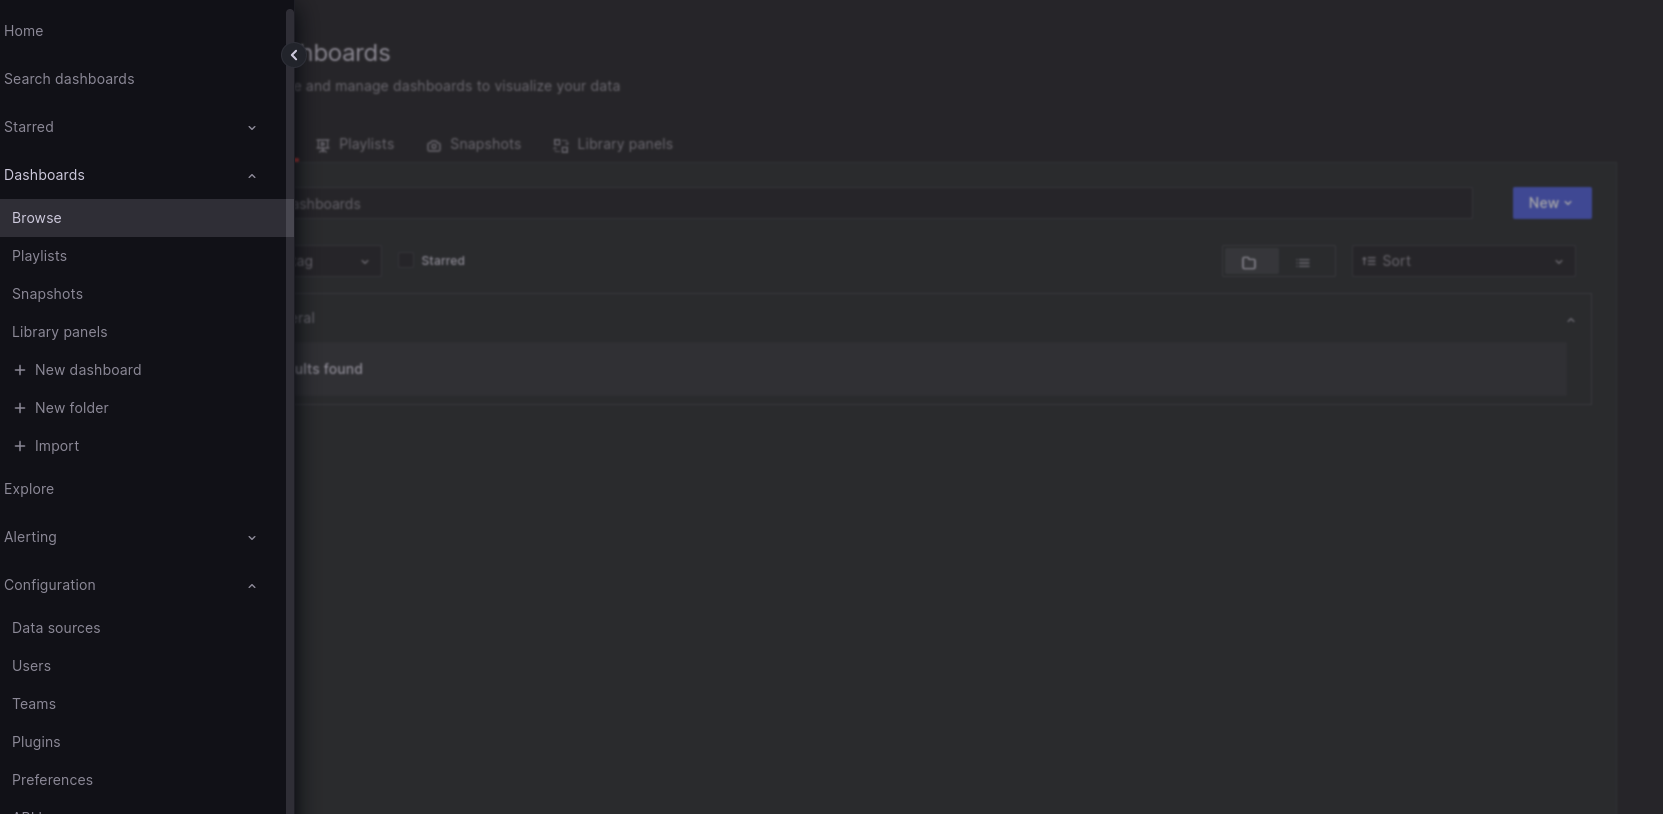
In the sidebar, over the Dashboards (four squares) icon and then click Browse.
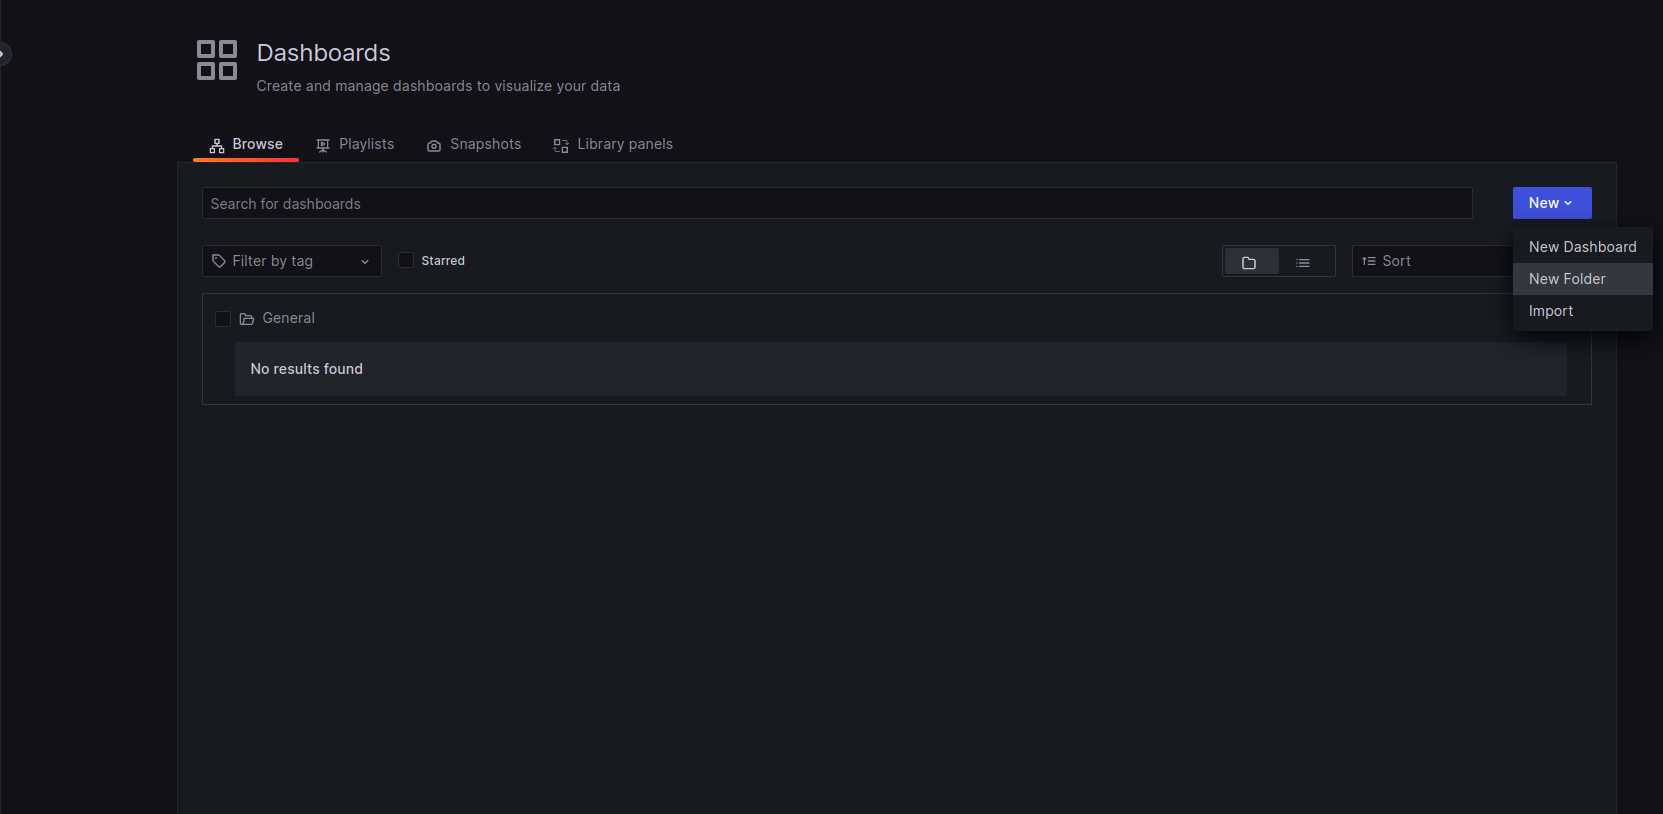
To create a folder, click New Folder.
In Name, enter the folder name.
Click Create.
Stay in the folder view and move on to the next sections to edit permissions for this folder.
NOTE: By default, when you create a folder, all users with the Viewer role are granted permission to view the folder. need to remove the Viewer role from the list of permissions
Step 6: Grant folder permissions to a team:-
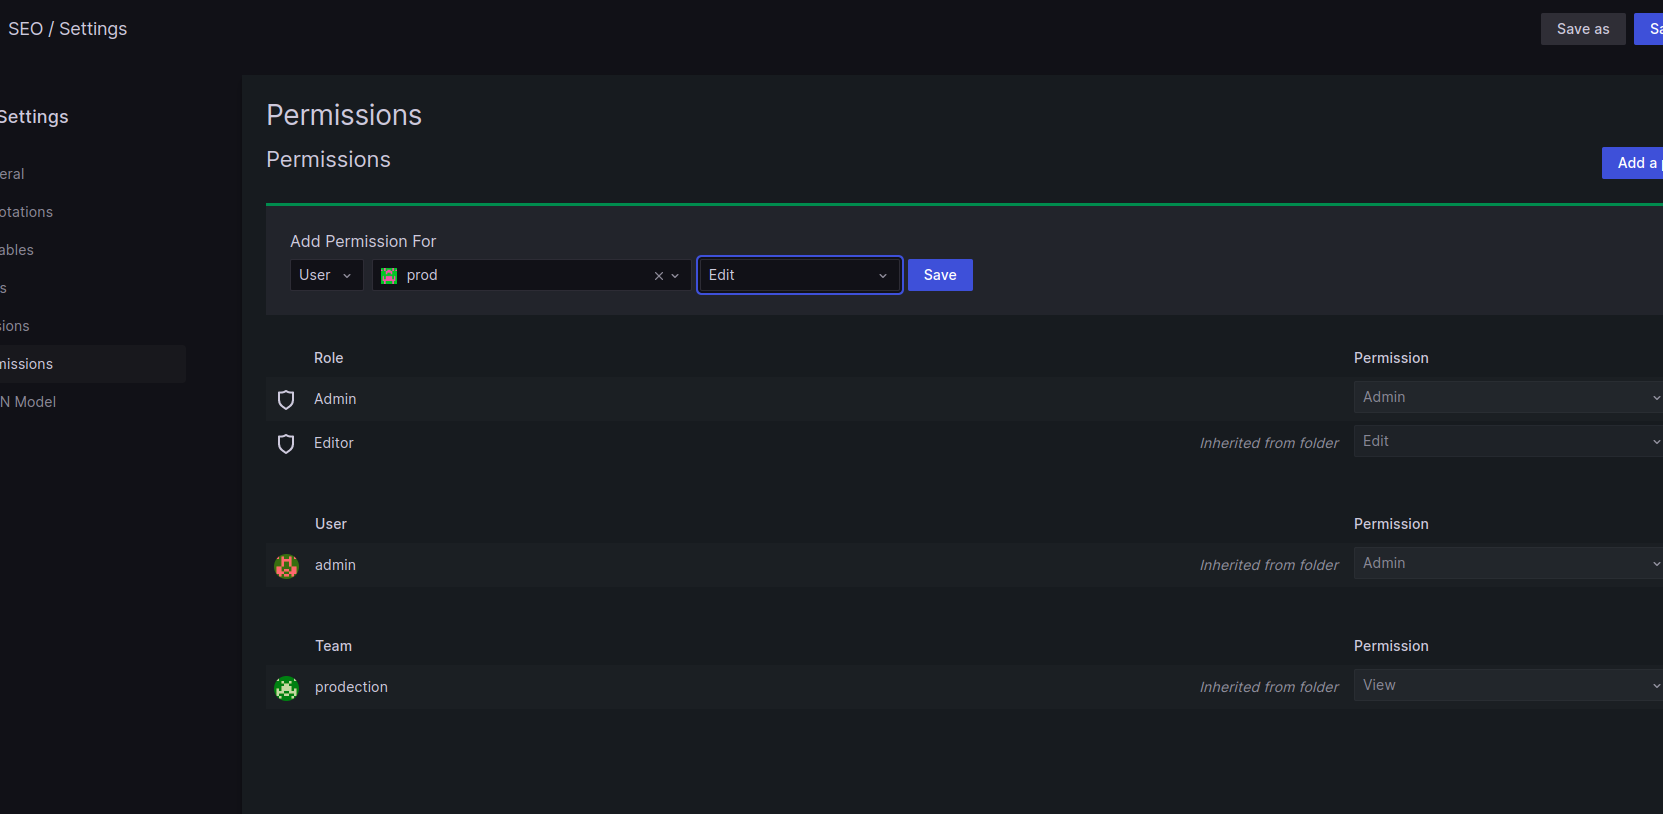
Click Add Permission.
In the Add Permission For dialog, make sure “Team” is selected in the first box.
In the second box, select the team to grant access to.
In the third box, select the access you want to grant.
Click Save.
Repeat for the other team.
Step 7: Create a dashboard:-
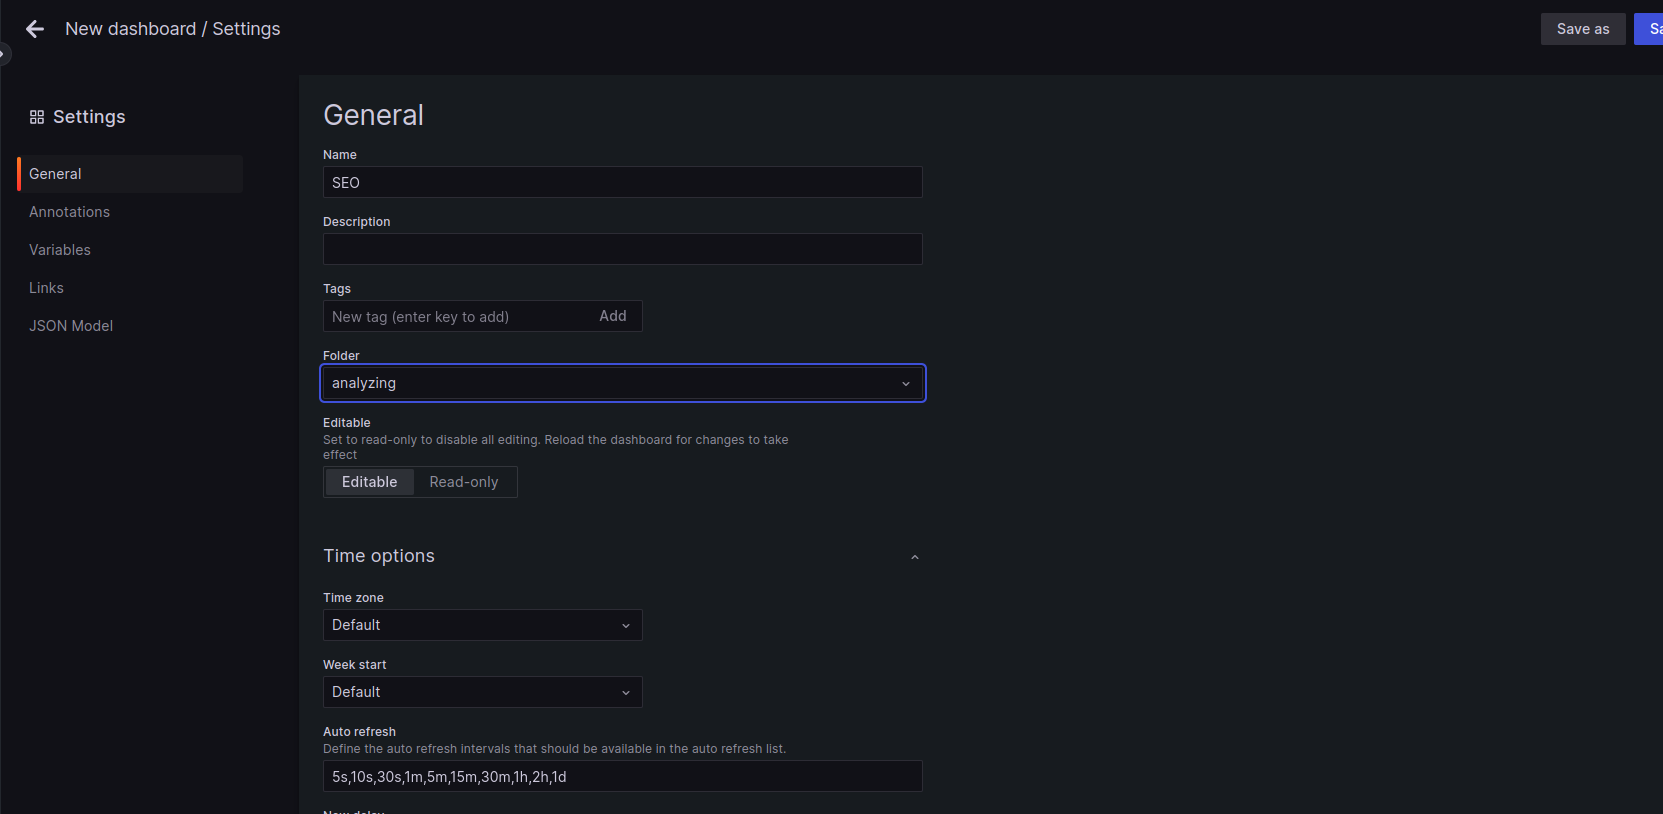
In the sidebar, click the Create (plus) icon to create a new dashboard.
In the top right corner, click the cog icon to go to Dashboard settings.
In Name, enter a name.
Click Save Dashboard.
In the Save dashboard as… pop-up, choose the Analytics folder from the drop-down and click Save.
Step 8: Grant a user permission to view the dashboard :-
In the top right corner of your dashboard, click the cog icon to go to Dashboard settings.
Go to the Permissions tab, and click Add Permission.
In the Add Permission For dialog, select User in the first box.
In the second box, select the user to grant access to prod.
In the third box, select View.
Click Save.
Click Save dashboard.
Add a note about giving prod Viewer permission for the dashboard and then click Save.
You’ve created a new user and given them unique permissions to view a single dashboard within a folder.
Step 9: verifying our work:-
You can repeat these steps to log in as the other users you’ve created see the differences in the viewer and editor roles.
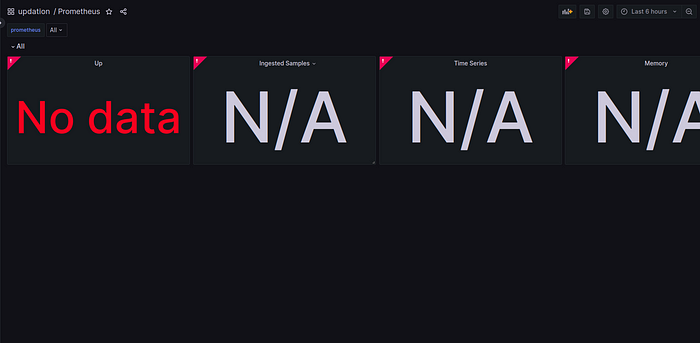
For example, you can log in as the user prod to see that they can only access the analyzing/SEO dashboard.
Click the profile in the bottom left corner, and choose Sign Out.
Enter prod as the username.
Enter the password you created for prod.
Click Log in.
In the sidebar, hover your cursor over the Dashboards icon and then click Browse.
Click on the list icon to see the dashboard list.
Click on the SEO dashboard, there shouldn’t be any editing permissions since we assigned prod for the viewer role.
Conclusion :-
Configuring user groups and assigning specific dashboard views in Grafana provides a streamlined and efficient approach to manage user access and permissions within the Grafana platform. By following the steps outlined in this guide, you have learned how to leverage Grafana’s user management capabilities and Terraform to automate the creation of user groups and assign specific dashboard views to individual users.
Subscribe to my newsletter
Read articles from Mahira Technology Private Limited directly inside your inbox. Subscribe to the newsletter, and don't miss out.
Written by

Mahira Technology Private Limited
Mahira Technology Private Limited
A leading tech consulting firm specializing in innovative solutions. Experts in cloud, DevOps, automation, data analytics & more. Trusted technology partner.