What is Price Action Trading? — A unique Language of the Markets
 Nataraj Malavade
Is it possible to trade the markets profitably without using any indicators but just the price action analysis?
Have you ever wondered how a trader can make better decisions just by looking at the price charts alone?
Well, if you are looking for the answers to the above questions, then you are reading the right blog.
My name is Nataraj Malavade. I am a Full-time trader and Author of Mastermind of Day Trading. I use price action analysis and market profile concepts extensively in my trading, especially to read the context of the market and to generate the buy and sell triggers.
Price Action is the vast subject to discuss; however, through this article, I will attempt to convey the fundamental yet significant aspects of price action trading. At the end of this blog, you will get answers to the questions like What does price action mean in trading? What is a price action trading strategy? What is price action theory? Why is price action important?
Meantime, if you haven't read my blog on the market profile, you can have a look at it as well and subscribe to my YouTube channel to watch many educational videos about trading.
Well, let's begin…
The fundamentals…
Just think about it,
If we can logically identify what the markets are doing currently rather than predicting what the markets are going to do in future, 70% of the job is done. We don’t need to predict the future of the markets. Although the market moves randomly, it has an underlying structure with which it moves. Once we identify the underlying structure of markets, suddenly, trading does not seem that tough. This is where ‘PRICE ACTION TRADING’ can be of great help.
Understanding the basics is very important before we study the advanced concepts, and Dow Theory is one of the fundamental aspects of price action.
Dow Theory — It is an old school concept that has been around for almost 100+ years. Yet, even in today’s volatile and technology-driven markets, the components of Dow Theory remain valid.
According to Charles Dow, who developed the Dow Theory, all the market information — past, present, and future are discounted and reflected on the price behaviour.
At the surface level, this theory describes market trends and how they typically behave. At a macro level, it provides signs that can be used to identify patterns and subsequently trade with the primary market trends—the theory centres around identifying the current trend.
Dow theory can be interpreted in many ways. However, I will explain the most simple version of the same. As per Dow, Market moves in waves by forming trends, and the market movements can be divided into two types, and at any time, the price is a combination of them. And they are,
Trending Market:
Have you heard “TREND IS YOUR FRIEND UNTIL IT BEND?”
The market moves in a rhythm like music when it is forming trends irrespective of its direction. You can sense the kind of urgency in a tempo behind every swing or bar when it’s trending. If a trader can identify this initially, he can align this to his system and get the benefit from market trends.
For example, the charts are filled with bullish bars in a strong uptrend with tiny retracement swings or the bars. Similarly, they are filled with bearish bars or the swings in a downtrend. Refer to below figure 1.1 to understand how the price moves in the trending market.
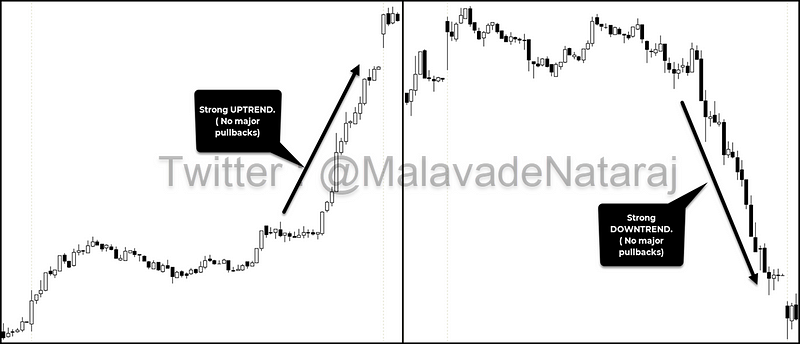
Image 1.1 — Trending Markets
Sideways Market:
Did you ever get stuck in the sideways movements of the market and lost all the money that you earned in a trending market? Sideways markets are like a rollercoaster ride for traders, and it’s part and parcel of technical analysis. Including this in our trade plan while developing strategies will help us in maintaining a positive edge.
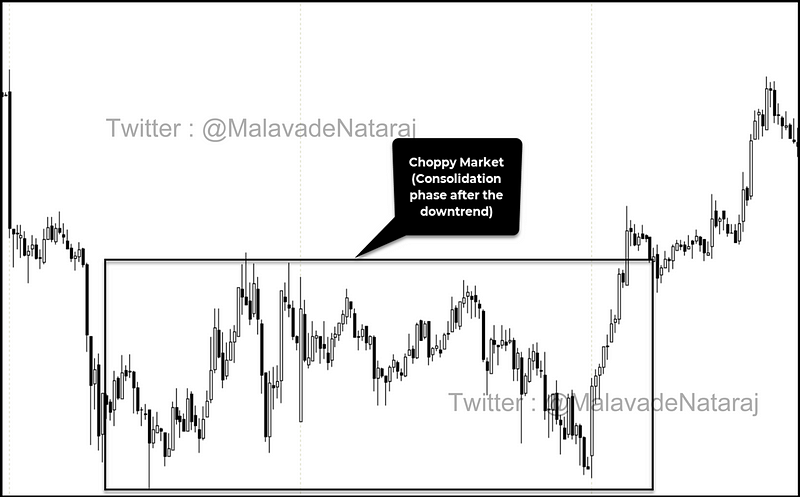
1.2 — Sideways Market
The trend is a breakout phase. In contrast, the sideways movement is a consolidation phase. As a tendency, the market is switching between the trend and the sideways. It’s similar to mountain climbing where you climb to a point after which you rest and boost your energy. You rest for a while, and then you continue climbing if you have the strength. Otherwise, you will return to downhill. The market works the same way. Refer to figure 1.2 to see how the market behaves when it is ranging.
Price Action Swings?
The market moves in a trend. What does it mean?
Well,
If you look closely at the price chart, the market moves in a zig-zag pattern. The price behaviour always looks very mystical to our naked eyes. Identification of price swings can unveil the mystery behind the randomness of the price.
Let's understand what they are,
Swing highs and lows are price levels that stand out as peak points surrounded by a pullback for the market’s previous movement. For example, in an uptrend, the price level will reach a point where it attracts more selling, and buyers fail to push the price higher. The peak formed becomes an area of support and resistance. In simple words, the exhaustion of buyers and the domination of sellers create a swing high. Similarly, exhaustion of sellers and dominance of buyers leaves the marks of swing lows.
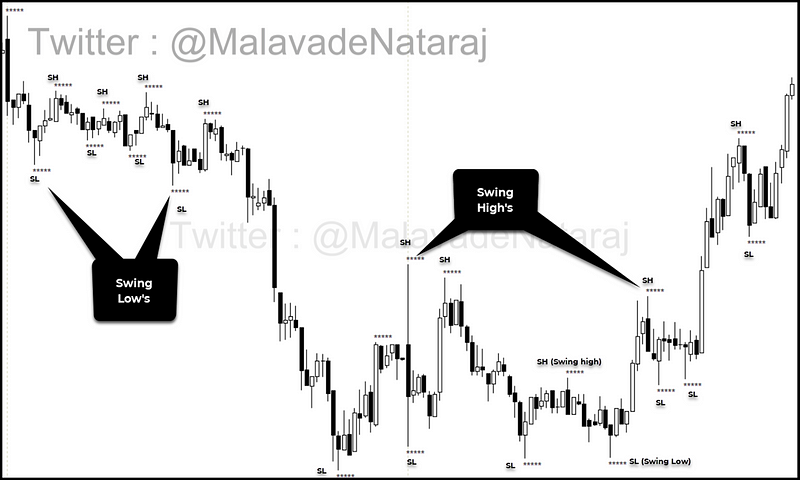
1.3 — Swing High and Lows
Figure 1.3 shows a series of candlesticks in a 5min chart, where I have marked the swing highs and lows. If you observe, you can see that the market is progressing with higher and lower swing points, with a hidden pattern that reveals the possible direction of the market.
Uptrend:
If the market is moving upwards with good magnitude and least pullbacks, then we can call it an uptrend. Uptrend implies that the buyers are dominant and taking the price higher.
If you are looking for a way to identify this trend by just looking at the price chart, defining the behaviour of swings is the answer.
The two crucial behaviours of price actions during an uptrend are,
- Market Makes a higher high and higher low pattern in swings.
- Greater magnitude is observed in bullish swings compared to the bearish swings.
Refer the below figure 1.4 to see how the price behaves when it's moving in an uptrend.
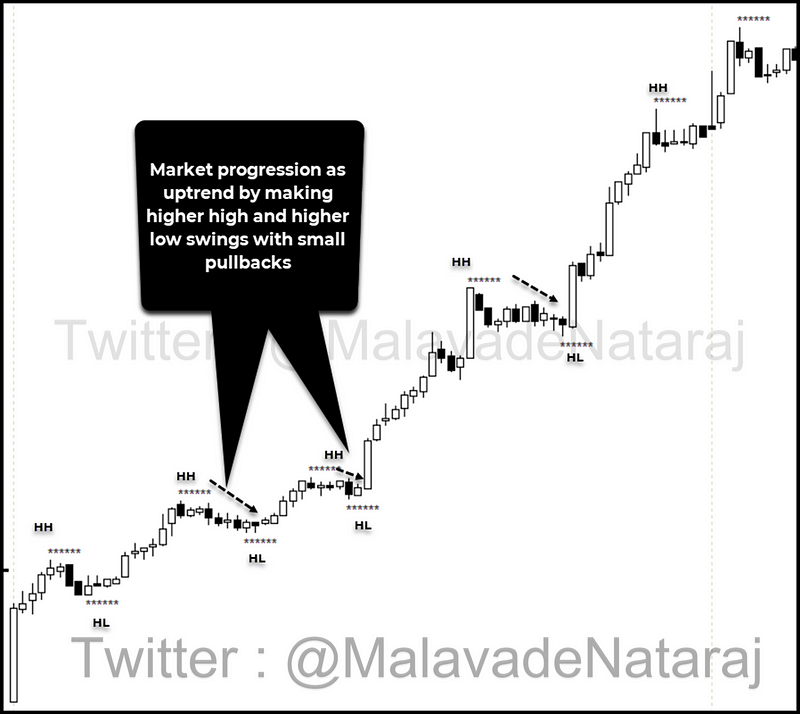
1.4 — Uptrend — Market making Higher high and higher low pattern
Downtrend:
Similar to the uptrend market, the downtrend market also has its own rhythm. When the markets trend down, the sellers dominate the market and absorb the buying attempts. This is caused by aggressive downmove by the bears.
The crucial behaviours of price action during downtrend are,
- Market Makes a lower low and lower high pattern in swings.
- Greater magnitude is observed in bearish swings compared to bullish swings.
Refer the below figure 1.5 to see how the price behaves when it’s moving in an uptrend.
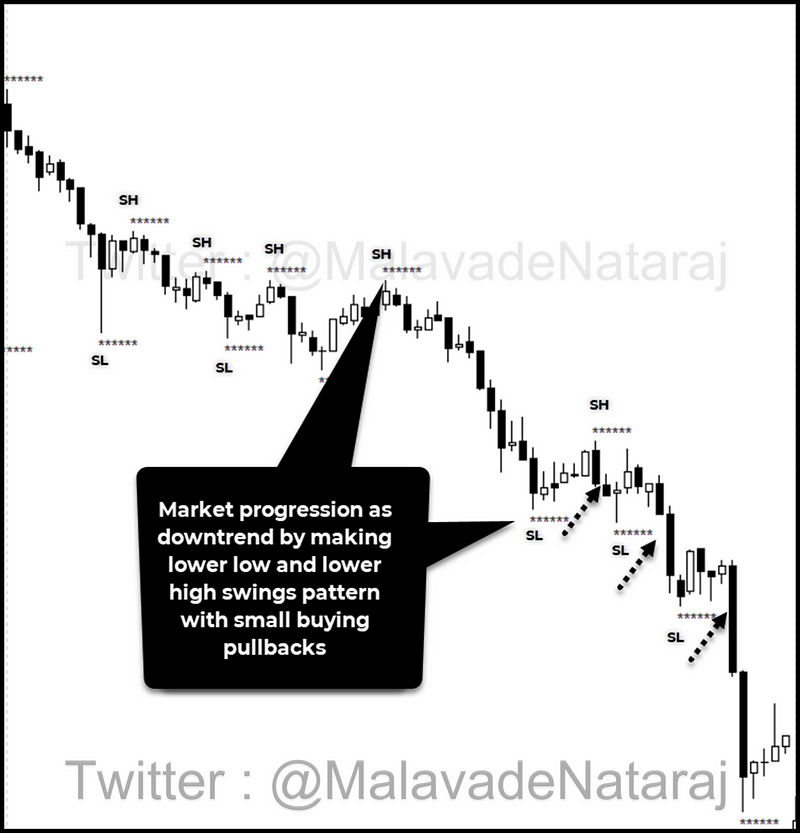
1.5 — Downtrend — Market making Lower low and lower high pattern
Sideways trend:
Most often, the market tends to pause the momentum and take rest! This behaviour of the market leads to consolidation or sideways movements. Sideways price action is part and parcel of market dynamics. Compared to trending days, around 50–60% of the time, the market moves sideways.
Similar to the trending behaviour of price action, the sideways market also has its characteristics, and they are,
- Equal magnitude in both up and downswings.
- Presence of sudden volatile retracement on the opposite side of the trend.
Once you notice the above behaviour forming in the chart, you can think of possible, sideways actions in the near term. Refer figure 1.6 to understand the sideways price action.
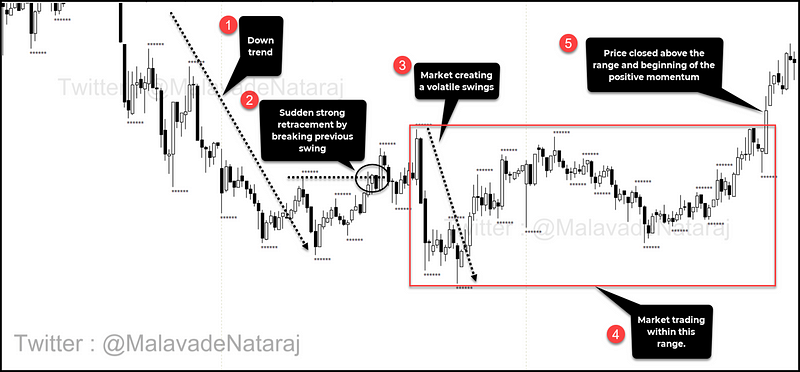
1.6 — Sideways Price Action
Trend Reversal:
Now it’s time to understand the change of momentum or possible shift of the preceding trend. Essential information at the moment is that “the end of a trend is the beginning of a new trend.” Adapting early to these changes will increase the chances of riding an evolving trend.
Broadly there are two phases in the market,
- Trending phase
- Consolidation phase.
The trending phase is where the market makes a significant move in the direction of the trend. Similarly, the market takes a momentary rest by making a consolidation movement and then shifts to a trending mode again.
Critical information thrown by swing behaviour can help in identifying the trend reversal.
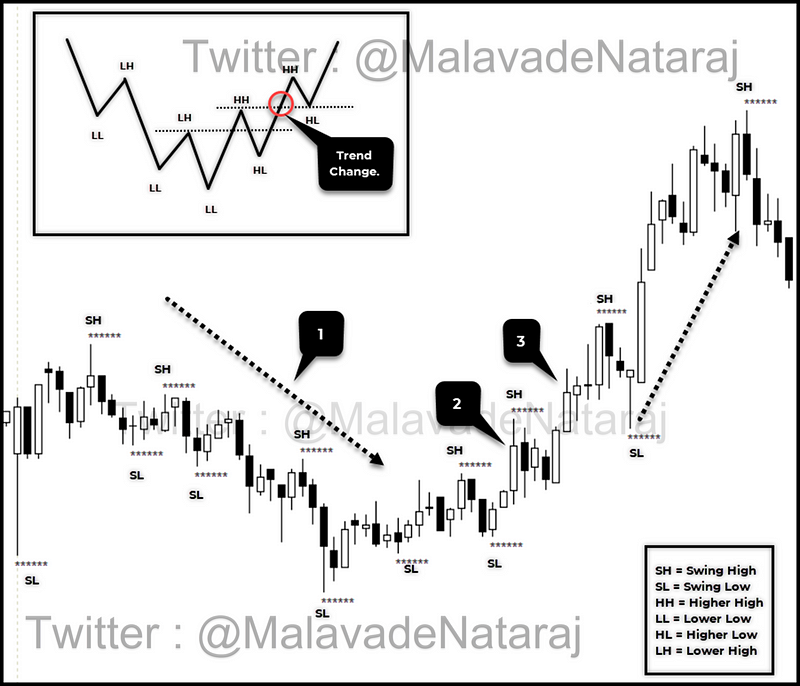
1.7 — Trend reversal from downtrend to an uptrend
Above figure 1.7 shows how downtrend reverses its momentum. There are three steps involved here. The first number indicates the market is moving in a downtrend by making lower low and lower high formations. Later in step two, the candle breaks or trades above the last lower high swing. This pattern is the first sign that the market is about to change its phase, and we can consider this swing high as the higher high swing as it is above the last lower high swing. Now the third step is where the candle breaks or trades above the higher high swing. And this is when the market confirms its readiness to begin its momentum in an upward direction.
The same concept is reversed when the market changes its trend during an uptrend.
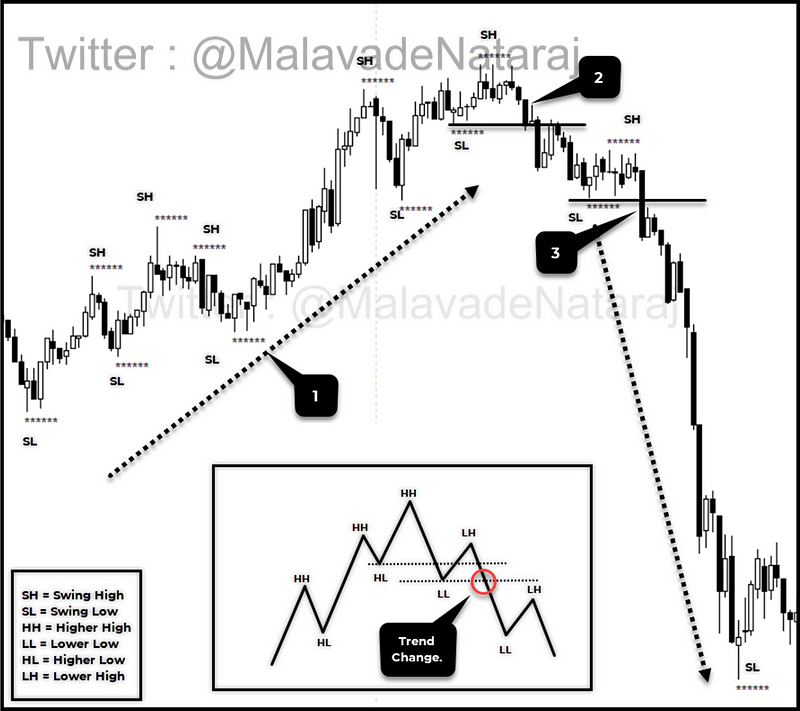
1.8 — Trend reversing from an uptrend to downtrend
Step one in figure 1.8 shows that the market is trending in an upward direction. And then in the second step, the candle breaks the last higher low swing. As mentioned in the previous discussion, in this step, the market leaves a hint that it is changing momentum. However, this will be confirmed when price breaks lower low swing.
Summary:
Once we identify the present trend of the market, the next step is to align with it. Suppose assume that you identified the existing trend as an uptrend; you look for buying opportunities. On the other hand, you will look for shorting opportunities if the trend is negative. Can you avoid the whipsaws? 100% NO. There will be whipsaws in the process, but the idea is to maintain the edge throughout the series of trades by wining BIG and losing SMALL.
Well,
All the above information give you a fair idea about how price behaves, and one can build many systems using such information. As I mentioned in the beginning, the price action trading concepts are huge in concepts. Definitely, a single blog like this cannot cover most of the aspects.
If you are interested to learn more about Price Action Trading and strategies, I recommend you read my Book on Day Trading “Mastermind of Day Trading” (http://amzn.to/3mDBaFK) Which is now available in Amazon Kindle and also the paper version will be released soon.
I hope this blog helped you in understanding the Price Action Trading. If you liked the article, kindly share this with your trading friends and hit the clap button.
Happy Trading 😎
Nataraj Malavade
Quant Trader | Author | Blogger | Read My Book: [http://amzn.to/3mDBaFK](https://t.co/snnAtOeljv?amp=1 "http://amzn.to/3mDBaFK") | YouTube: [http://bit.ly/2Yq7cdd](https://t.co/zHxKDKDqqb?amp=1 "http://bit.ly/2Yq7cdd") | Quora: [https://bit.ly/2FdTTXI](https://t.co/MtOZKI8do1?amp=1 "https://bit.ly/2FdTTXI")
Subscribe to my newsletter
Read articles from Nataraj Malavade directly inside your inbox. Subscribe to the newsletter, and don't miss out.
Written by

Nataraj Malavade
Nataraj Malavade
I am Nataraj Malavade, a rule-based intraday and swing trader and a passionate trainer trying to help budding traders to find their trading edge. Trained over 500+ traders in online and classroom programs. I believe a disciplined mindset and impeccable execution are the holy grail of trading. I have been actively investing and trading in Indian markets since 2013. I use price action, market profile and options delta neutral concepts to analyze and opt for my intraday and swing trades.I have published my book MASTERMIND OF DAY TRADING , which talks about how to succeed in day trading by adopting rule-based techniques of market profile, price action and money management.Apart from trading and training,