Working with Geospatial Data: A Story About Implementing Our Own Reverse Geocoding
 Alexander Kolobov
In software development, one often encounters intriguing challenges, particularly when operating under stringent resource constraints and striving to minimize costs before the MVP proves its value. In such situations, the choice of algorithms and approaches becomes critical. I will discuss one such challenge related to working with geospatial data.
Reverse Geocoding
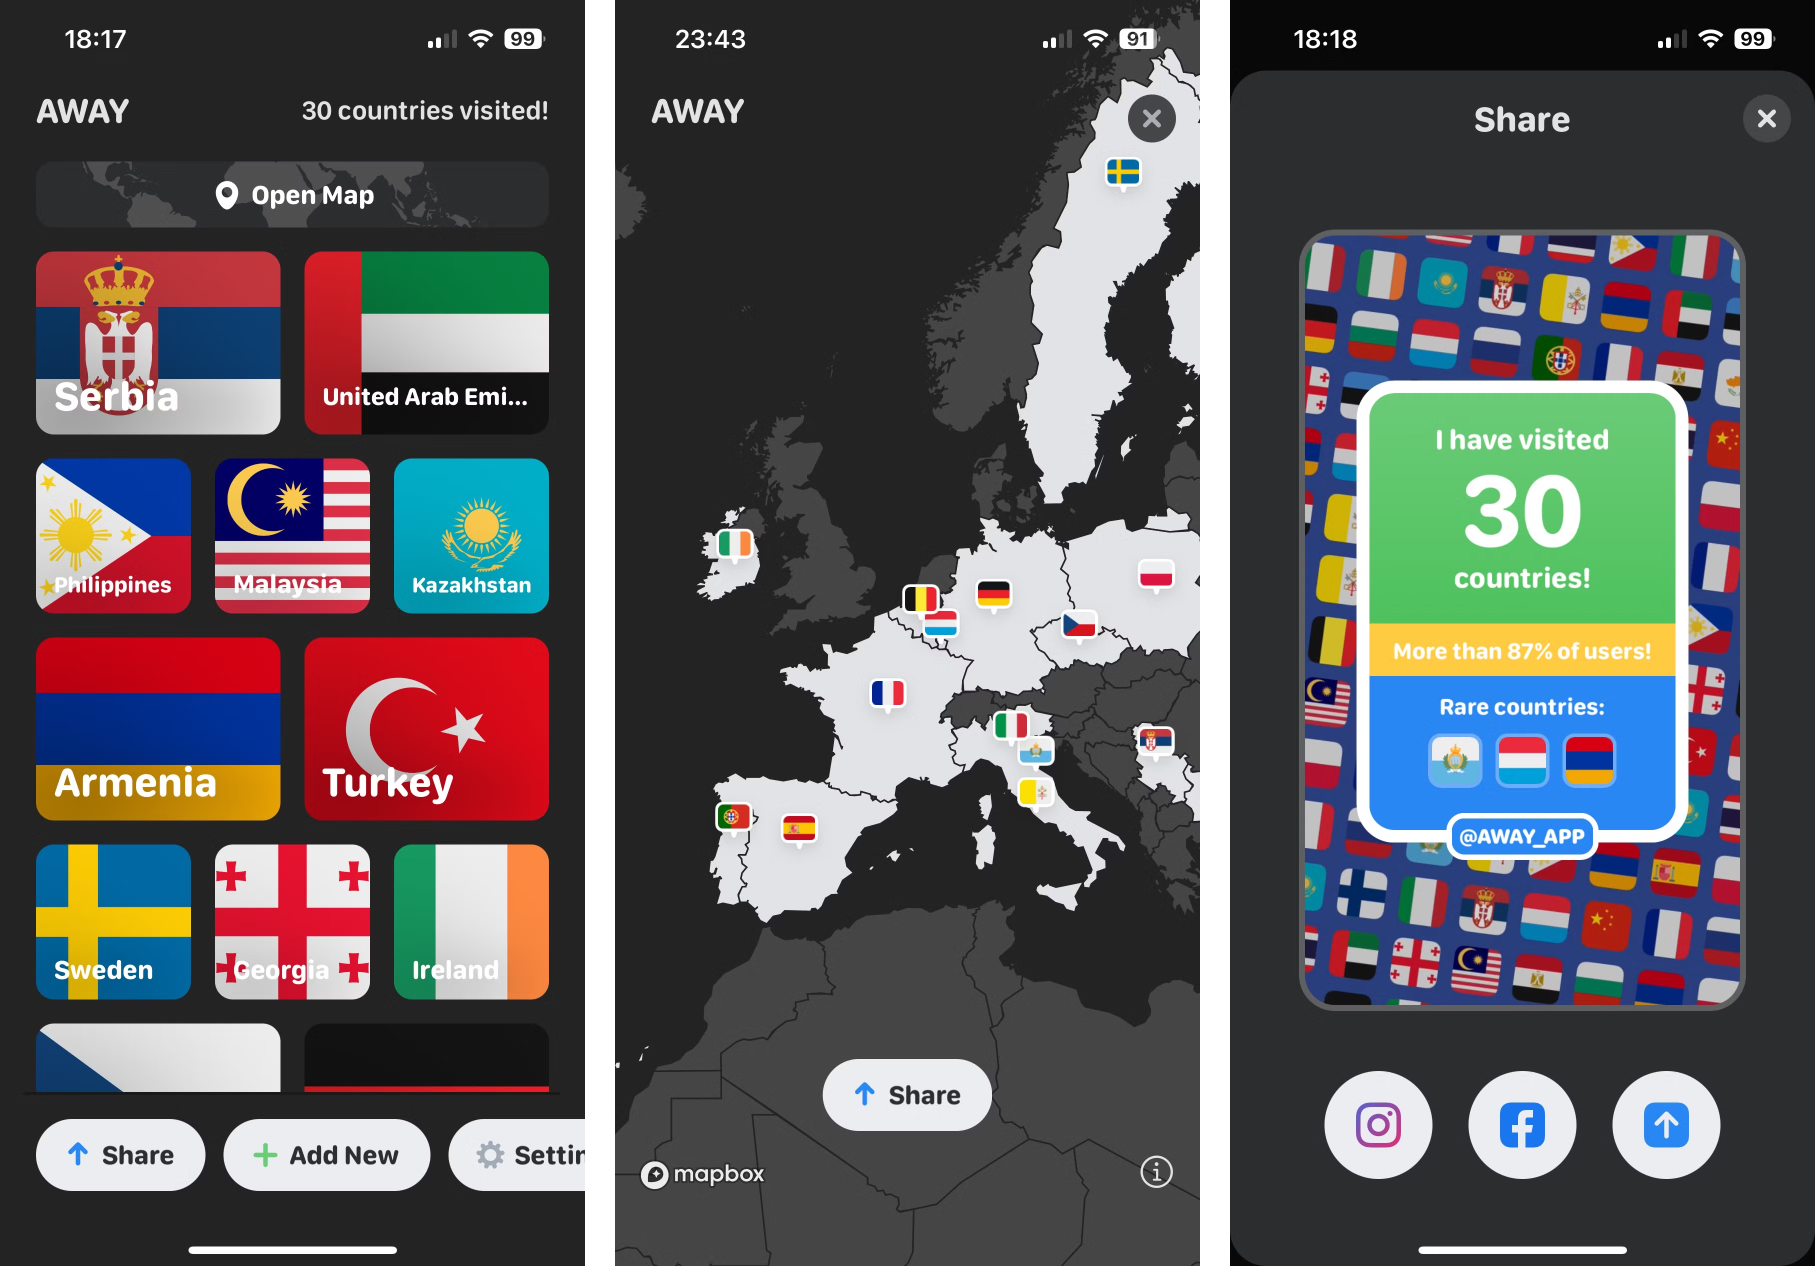
At the end of 2019, together with a couple of friends, I worked on developing a small iOS application called AWAY. The app allows users to maintain a list of countries they have visited and share it with others. The core concept behind it is that users do not need to manually input the countries they have visited.

Here’s how it works: if your phone contains photos, the app, upon requesting and receiving access to the media library, can read the latitude and longitude of where each photo was taken from the EXIF metadata. It then determines which country these coordinates belong to and adds that country to your list of visited places.
This process of obtaining an address (in this case, the country name) from geographic coordinates is called reverse geocoding. For reference, the reverse of this process — obtaining geographic coordinates from a textual address — is known as forward geocoding.
Third Party Solutions
When developing our MVP, we started with the simplest option available and used Apple’s default solution for reverse geocoding. The application worked, countries were automatically added to the list, and we began attracting our first users.
However, we soon encountered significant limitations. Apple’s solution was very slow due to strict rate limits on network requests to its API, and it wasn’t designed for batch processing of coordinates. Since user media libraries often contained thousands of photos, the process of determining the countries was extremely time-consuming, sometimes taking over 30 minutes to complete.
Such long wait times inevitably undermined our app’s virality. Instead of immediately receiving a list of visited countries and sharing it on Instagram or Facebook, users would simply leave without waiting for the process to finish.
We couldn’t find a more suitable third-party solution. Google, Mapbox, and other similar APIs either had the same issues as Apple — being ill-suited for batch processing and offering no time-saving advantage — or would have been prohibitively expensive given the volume of coordinates we needed to handle. In many cases, it was both. Even standalone solutions like Nominatim would have become too costly due to the expense of renting an appropriate server.
With no affordable off-the-shelf options available, I, being responsible for the backend, started building our own API.
GeoJSON
Before this project, I had no experience working with geospatial data, so I had to learn everything as we developed the application.
The first thing I needed for implementation was information on country borders to match coordinates. A widely used format for storing geographic data structures is GeoJSON.
GeoJSON is a standard JSON file with a specific structure that allows you to describe points, lines, and shapes of arbitrary complexity.
For example, let’s say we want to store information about Italy’s territory. For this, we would use a special object called Feature. The country’s borders would be described within a MultiPolygon object, which contains an array of polygons. Each polygon consists of one or more arrays of coordinate pairs, where the first and last pair of coordinates [lon, lat] are identical, forming a closed shape. The shape described in the first array will be added to the overall geographic zone, in this case, Italy itself, along with the island of Sardinia (the island would be described in a separate polygon). The coordinates in this array must be listed in a counterclockwise direction.
Any subsequent arrays within the polygon are optional and represent excluded areas. This will be necessary to exclude territories such as city-states completely surrounded by Italy, like San Marino and the Vatican. The coordinates in these arrays must be listed clockwise. The more points we specify, the more precise the country’s borders will be.
Metadata, such as the country’s name, can be included in a nested properties object.
{
  "type": "FeatureCollection",
  "features": [
    {
      "type": "Feature",
      "geometry": {
        "type": "MultiPolygon",
        "coordinates": [
          [ // Polygon
            // Exterior ring, Italy
            [ [20, 35],[10, 30],[10, 10], ... ,[45, 20],[20, 35]],
            // Interior "excluding" ring, San-Marino
            [ [30, 20],[20, 15],[20, 25], ... ,[30, 20]]
          ],
          [ // Polygon
            // Exterior ring, Sardinia
            [ [40, 40],[20, 45], [45, 30], ... ,[40, 40]]
          ]
        ]
      },
      "properties": {
        "country": "Italy",
      }
    }
  ]
}
Preparing Geodata
To create a world map, I had to source the most accurate GeoJSON files with the coordinates of all national borders, which turned out to be surprisingly challenging.
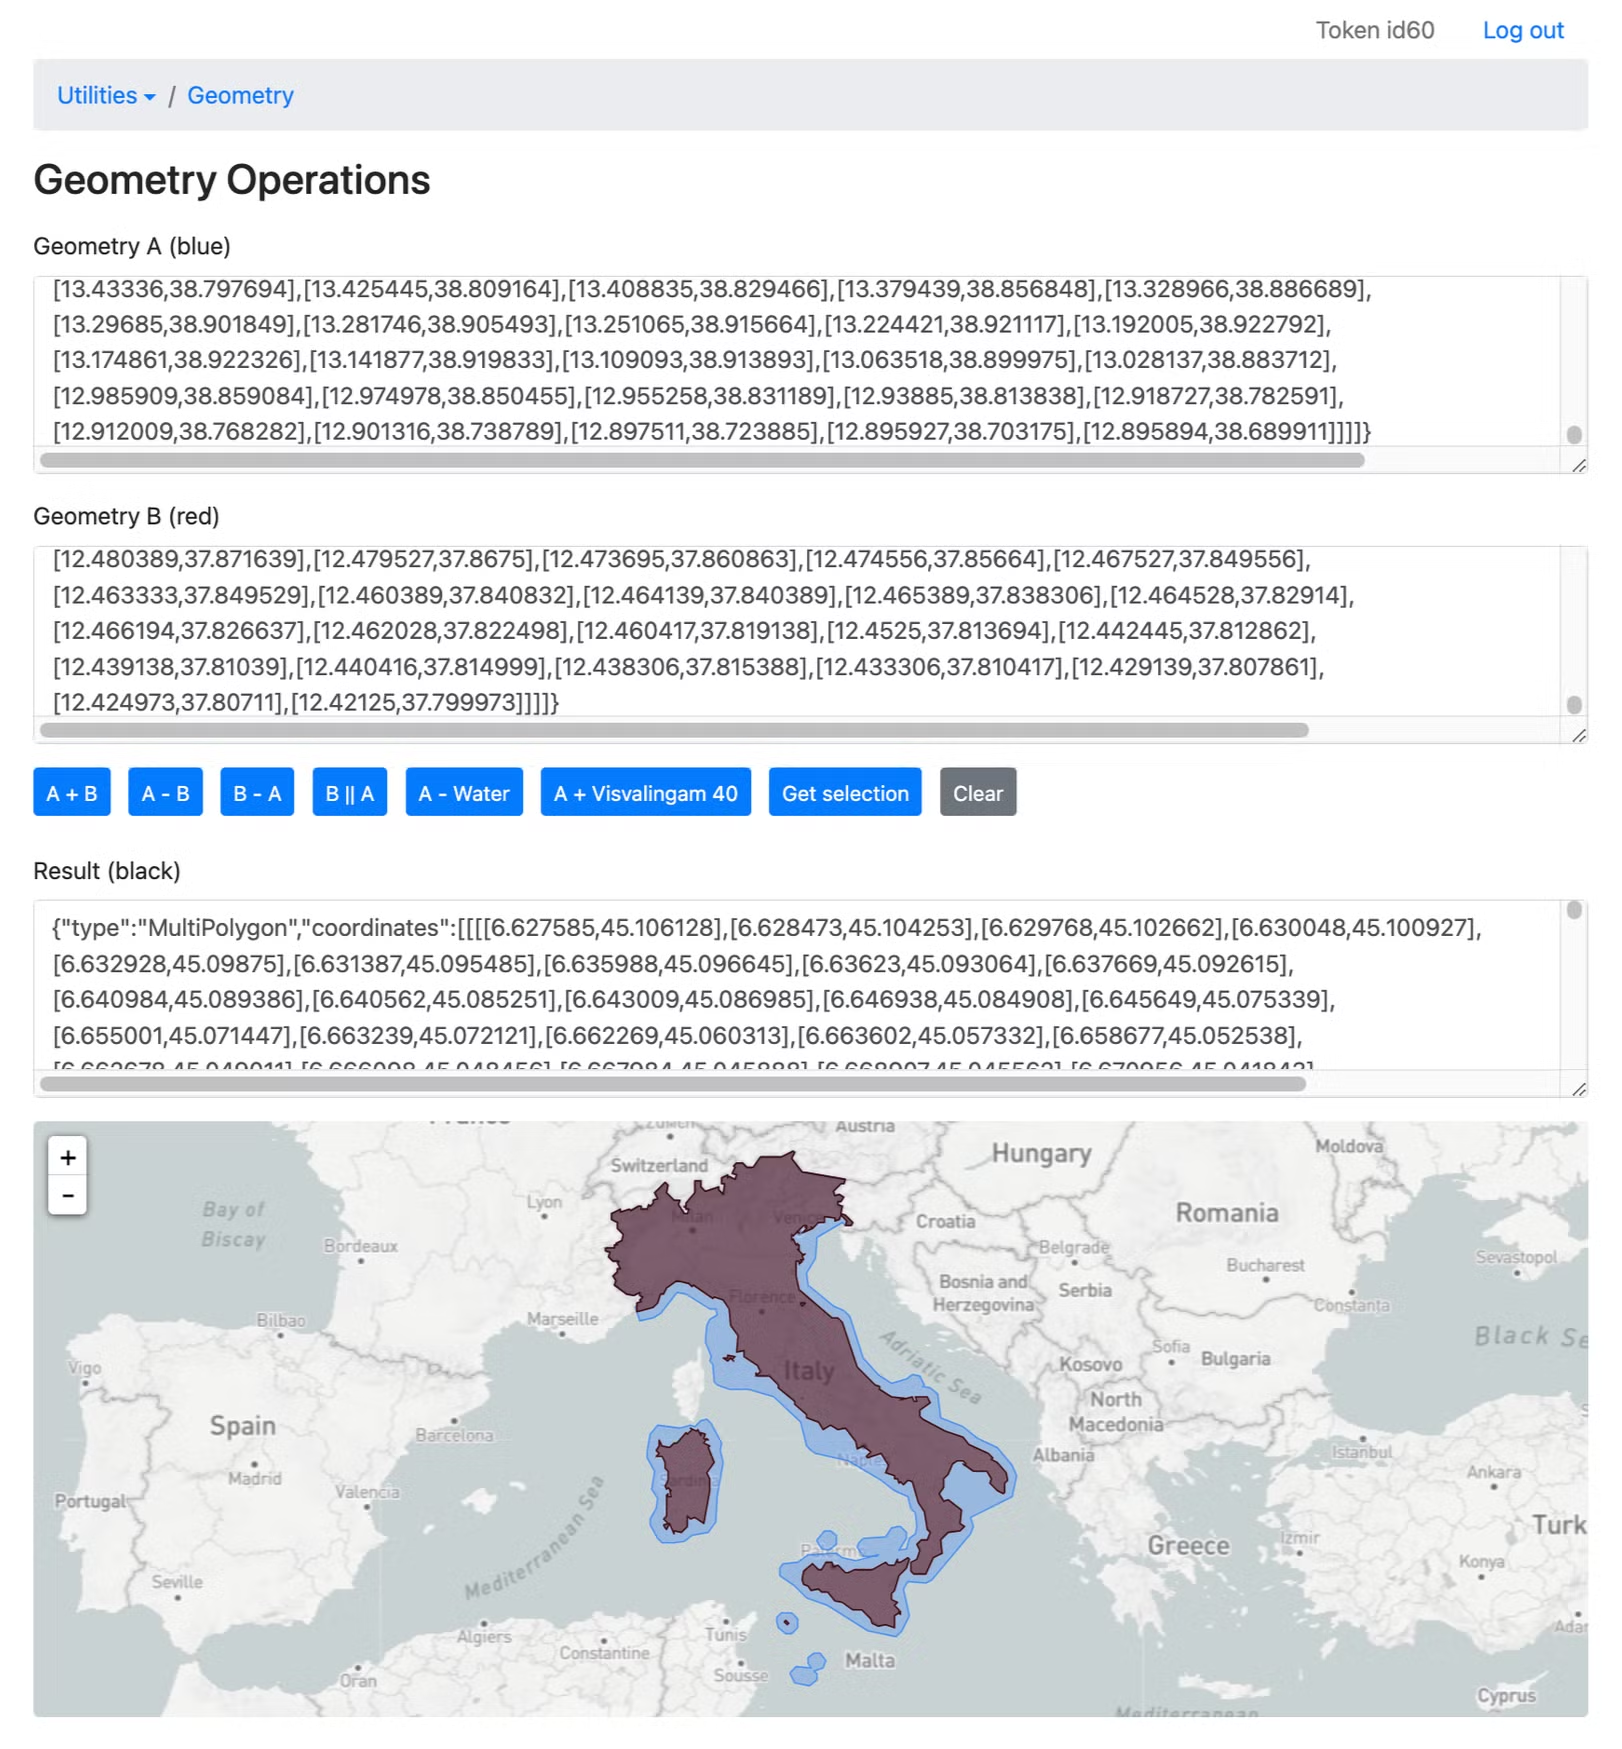
I relied on a variety of open sources, including aggregated data from oceanographic institutes, packages from npmjs.org, and open geographic data from Nominatim, among others. A common issue with all the data I obtained was its quality. Sometimes, borders overlapped, particularly in cases of political disputes between regions. In other cases, only data that included territorial waters was available, which wasn’t suitable for our needs. I had to exclude those waters by subtracting the ocean map from the country territories (special thanks to the Flanders Marine Institute for providing the necessary data). Occasionally, the resolution (the number of coordinates) was too low for reliable geocoding, requiring me to seek out alternatives.
The application’s requirements were quite demanding: we needed accurate, non-overlapping boundaries for each geographic area in high resolution without territorial waters (for display on the in-app map), and lower-resolution borders including territorial waters (for faster and more efficient geocoding, especially for photos taken on ships near coastlines — an issue we discovered when working with third-party solutions).
After a week and a half of meticulous work, I managed to create two high-resolution GeoJSON files. One, countries_maritime.json, described the boundaries of all countries, including their territorial waters, while the other, countries_coastline.json, provided exact borders and coastline details. Each file was several hundred megabytes in size, and by the end, I felt like I had personally visited every corner of the world.
API
When launched, the updated version of the app collected all previously unprocessed photo coordinates from the user’s media library in batches of 10,000 and sent them to my backend in multiple requests.
The backend, built on Node.js and hosted on AWS, loaded the countries_maritime.json file into memory upon initialization. When a request with a batch of coordinates arrived, it used the polygon-lookup library to match the coordinates to the corresponding territories from the file, which contained 250 countries.
The list of coordinates underwent strict validation since, as it turned out, some coordinates were outside the allowable range. We also discarded coordinates with altitudes higher than 8,850 meters (slightly above Everest’s peak) to avoid counting typical Instagram-style photographs of airplane wings (planes usually fly at altitudes above 9,000 meters).
When a match was found, the country identifier from the property section of the corresponding territory was recorded. After processing all the coordinates, the list of recorded identifiers was deduplicated, added to the user’s list of visited countries, and returned to the client to synchronize the app with the backend database.
After switching to our custom solution, the peak processing speed reached 10,000 coordinates per second (in synthetic tests), the median time to process a user’s media library dropped to 20–25 seconds (from user registration to returning the list of visited countries), and the average number of countries added grew by 225% per user due to more accurate geocoding.
Geodata Administration
As the app continued to grow, users began submitting feature requests. One of the most frequent requests was the addition of automatic recognition for regions and major cities within each country.
This was a significant challenge. Collecting high-quality data for the borders of 250 countries had already been difficult. The prospect of gathering similar data for thousands of regions and cities was even more daunting.
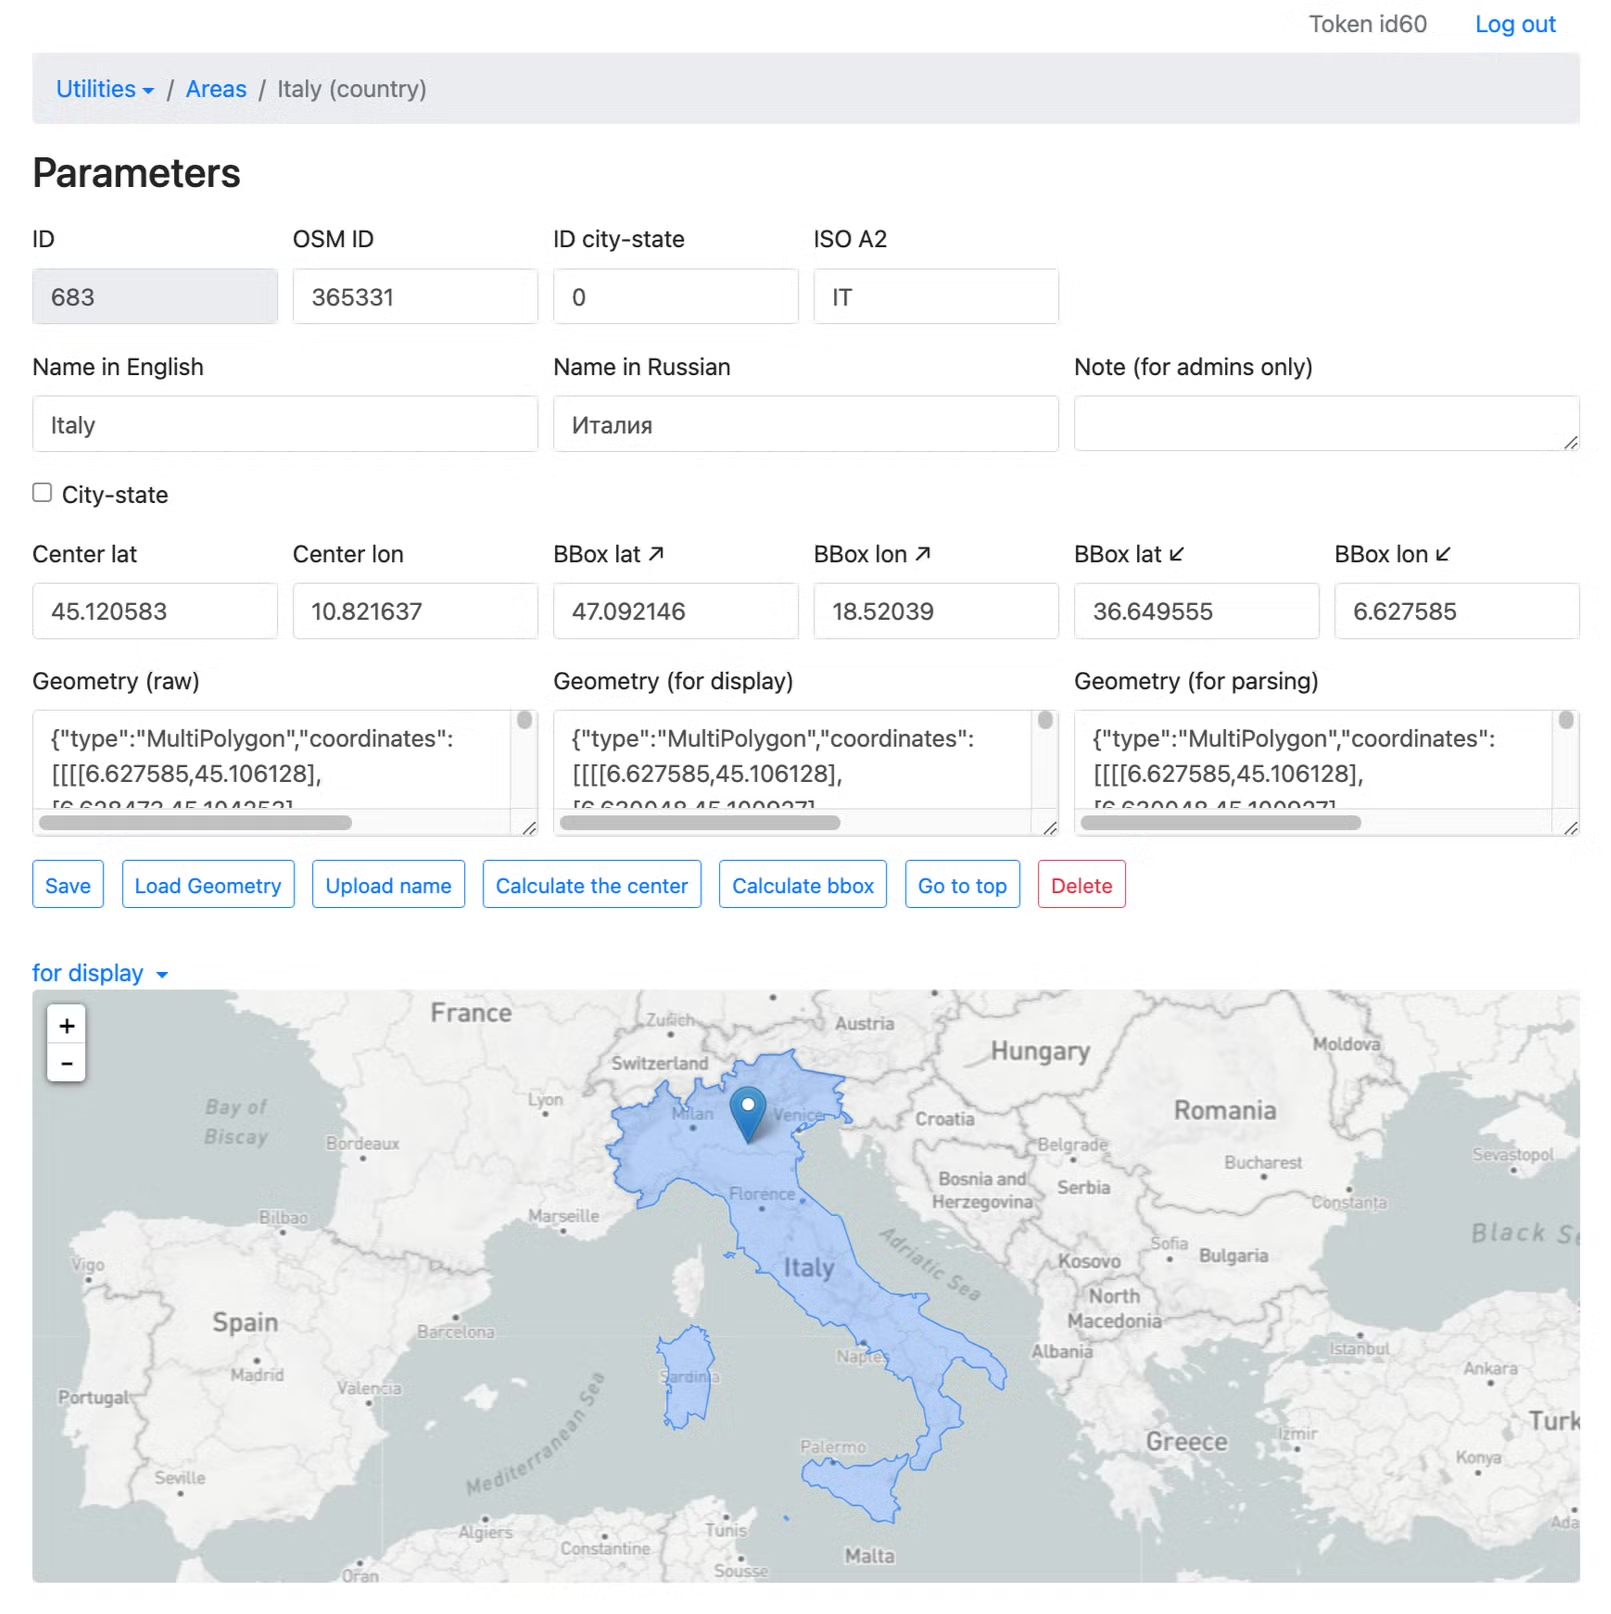
To address this, I transferred the territories from the JSON file into a Postgres table and developed an administration interface for managing geographic zones. Additionally, I integrated the admin panel with several external APIs to automate the creation of lists for regions and cities based on their parent countries.

The first issue I encountered was the inherent complexity of geographic region data. There is no universally clear distinction between regions and cities, and different countries have varying levels of administrative divisions. Determining the correct levels of hierarchy required constructing complex queries to overpass-api.de, using conditions and recursive calls to filter by administrative centers, population size, and internal relations. This also involved studying how to split and organize geographic nodes, their relationships, and nested structures, and correcting some erroneous data.
The second challenge arose when working with the coordinate sources for region boundaries. After retrieving lists of osmId for regions and cities, I needed to extract the geometry of their borders. After extensive searching, I settled on using nominatim.openstreetmap.org, and the almost entirely undocumented polygons.openstreetmap.fr, which I had to reverse-engineer to properly access. These sources were incomplete, so I had to send multiple requests and compare their results, selecting the best match based on the quality of the returned data.
Despite the lack of documentation, complex data relationships, and inconsistencies in the sources, I was able to create a stable solution. The admin panel interface now allows for the automatic loading of city and region lists for any country with just a few clicks, including their metadata and the best available boundary geometries. The data is then stored in the database, where it can be further refined for user availability, caching, and inclusion in the geocoding index.
To address frequent issues with the GeoJSON data, I even developed a built-in editor that allows splitting, merging, subtracting, and drawing missing boundary geometries.

All these tools enabled us, with a team of just two people, to create a database of regions and cities that we were proud to present to users within a month and a half.
Currently, the app supports 3,134 regions and 28,083 cities, each with precise boundaries, and tracks the number of users who have visited them.
Minimizing Geodata
Handling 31,467 territories with Node.js became unmanageable due to performance and resource limitations already at the index initialization step. My first idea to address this challenge was to reduce the size of the GeoJSON data while minimizing any visual degradation.
As I mentioned earlier, the data needed for app display and geocoding had very different requirements: while the preparation of map tiles for rendering in the app сould afford to last for minutes, geocoding was highly sensitive to data volumes, with its speed directly tied to the number of coordinates in the territorial boundaries.
I experimented with several algorithms to simplify the coordinate chains of polygons.
The first approach was the Ramer–Douglas–Peucker algorithm, but it yielded unsatisfactory results. Its approximation was unstable, leading to mismatches in shared borders between different GeoJSON files, and it also caused the loss of smaller details, such as islands.
Ultimately, I developed my own implementation based on the Visvalingam–Whyatt algorithm tailored for working with GeoJSON. The existing implementations of this algorithm could only be applied to specific parts of a GeoJSON structure, which solved the issue of result stability but still caused significant degradation of borders and the loss of small details. My approach broke down the GeoJSON into its components, merged them into a single min heap (with the angle between three neighboring coordinates as the heap element), and processed it as one curve. I then reconstructed it into the final object. This allowed for a more uniform exclusion of points and avoided the loss of crucial details.
In addition to reducing data volumes, this restructuring of the GeoJSON files helped uncover numerous errors and conflicts within the data:
Unclosed coordinate arrays.
Conflicting arrays due to incorrect coordinate winding.
Empty coordinate arrays.
Excessive nesting.
Unnecessary precision in coordinates.
I successfully automated the validation and correction of these errors, partly using existing tools such as polygon-clipping, @mapbox/geojsonhint, @mapbox/geojson-rewind, and @mapbox/geojson-extent, and partly by implementing custom operations. These included merging separate polygons into multipolygons and geometry collections, reducing coordinate resolution to the required level, correcting coordinate direction, and removing empty arrays.
As a result, I achieved a significant improvement in the performance of geodata processing. Additionally, the stability of my algorithm resolved the issue of mismatched simplified borders between adjacent regions on the map.
Go Microservice
Despite reducing computational load through the simplification of geodata, it became clear that Node.js was definitely not the ideal solution for our needs. I considered using PostGIS or developing a custom microservice. After extensive research, including performance and resource consumption measurements, I opted for the latter — a simple microservice built with Go.
The microservice architecture is designed to maximize the speed of coordinate pair processing while minimizing unnecessary operations.
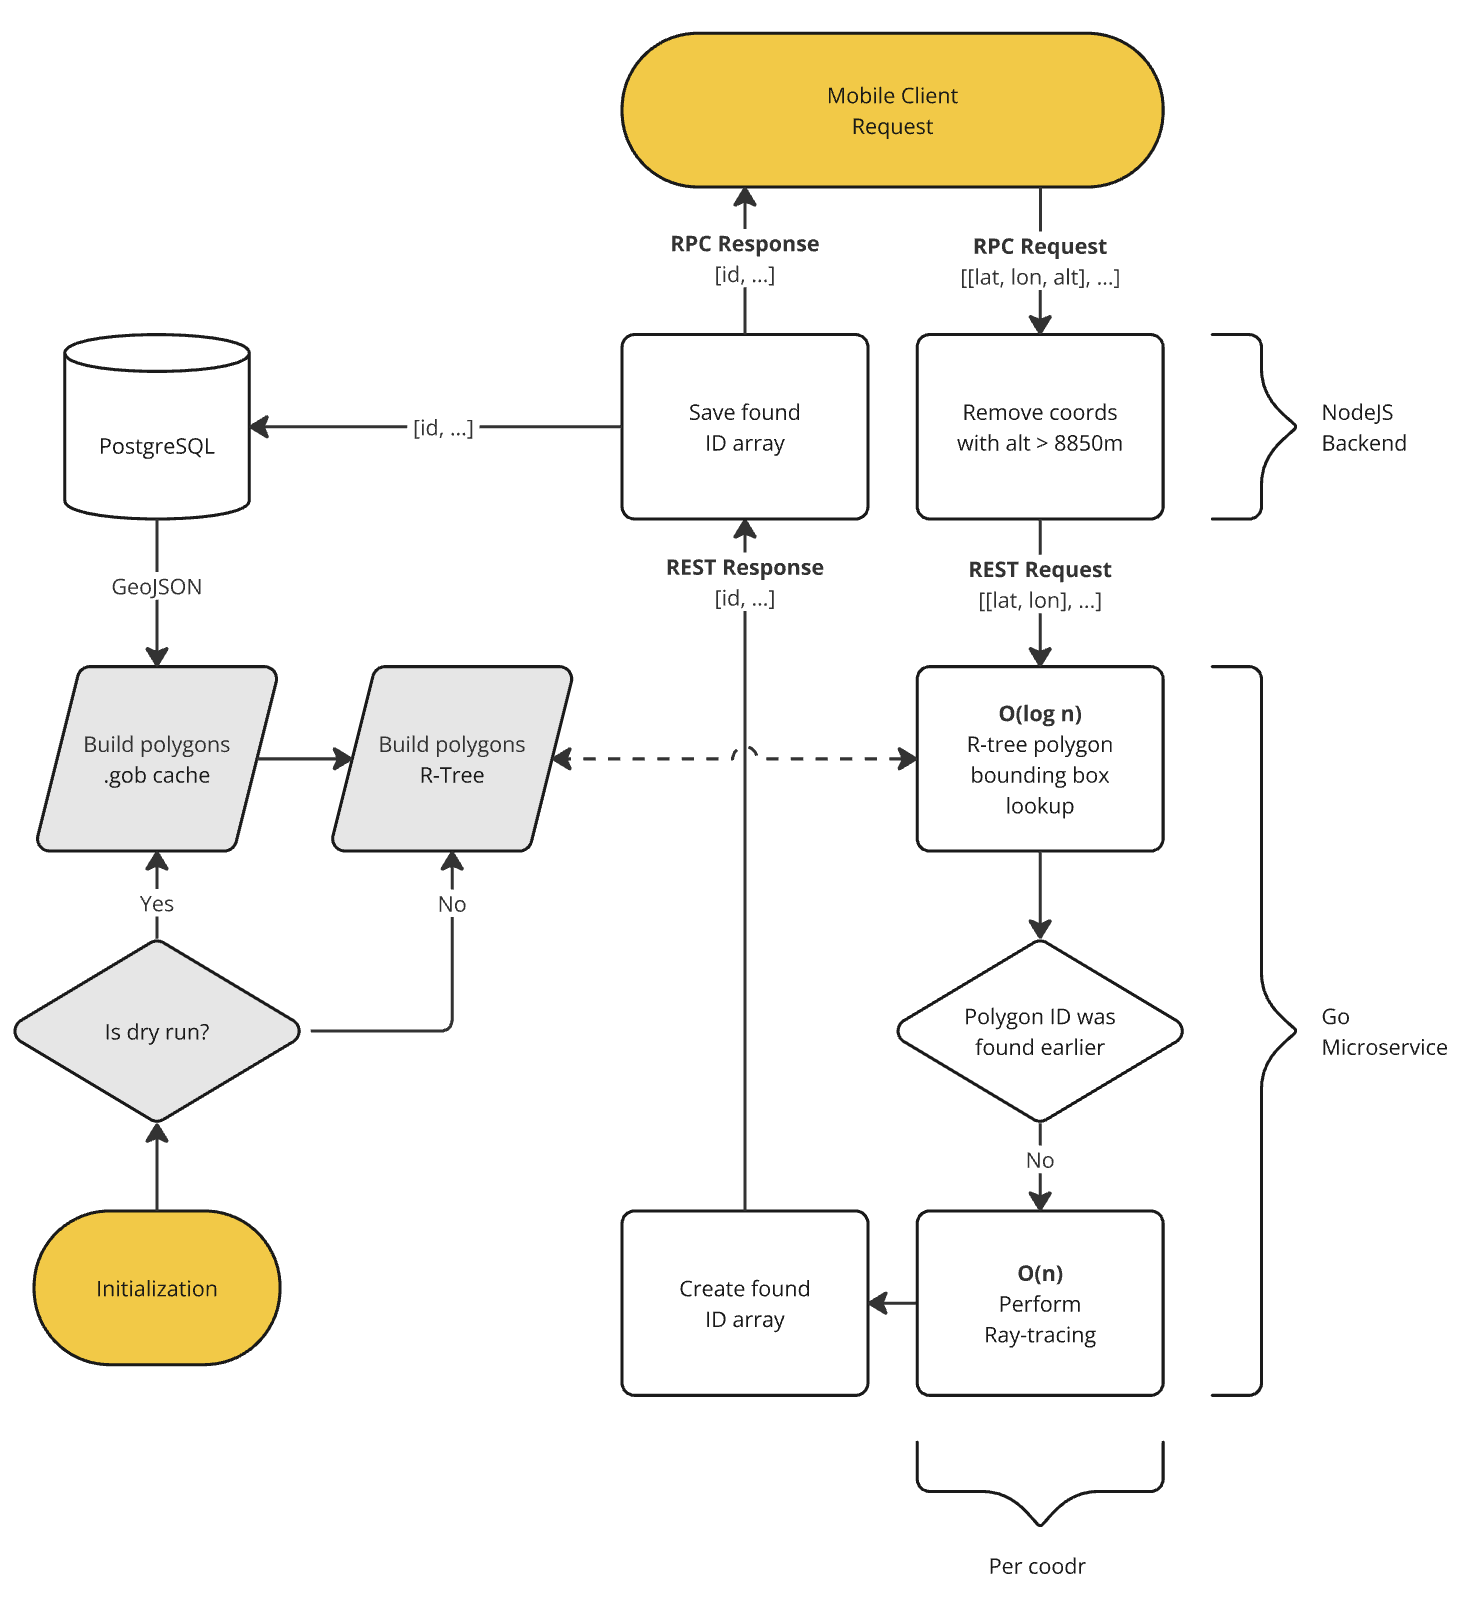
Upon its first run, the microservice connects to PostgreSQL and retrieves all the relevant GeoJSON data in batches of 100 objects. This data is parsed into structures, each containing a polygon and the corresponding territory identifier. These structures are then cached into a gob file to save time on subsequent restarts of the microservice.
Once the structure array is created, an R-tree is built from it. This type of tree is often used to create search indices for multidimensional data, such as polygons. The tree enables logarithmic-time searches for the smallest bounding rectangle that includes the target polygon.
After the tree is built, the microservice enters a listening state, awaiting incoming requests.
When a request is received, consisting of coordinate pairs [lat, lon] multithreaded processing is initiated. The result is an array of unique territory identifiers that contain the provided coordinates.
Each coordinate first undergoes a search through the R-tree. This search may return a rectangle that contains a polygon, which might potentially include the coordinate. To verify if the coordinate is actually inside the polygon, the ray-casting algorithm is used. This algorithm operates in linear time, making it the most resource-intensive part of the process. However, before executing the ray-casting check, I verify whether the territory identifier for the polygon has already been found during the processing of other coordinates in the request. If it has, the ray-casting check is skipped, significantly reducing the service’s processing time.
After all threads complete their work, the array of identifiers is returned to the Node.js layer. Below, I’ve attempted to represent the architecture in the following diagram:

The entire search process, apart from the specific optimization to skip repeated ray-casting checks, closely mirrors how PostGIS handles a similar task when using GiST indexes.
Using the API built around the Go microservice, we achieved the ability to process around 100,000 coordinate pairs per second for more than 30,000 geographic zones. In comparison, the previous Node.js solution managed around 10,000 coordinate pairs for 250 zones, including the overhead of network requests and backend operations.
This significant improvement in processing speed enabled much faster compilation of users visited country lists. Additionally, with the support for recognizing regions and cities, the app saw a 160% increase in active users and a 107% rise in users sharing their results.
The solution remains in use today and continues to handle a growing volume of requests and geographic zones efficiently. Remarkably, the entire backend operates with less than a gigabyte of RAM, showcasing its optimized resource usage.
Subscribe to my newsletter
Read articles from Alexander Kolobov directly inside your inbox. Subscribe to the newsletter, and don't miss out.
Written by

Alexander Kolobov
Alexander Kolobov
FullStack Developer, Team Lead, Product Manager, posting notes about my development experience