Prometheus Node Exporter Installation Process
 Srikanth Pentapati
To install Node Exporter on Ubuntu 20.04 and configure it to collect Linux system metrics, such as CPU load and disk I/O, follow these steps. This process is similar to the Prometheus installation process:
- Create a system user for Node Exporter with the following command:
sudo useradd \
    --system \
    --no-create-home \
    --shell /bin/false node_exporter
- Download Node Exporter using the wget command from the same page as Prometheus:
exwget https://github.com/prometheus/node_exporter/releases/download/v1.6.1/node_exporter-1.6.1.linux-amd64.tar.gz
- Extract Node Exporter from the archive:
tar -xvf node_exporter-1.6.1.linux-amd64.tar.gz
- Move the Node Exporter binary to the /usr/local/bin directory:
sudo mv \
  node_exporter-1.6.1.linux-amd64/node_exporter \
  /usr/local/bin/
- Clean up by deleting the Node Exporter archive and folder:
rm -rf node_exporter*
- Verify that you can run the Node Exporter binary:
node_exporter --version
- Node Exporter offers various plugins that can be enabled. Use the following command to view all available options:
node_exporter --help
- Create a systemd unit file for Node Exporter:
sudo vim /etc/systemd/system/node_exporter.service
Here's the content of the node_exporter.service file:
[Unit]
Description=Node Exporter
Wants=network-online.target
After=network-online.target

StartLimitIntervalSec=500
StartLimitBurst=5

[Service]
User=node_exporter
Group=node_exporter
Type=simple
Restart=on-failure
RestartSec=5s
ExecStart=/usr/local/bin/node_exporter \
    --collector.logind

[Install]
WantedBy=multi-user.target
Replace the Prometheus user and group with node_exporter, and update the ExecStart command accordingly.
- 💡Make sure that you have removed the firewall restrictions for the 9100 port
To ensure Node Exporter starts automatically after a reboot, enable the service:
sudo systemctl enable node_exporter
- Start Node Exporter:
sudo systemctl start node_exporter
- Check the status of Node Exporter with the following command:
sudo systemctl status node_exporter
At this point, you have a single node in Prometheus. Prometheus offers various service discovery mechanisms, including dynamic discovery in cloud environments. In future tutorials, you can explore deploying Prometheus in cloud-specific environments or within Kubernetes clusters.
Now, Go back to the Node, where you have installed the Prometheus and perform the following steps
- To create a static target, edit the Prometheus configuration file:
sudo vim /etc/prometheus/prometheus.yml
Here's an example of adding a static target:
  - job_name: node_export
    static_configs:
      - targets: ["localhost:9100"]
By default, Node Exporter exposes metrics on port 9100.
- Since you enabled lifecycle management via API calls, you can reload the Prometheus configuration without service downtime. Before reloading, validate the configuration with promtool:
promtool check config /etc/prometheus/prometheus.yml
- Use a POST request to reload the configuration:
curl -X POST -u username:password http://localhost:9090/-/reload
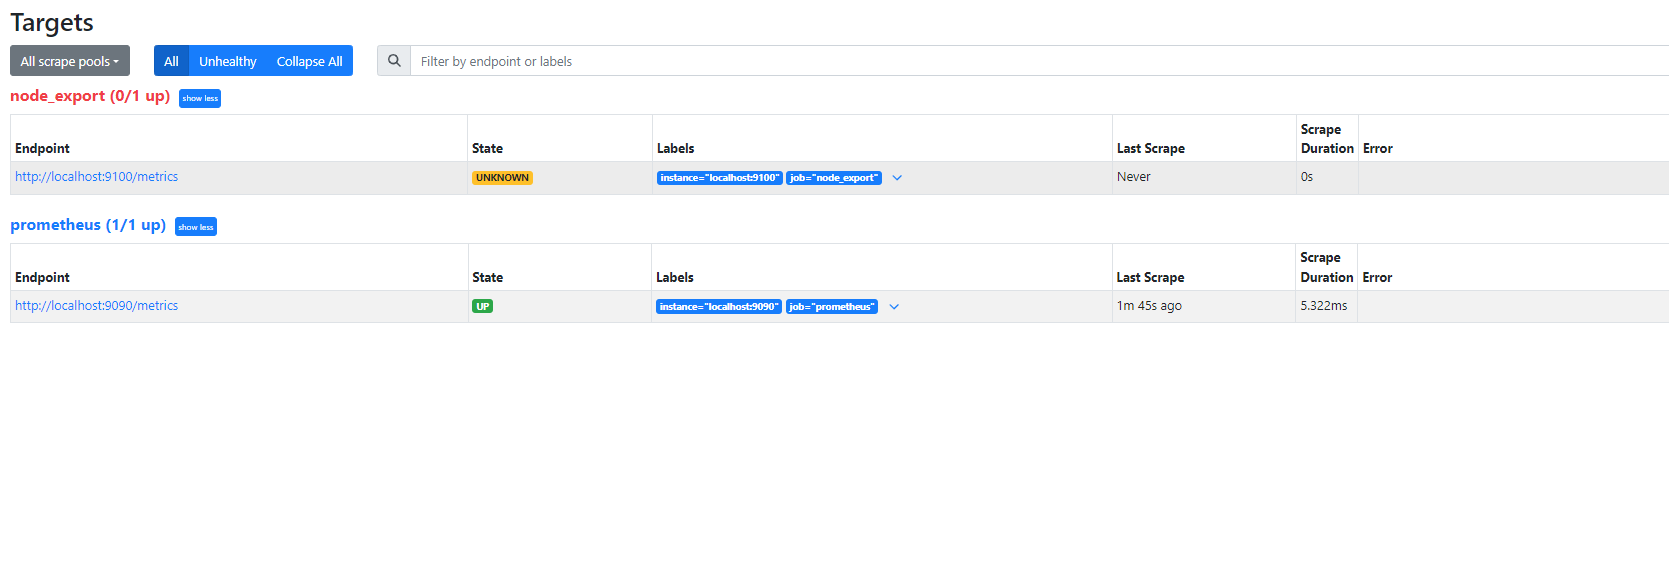
- Check the "targets" section by navigating to http://:9090/targets to ensure that the static target is functioning correctly.

Perform the same process on all the nodes and connect to the Prometheus database.
Subscribe to my newsletter
Read articles from Srikanth Pentapati directly inside your inbox. Subscribe to the newsletter, and don't miss out.
Written by
