Optimizing Performance: A Comprehensive Guide to Prometheus and Grafana Monitoring for Spring Boot
 Amal Ennajar
Introduction 🏁
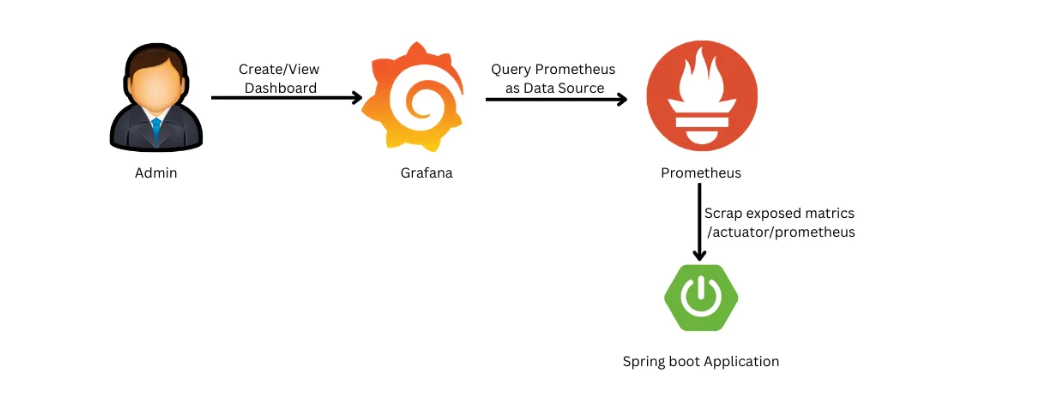
In this extensive guide, we'll comprehensively cover the process of implementing Prometheus and Grafana to monitor your Spring Boot application. Each step will be thoroughly explained with clear instructions and accompanied by insightful screenshots, ensuring a detailed walkthrough for setting up the monitoring system. So, get ready as we delve into the setup process.
Overview of Prometheus: Prometheus stands as a widely embraced open-source system for monitoring and alerting. Its primary function involves the collection, storage, and analysis of metrics sourced from a variety of origins such as applications, services, operating systems, and hardware devices. By offering valuable insights into system health and performance, it serves as an indispensable tool in the realm of monitoring.
Overview of Grafana: Grafana, also an open-source solution, serves as a pivotal tool for data visualization, monitoring, and troubleshooting. It excels in creating dashboards that visualize metrics derived from a range of sources including Prometheus, Elasticsearch, InfluxDB, and CloudWatch. These dashboards are customizable, allowing the integration of graphs, tables, charts, and maps tailored to specific requirements.
Prerequisites: To effectively follow this guide, it's essential to have:
A functional Spring Boot application for monitoring purposes. Docker was installed to execute the Prometheus and Grafana images.
Step 1:Setting up Spring Boot project to enable monitoring with Prometheus and Grafana
Add the below maven dependencies to the pom.xml file of your spring boot project.
The Actuator dependency allows the activation of endpoints that provide insights into various aspects of your application, including its health, metrics, configuration, and monitoring. On the other hand, the Micrometer dependency serves the purpose of configuring Spring Boot applications to expose metrics in a manner compatible with Prometheus, enabling its scraping and storage functionalities.
<dependency>
   <groupId>io.micrometer</groupId>
   <artifactId>micrometer-registry-prometheus</artifactId>
</dependency>
<dependency>
   <groupId>org.springframework.boot</groupId>
   <artifactId>spring-boot-starter-actuator</artifactId>
</dependency>
Step 2:Customize Your Spring Boot Application
To kick off our monitoring journey, start by customizing your application.properties file. Open it and add the following lines:
management.endpoint.metrics.enabled=true
management.endpoints.web.exposure.include=*
These configurations expose the necessary metrics for Prometheus to scrape.
Now if you call http://192.168.56.5:8082/SpringMVC/actuator/prometheus endpoint, it gives metrics data in a format compatible with Prometheus.
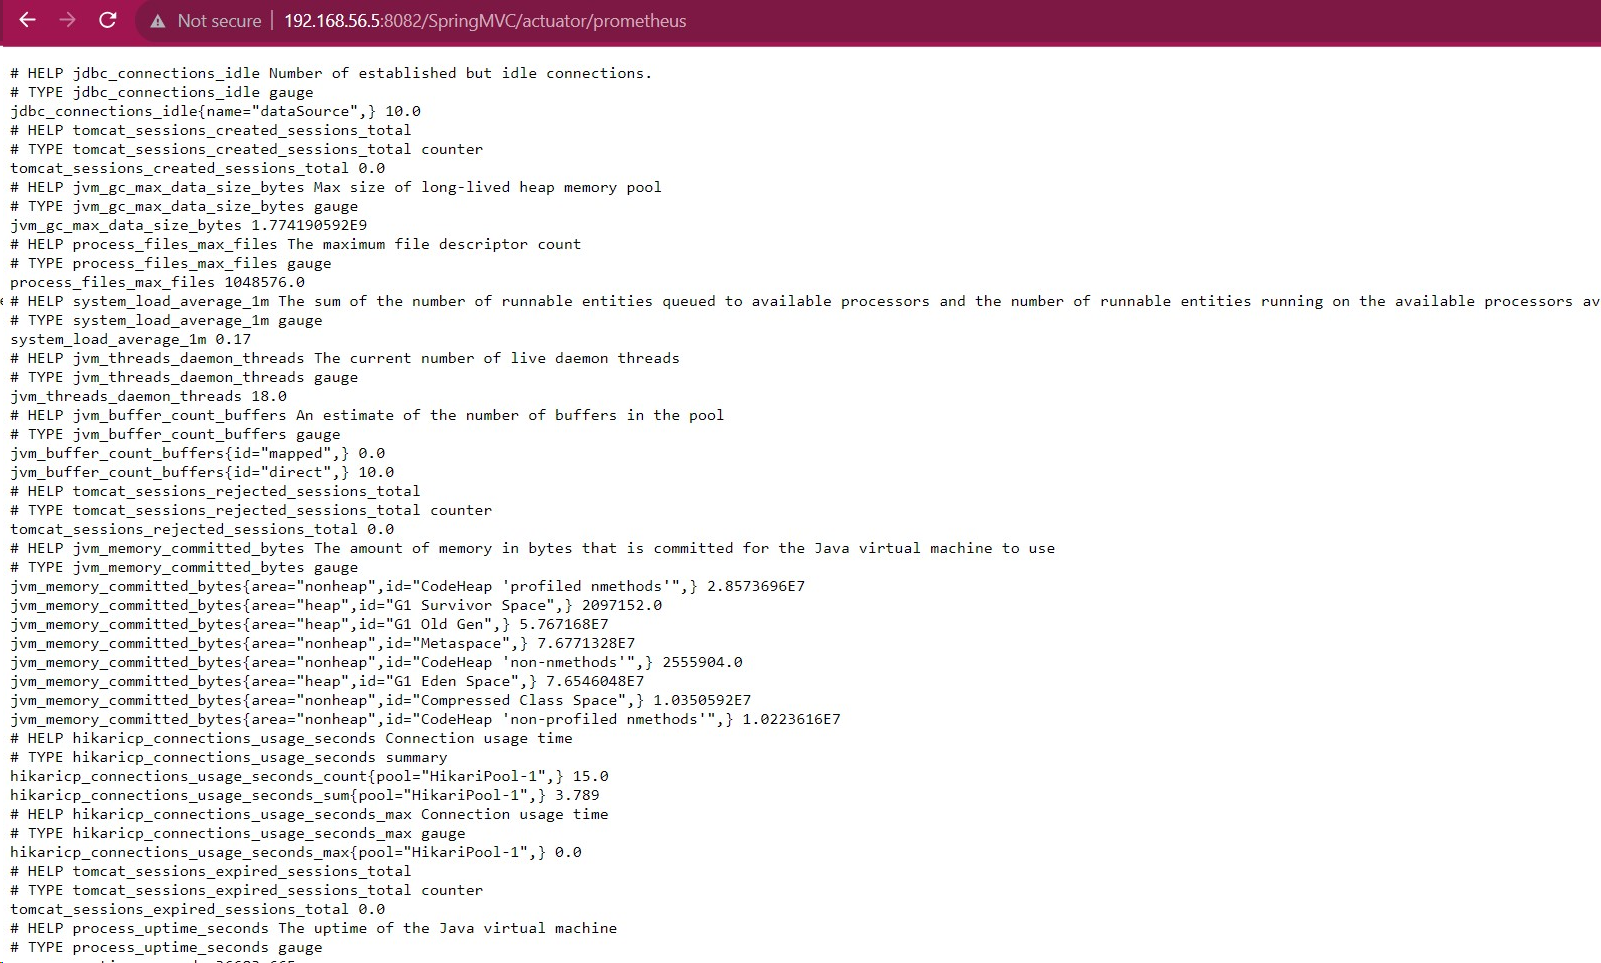
Excellent! The final step involves integrating these configurations into your Spring Boot project, enabling monitoring through Prometheus and Grafana.
Step 3:Setting up Prometheus and Grafana using Docker
Let's proceed by launching a Prometheus container. Run the following command:
docker run --name=prometheus -p 9090:9090 prometheus
Once the container is up, configure Prometheus by editing the prometheus.yml file. Utilize the content below:
scrape_configs:
  - job_name: 'prometheus'
    scrape_interval: 5s
    static_configs:
      - targets: ['192.168.56.5:9090']

  - job_name: 'spring-actuator'
    metrics_path: '/SpringMVC/actuator/prometheus'
    scrape_interval: 2s
    static_configs:
      - targets: ['192.168.56.5:8082']
        labels:
          group: 'production'
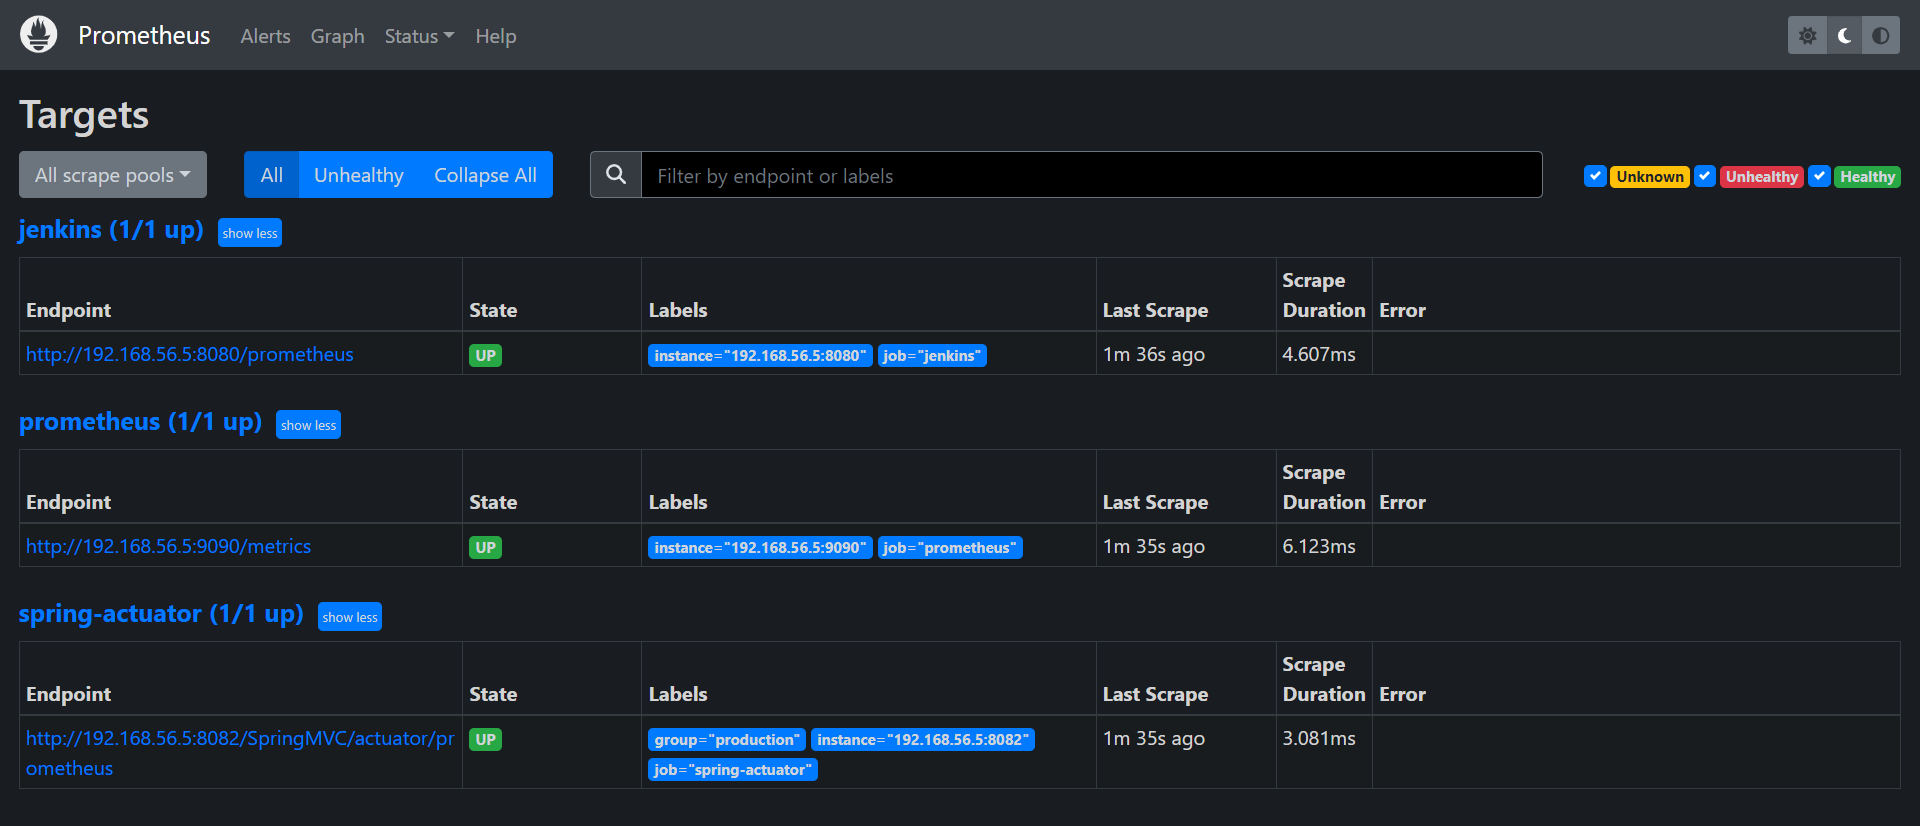
This configuration instructs Prometheus to collect metrics from both its own instance and your Spring Boot application.
Following the configuration, navigate to Prometheus to visualize the collected metrics directly. This will grant you access to the raw data of the gathered metrics, offering an intricate view before any visualization or interpretation is applied.
Now, let’s configure Grafana for visualizing our metrics. Start by running a Grafana container:
docker run -d --name grafana -p 3000:3000 grafana/grafana
Access Grafana at http://network:3000 (default credentials are admin/admin).
Create a new Prometheus data source and use the URL
Demo 🎬
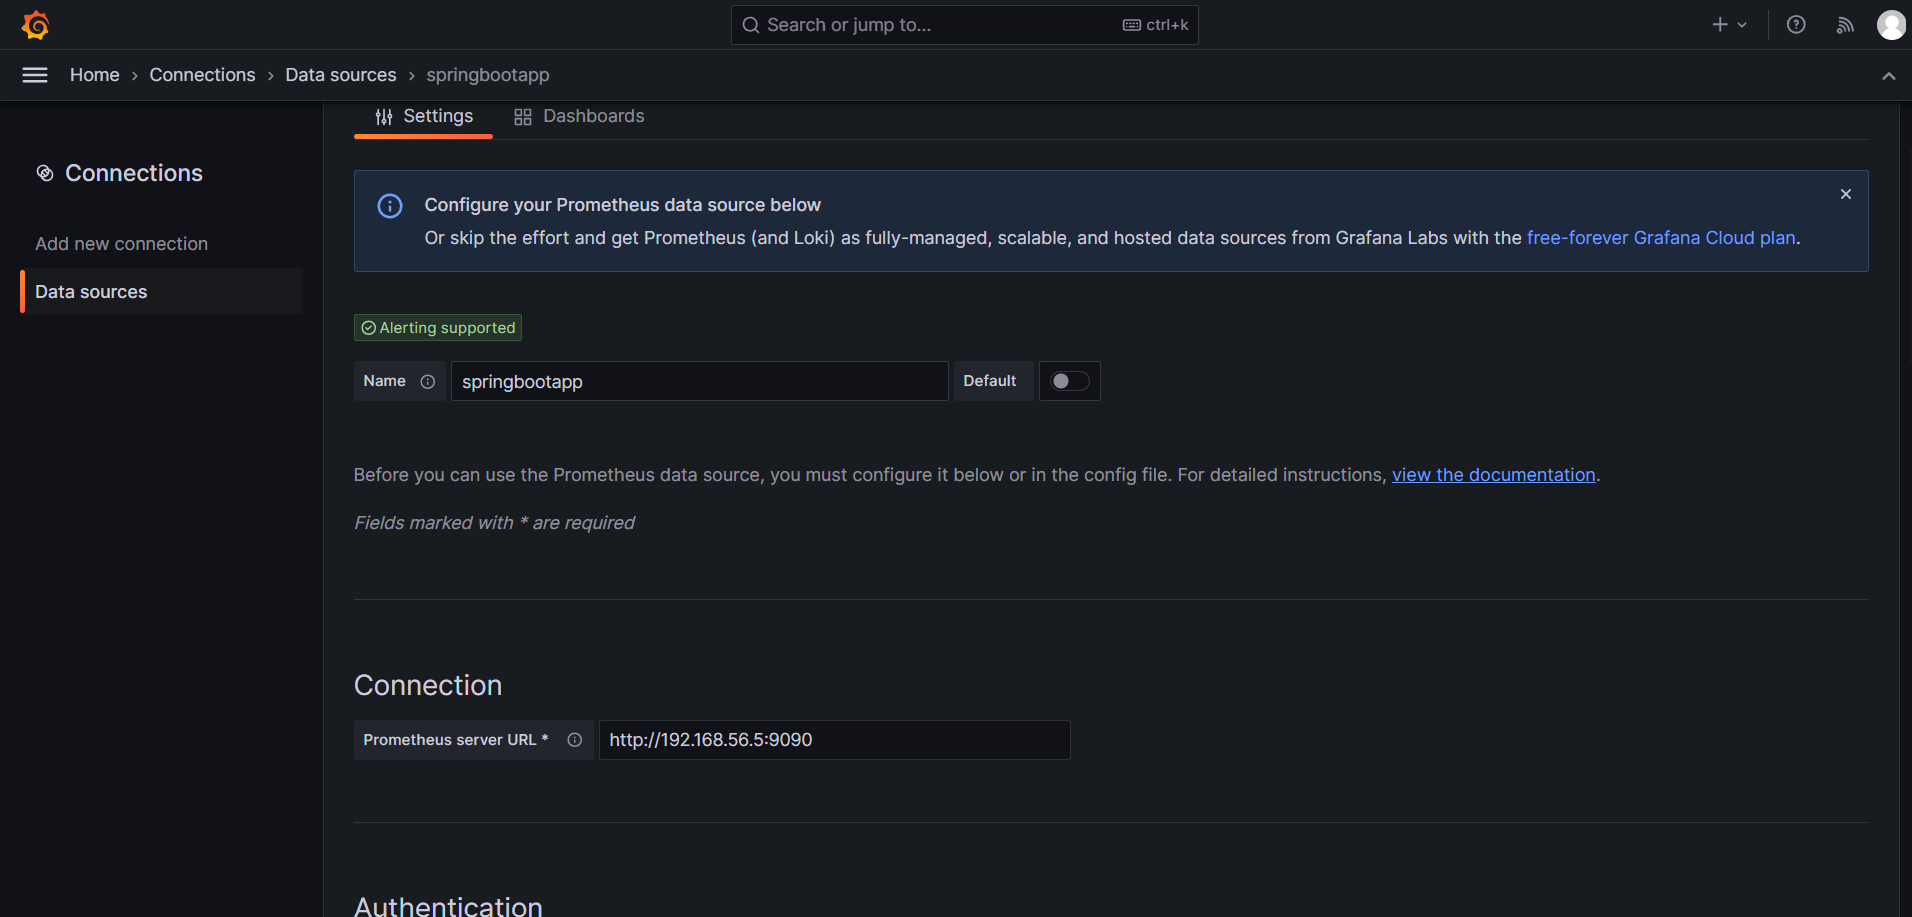
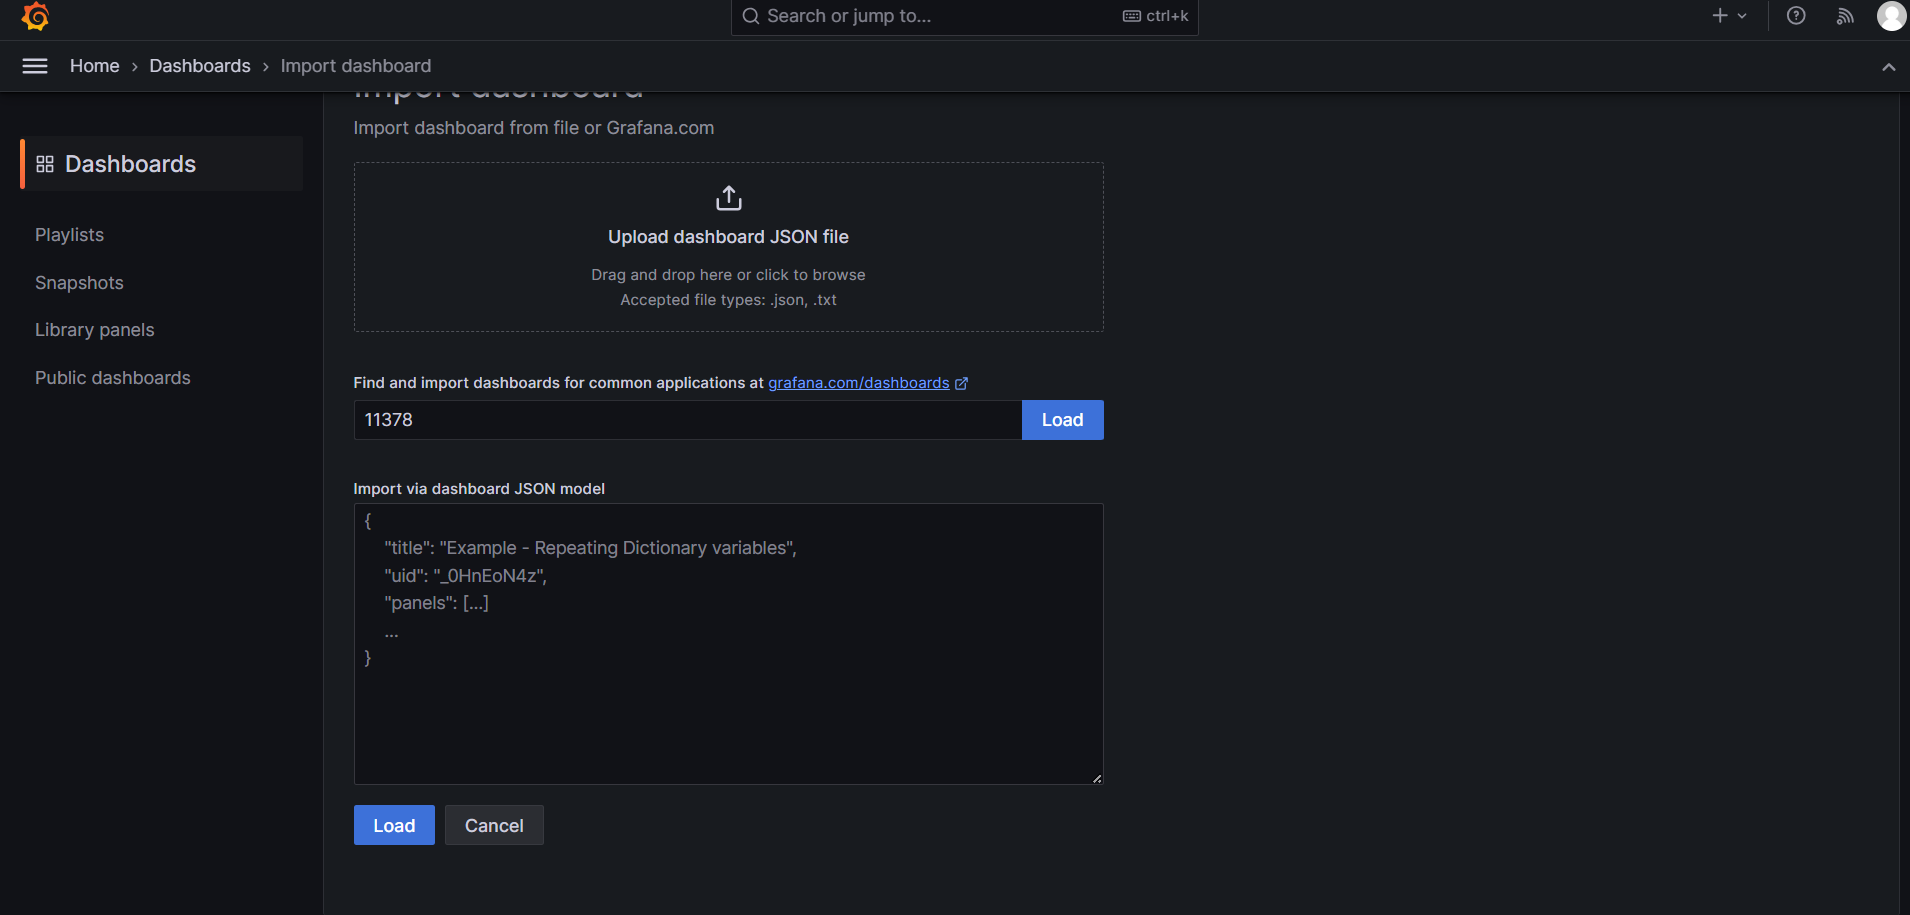
Now, import a dashboard or create your own to visualize the metrics.
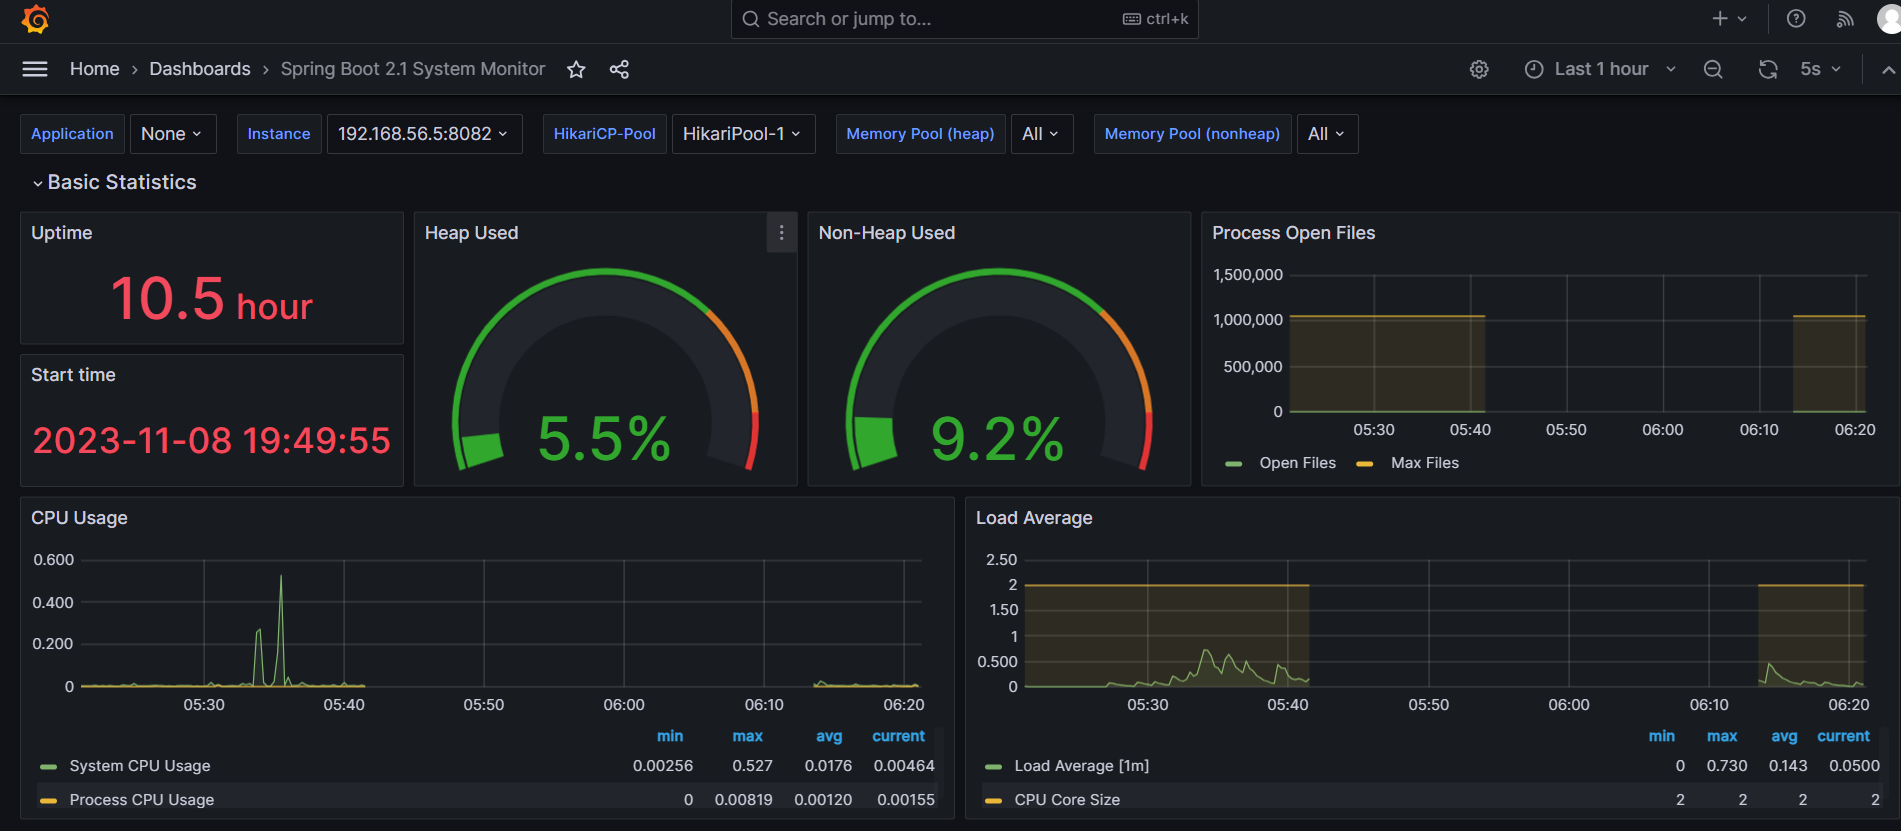
Conclusion: 🏁
In conclusion, the synergy between Prometheus, a highly scalable monitoring solution, and Grafana, a powerful visualization tool, creates a comprehensive monitoring solution tailored for Spring Boot applications. This amalgamation not only enables precise tracking of application health but also facilitates efficient troubleshooting and trend identification. By harnessing the strengths of Prometheus and Grafana, you establish a robust foundation for proactive management and optimization of your Spring Boot environment.
Subscribe to my newsletter
Read articles from Amal Ennajar directly inside your inbox. Subscribe to the newsletter, and don't miss out.
Written by
