Unveiling the Power of AWS CloudWatch Metrics: A Deep Dive into Cloud Monitoring
 Sumit Mondal
Introduction:
In the vast landscape of cloud computing, efficient monitoring is the backbone of successful operations. Amazon Web Services (AWS), a pioneer in cloud technology, offers a robust solution for monitoring and managing your cloud resources through a service called AWS CloudWatch. In this blog post, we'll embark on a journey into the heart of AWS CloudWatch Metrics, exploring its features, benefits, and practical examples that showcase its prowess.
Understanding AWS CloudWatch Metrics:
AWS CloudWatch Metrics provide a comprehensive view of the performance, utilization, and operational health of your AWS resources. These metrics are essentially time-ordered data points that represent different aspects of your system. AWS CloudWatch collects data in the form of metrics from various AWS services, making it a one-stop-shop for monitoring and analyzing your entire cloud infrastructure.
Key Features of AWS CloudWatch Metrics:
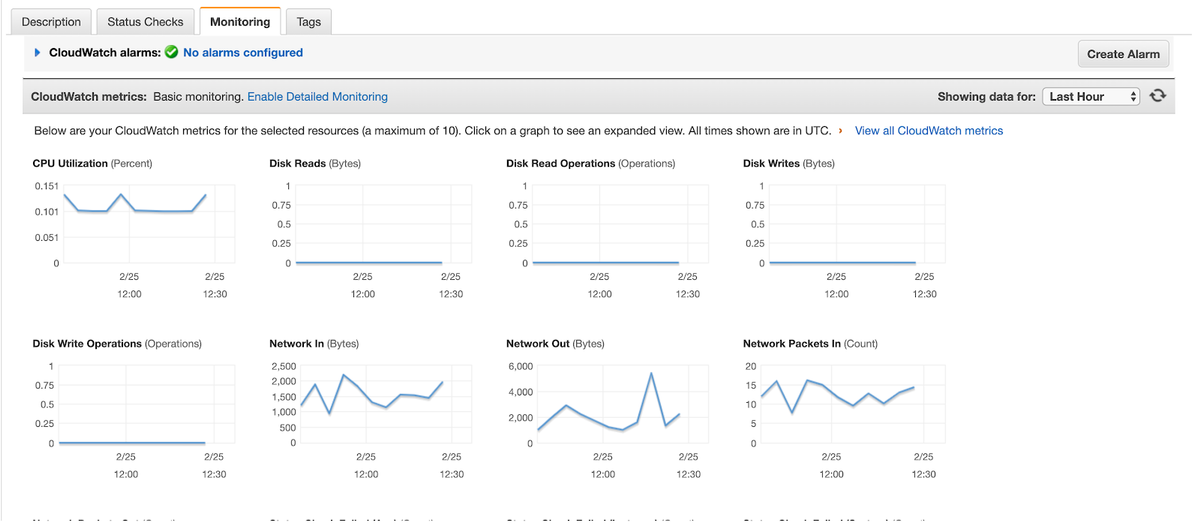
Unified Dashboard: AWS CloudWatch Metrics offer a unified dashboard where you can visualize and comprehend the performance metrics of your AWS resources. This centralized view simplifies the monitoring process, allowing you to quickly identify and respond to potential issues.
Example: AWS CloudWatch Metrics Dashboard
Custom Metrics: Beyond the default metrics provided by AWS services, CloudWatch allows you to create custom metrics tailored to your specific needs. This flexibility ensures that you can monitor and analyze the aspects of your application or infrastructure that matter most to you.
 # Example: Publish a custom metric using AWS CLI
 aws cloudwatch put-metric-data --namespace MyNamespace --metric-name MyMetric --value 42
Alarms and Notifications: CloudWatch Metrics enable you to set alarms based on threshold values. When a metric breaches a defined threshold, CloudWatch can trigger automated actions or send notifications, ensuring that you are proactively alerted to potential issues before they impact your users.
Example: Setting up an Alarm in AWS CloudWatch
Historical Data Analysis: AWS CloudWatch Metrics retain historical data, allowing you to analyze trends and patterns over time. This capability is crucial for capacity planning, performance optimization, and troubleshooting.
 # Example: Retrieve and analyze historical data using AWS CLI
 aws cloudwatch get-metric-statistics --namespace AWS/EC2 --metric-name CPUUtilization --start-time 2023-01-01T00:00:00Z --end-time 2023-01-10T00:00:00Z --period 3600 --statistics Average --dimensions Name=InstanceId,Value=i-0123456789abcdef0
Real-World Examples:
Let's delve into a couple of real-world examples to illustrate how AWS CloudWatch Metrics can be applied in practice.
Example 1: Auto-scaling with CloudWatch Metrics
Consider an auto-scaling group that dynamically adjusts the number of instances based on traffic. By monitoring metrics such as CPU utilization, you can set up CloudWatch Alarms to trigger auto-scaling actions. If the CPU utilization surpasses a certain threshold, CloudWatch can automatically add more instances to handle the increased load.
Example 2: Cost Optimization through Resource Utilization
CloudWatch Metrics help you optimize costs by providing insights into resource utilization. By analyzing metrics like network throughput, storage usage, and request rates, you can identify underutilized resources and make informed decisions about resizing or decommissioning them, thereby optimizing your infrastructure costs.
Conclusion:
In conclusion, AWS CloudWatch Metrics empower cloud practitioners with a comprehensive set of tools to monitor, analyze, and optimize their AWS resources. From the unified dashboard to custom metrics and automated alarms, CloudWatch Metrics offer a holistic approach to cloud monitoring. By leveraging real-world examples, we've demonstrated how CloudWatch Metrics can be a game-changer in ensuring the performance, reliability, and cost-effectiveness of your cloud infrastructure.
In the ever-evolving landscape of cloud computing, AWS CloudWatch Metrics stand as a beacon, guiding organizations towards a more resilient and efficient cloud journey. As you embark on your cloud monitoring endeavors, harness the power of CloudWatch Metrics to unlock the full potential of your AWS resources.
Subscribe to my newsletter
Read articles from Sumit Mondal directly inside your inbox. Subscribe to the newsletter, and don't miss out.
Written by

Sumit Mondal
Sumit Mondal
Hello Hashnode Community! I'm Sumit Mondal, your friendly neighborhood DevOps Engineer on a mission to elevate the world of software development and operations! Join me on Hashnode, and let's code, deploy, and innovate our way to success! Together, we'll shape the future of DevOps one commit at a time. #DevOps #Automation #ContinuousDelivery #HashnodeHero