Mastering the Foundations
 Azizadx

Overview
The goal of the Create Week0 10 Academy-organized Week 0 project is to teach the foundations of data engineering and machine learning. As they go through the Slack Messages Analysis challenge, participants will tackle a variety of Machine Learning (ML) Engineering issues, including as data extraction, purification, and visualization. 🚀 #CreateWeek010 #ML #DataEngineering
Embarking on a Slack Data Adventure
Embark on a Data Odyssey with 10xac/Slack-Data-Analysis-Template Solving Bugs, Pandas Magic, and Unleashing Insights! From Slack to JSON files, my trip begins with bug fixes, data loading into Pandas, and the definition of Data Cleansing.
I started working on the project by copying it to my workspace and fixing any syntax mistakes. My next step was to carefully examine the output format of the attached dataset by delving deeply into it. I looked closely at the root objects in the JSON, noting which ones were necessary for extraction and which ones needed to be eliminated to clean it up.
User Engagement Analysis
Identify top and bottom 10 users by reply counts, mentions, and message count. Explore user rankings for reaction count.
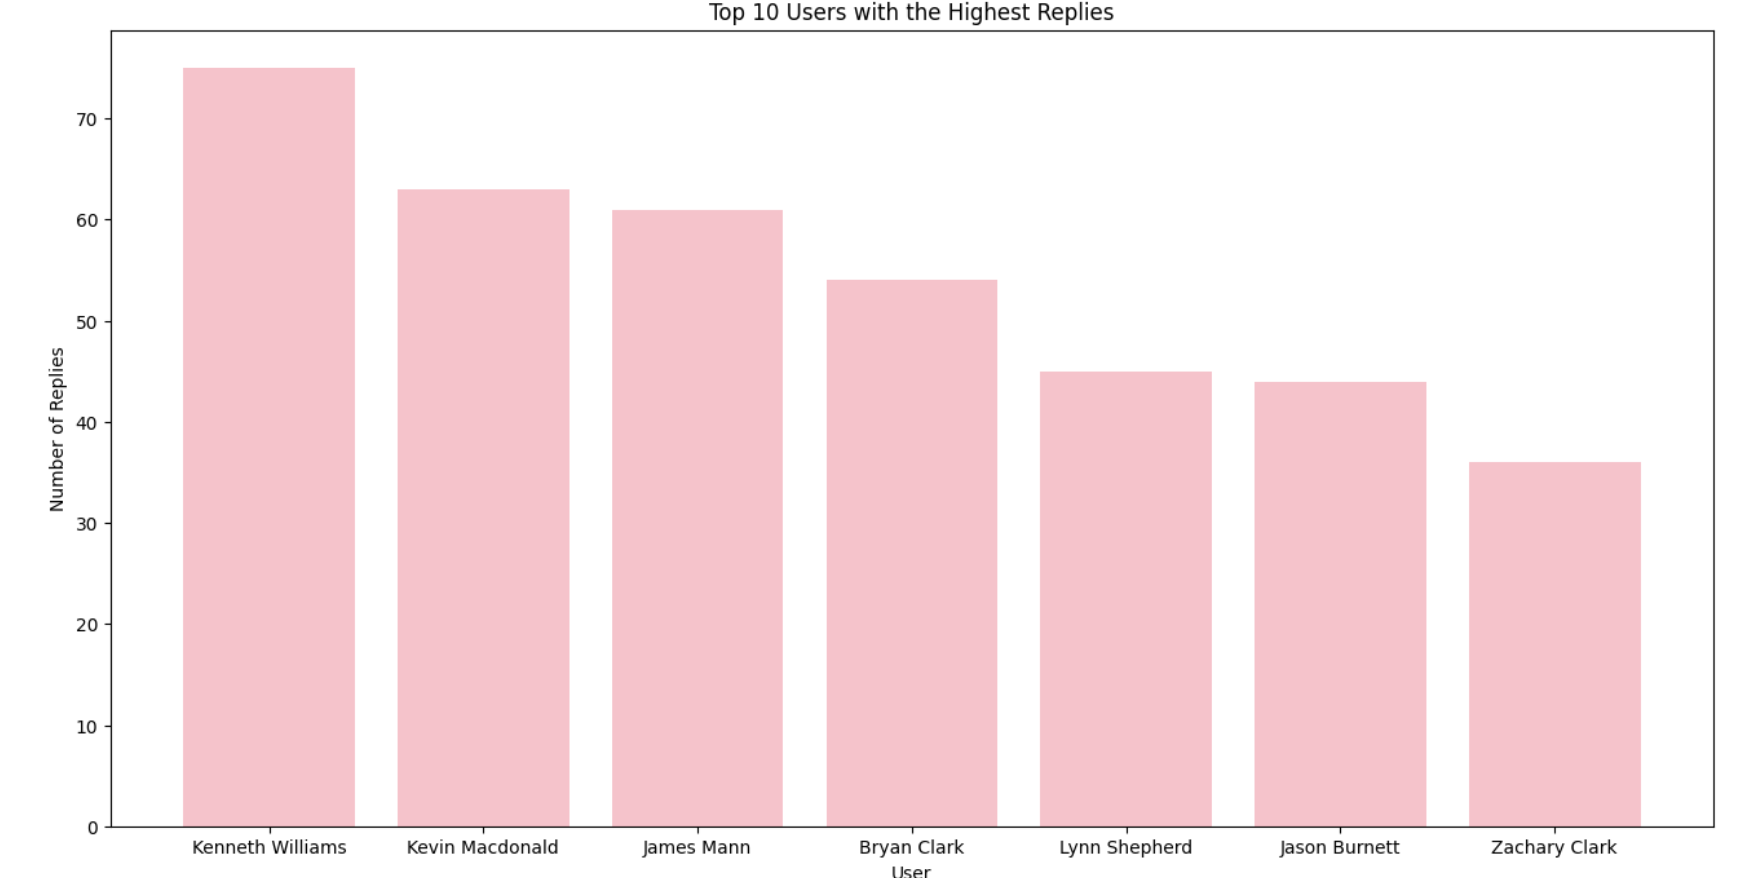
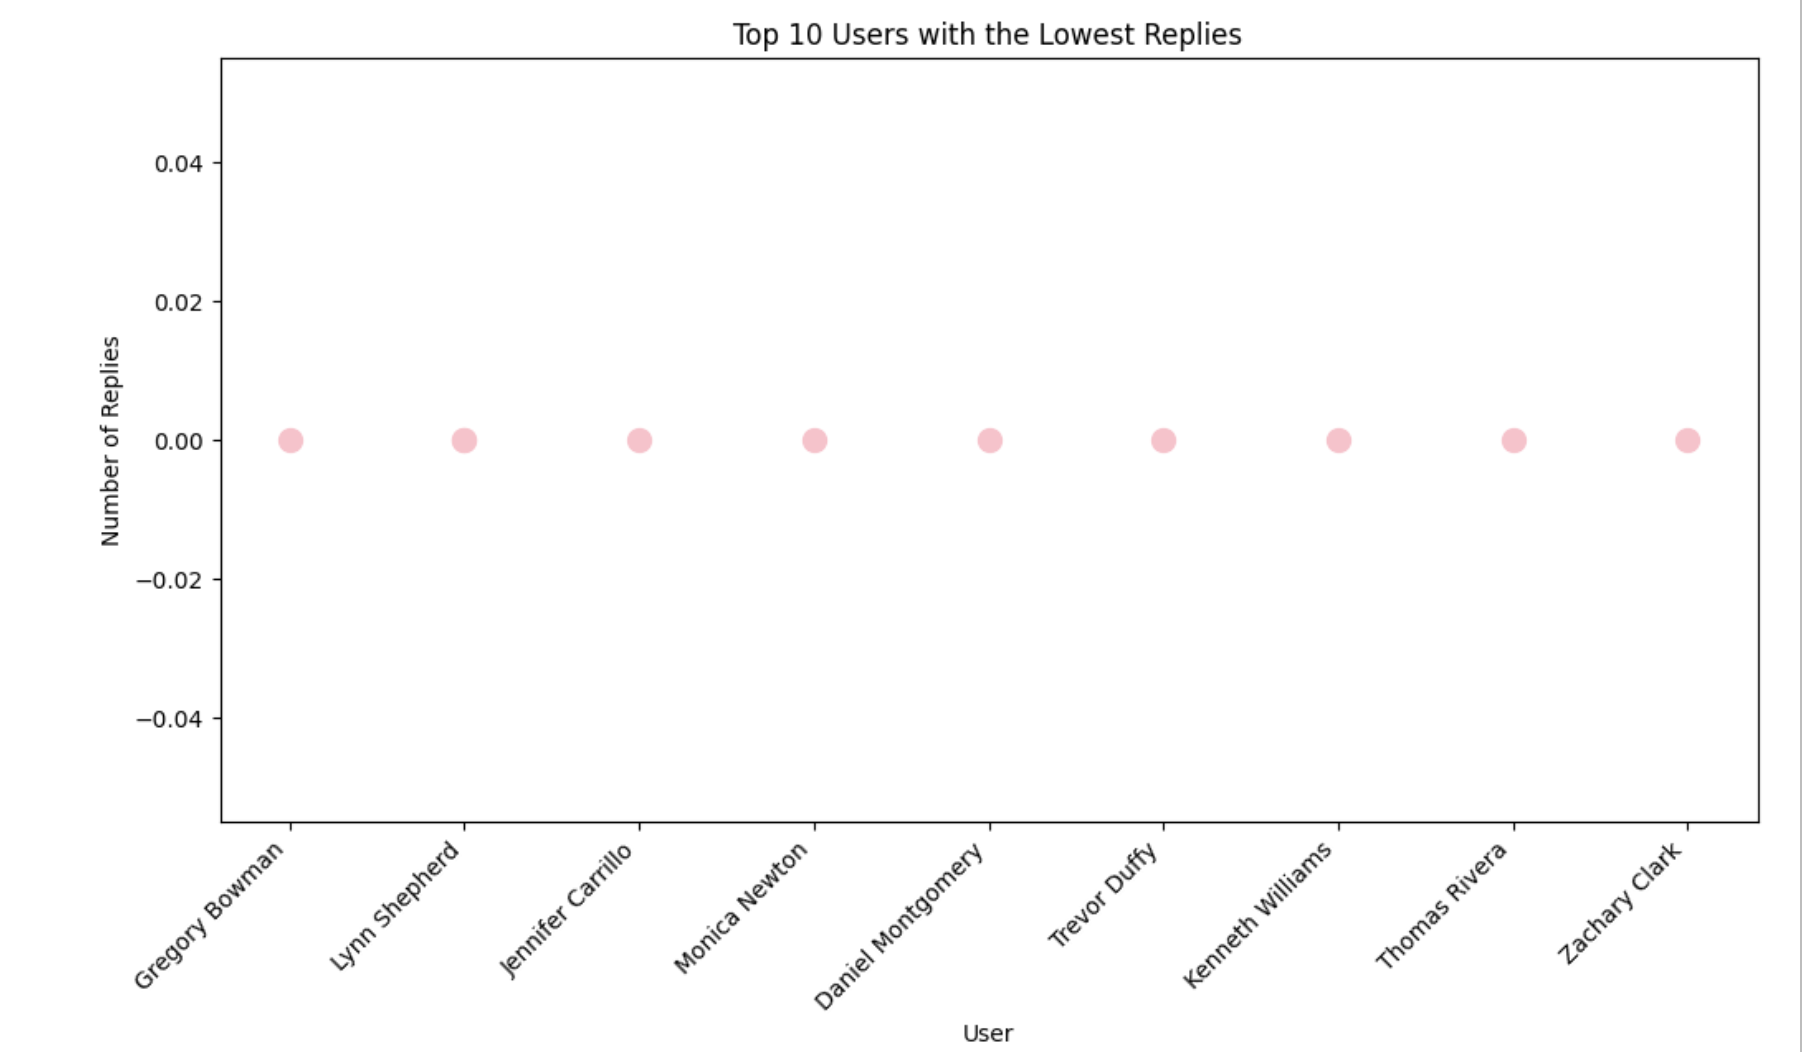
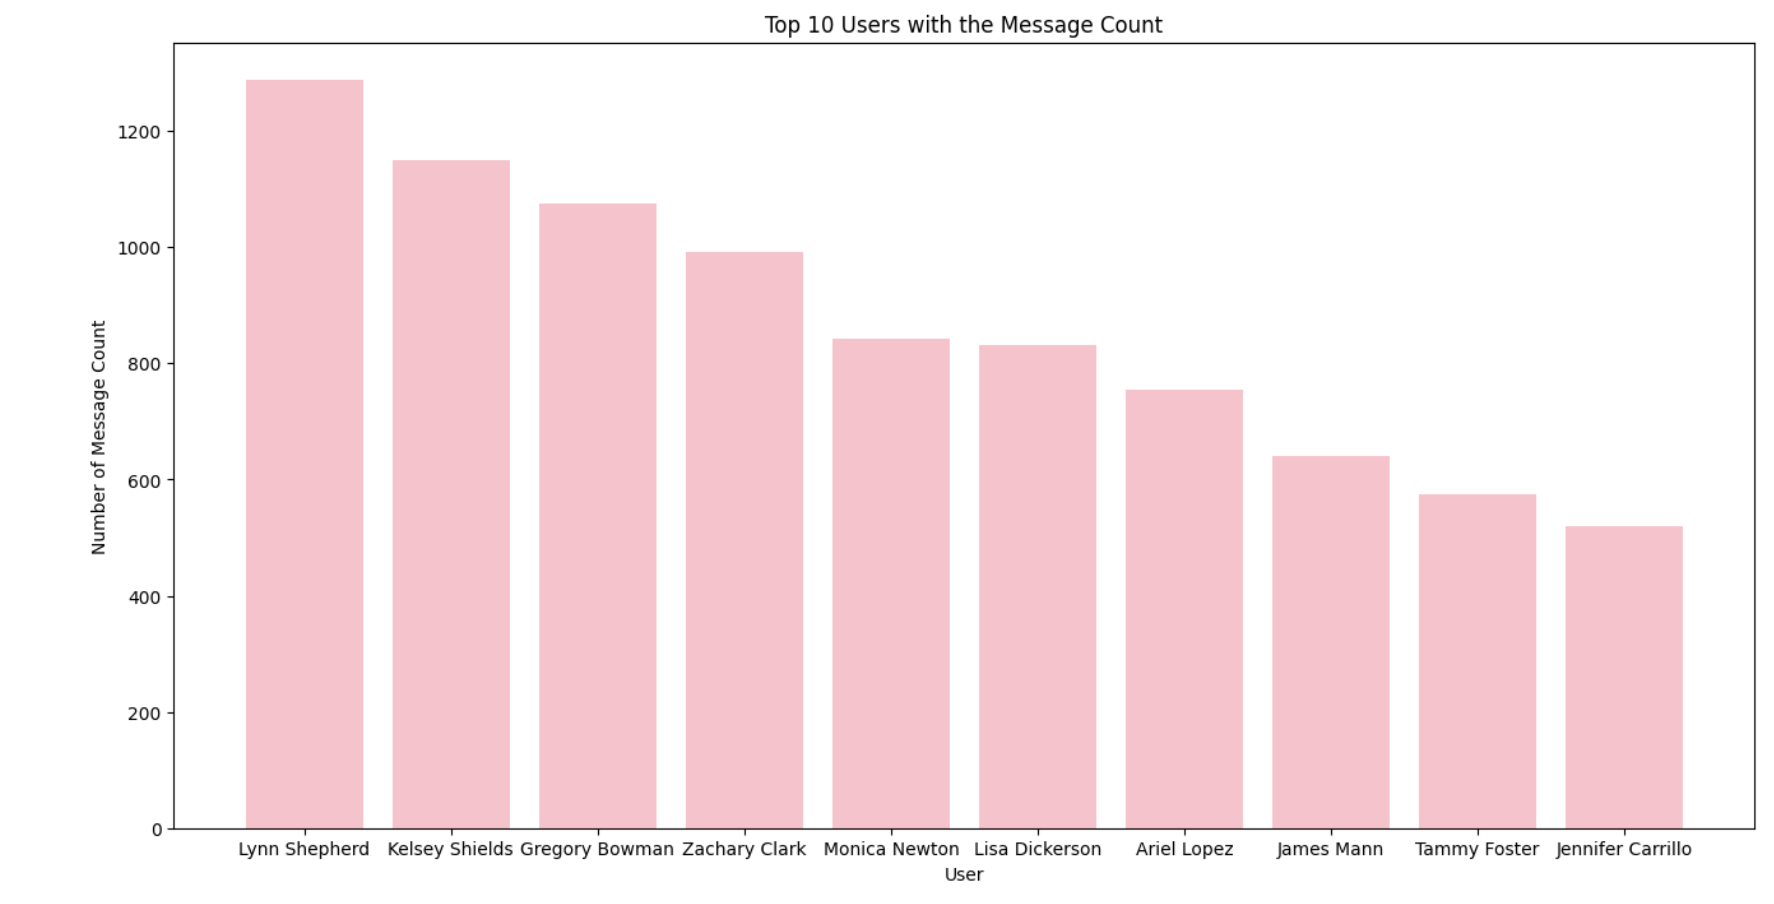
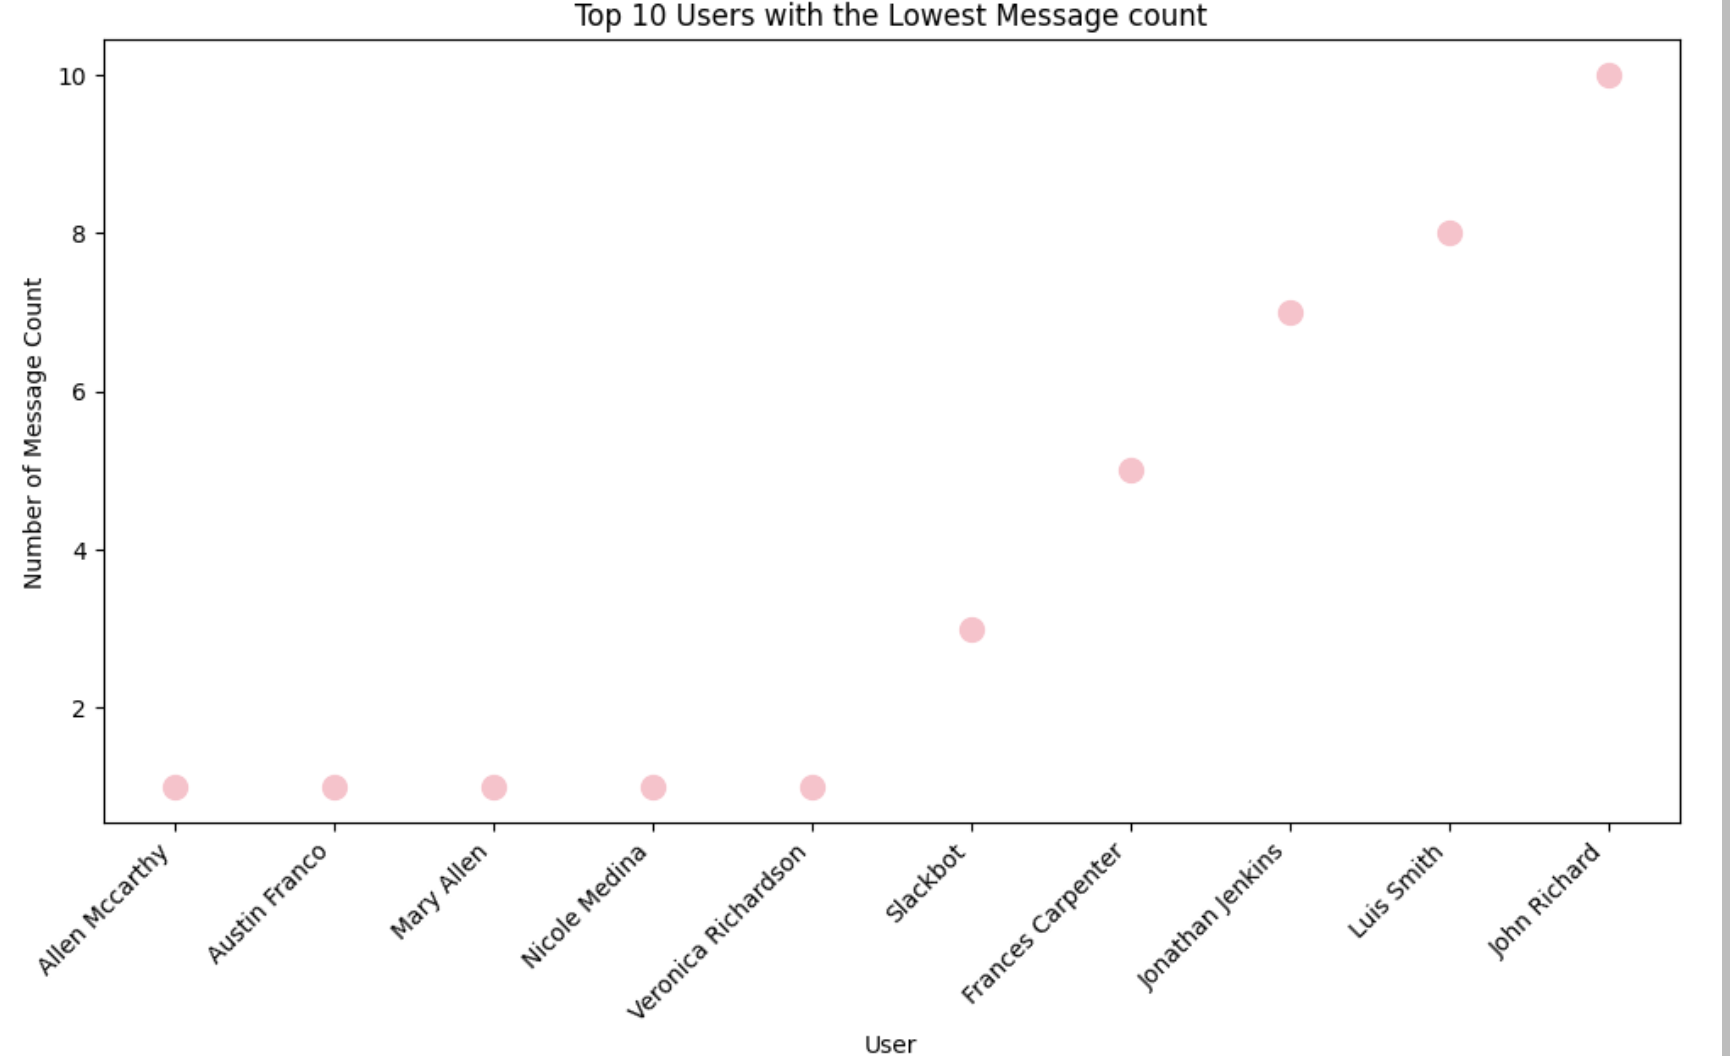
Visualization Based On Reply Counts And Message Counts
I've included four bar graphs that display the statistics for the top 10 and lowest 10 users with reply counts and Message counts, respectively.
plot visualization for top 10 users by reply count
plot visualization for bottom 10 users by reply count
plot visualization for top 10 users by message count
plot visualization for bottom 10 users by message count
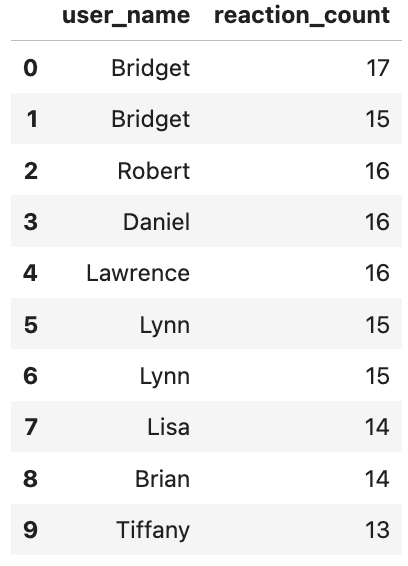
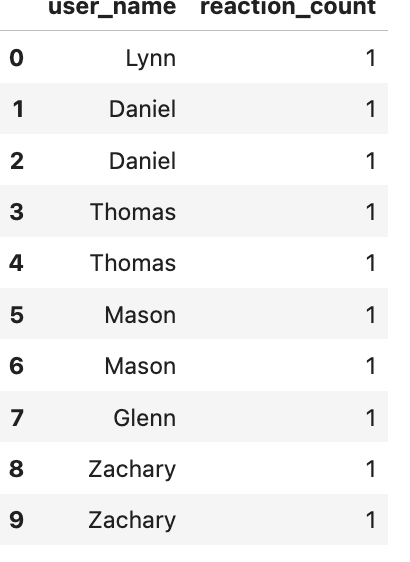
DataFrame Result Based on User rection
The dataframe data for the top 10 and bottom 10 users, together with the reaction count, is displayed below.
The top 10 users with rection count
The bottom 10 users with reaction count
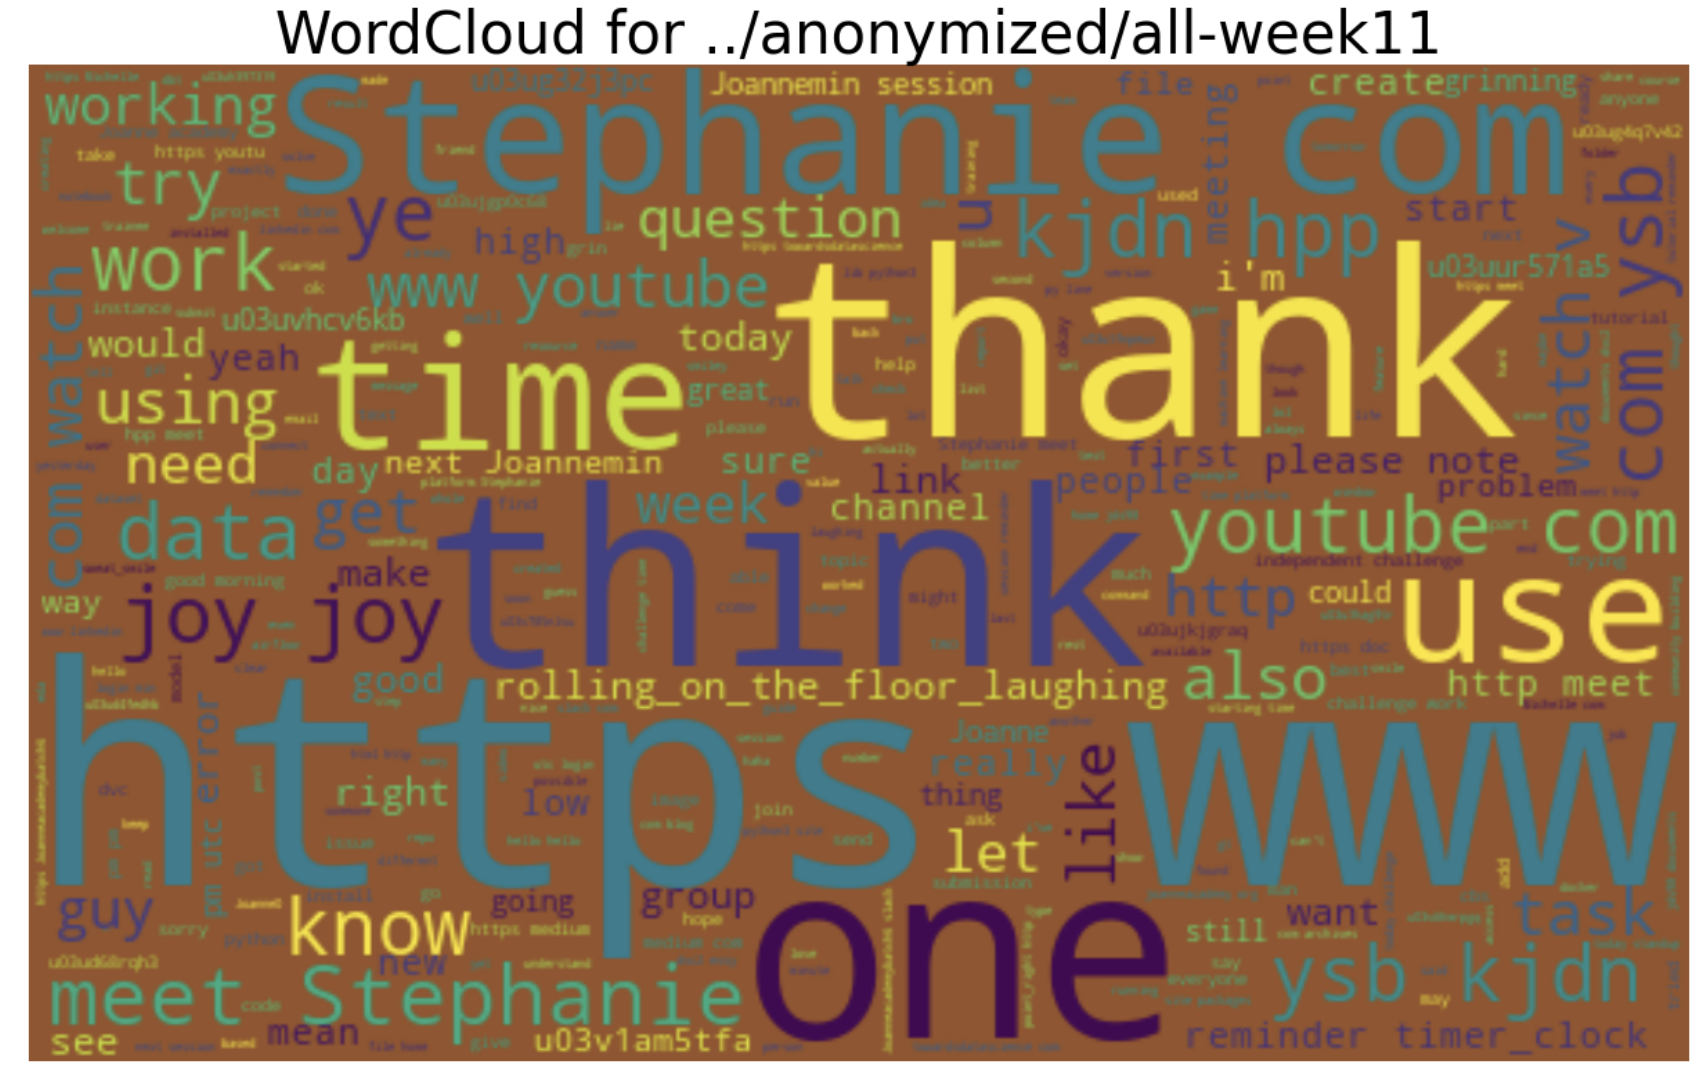
WordCloud for week11
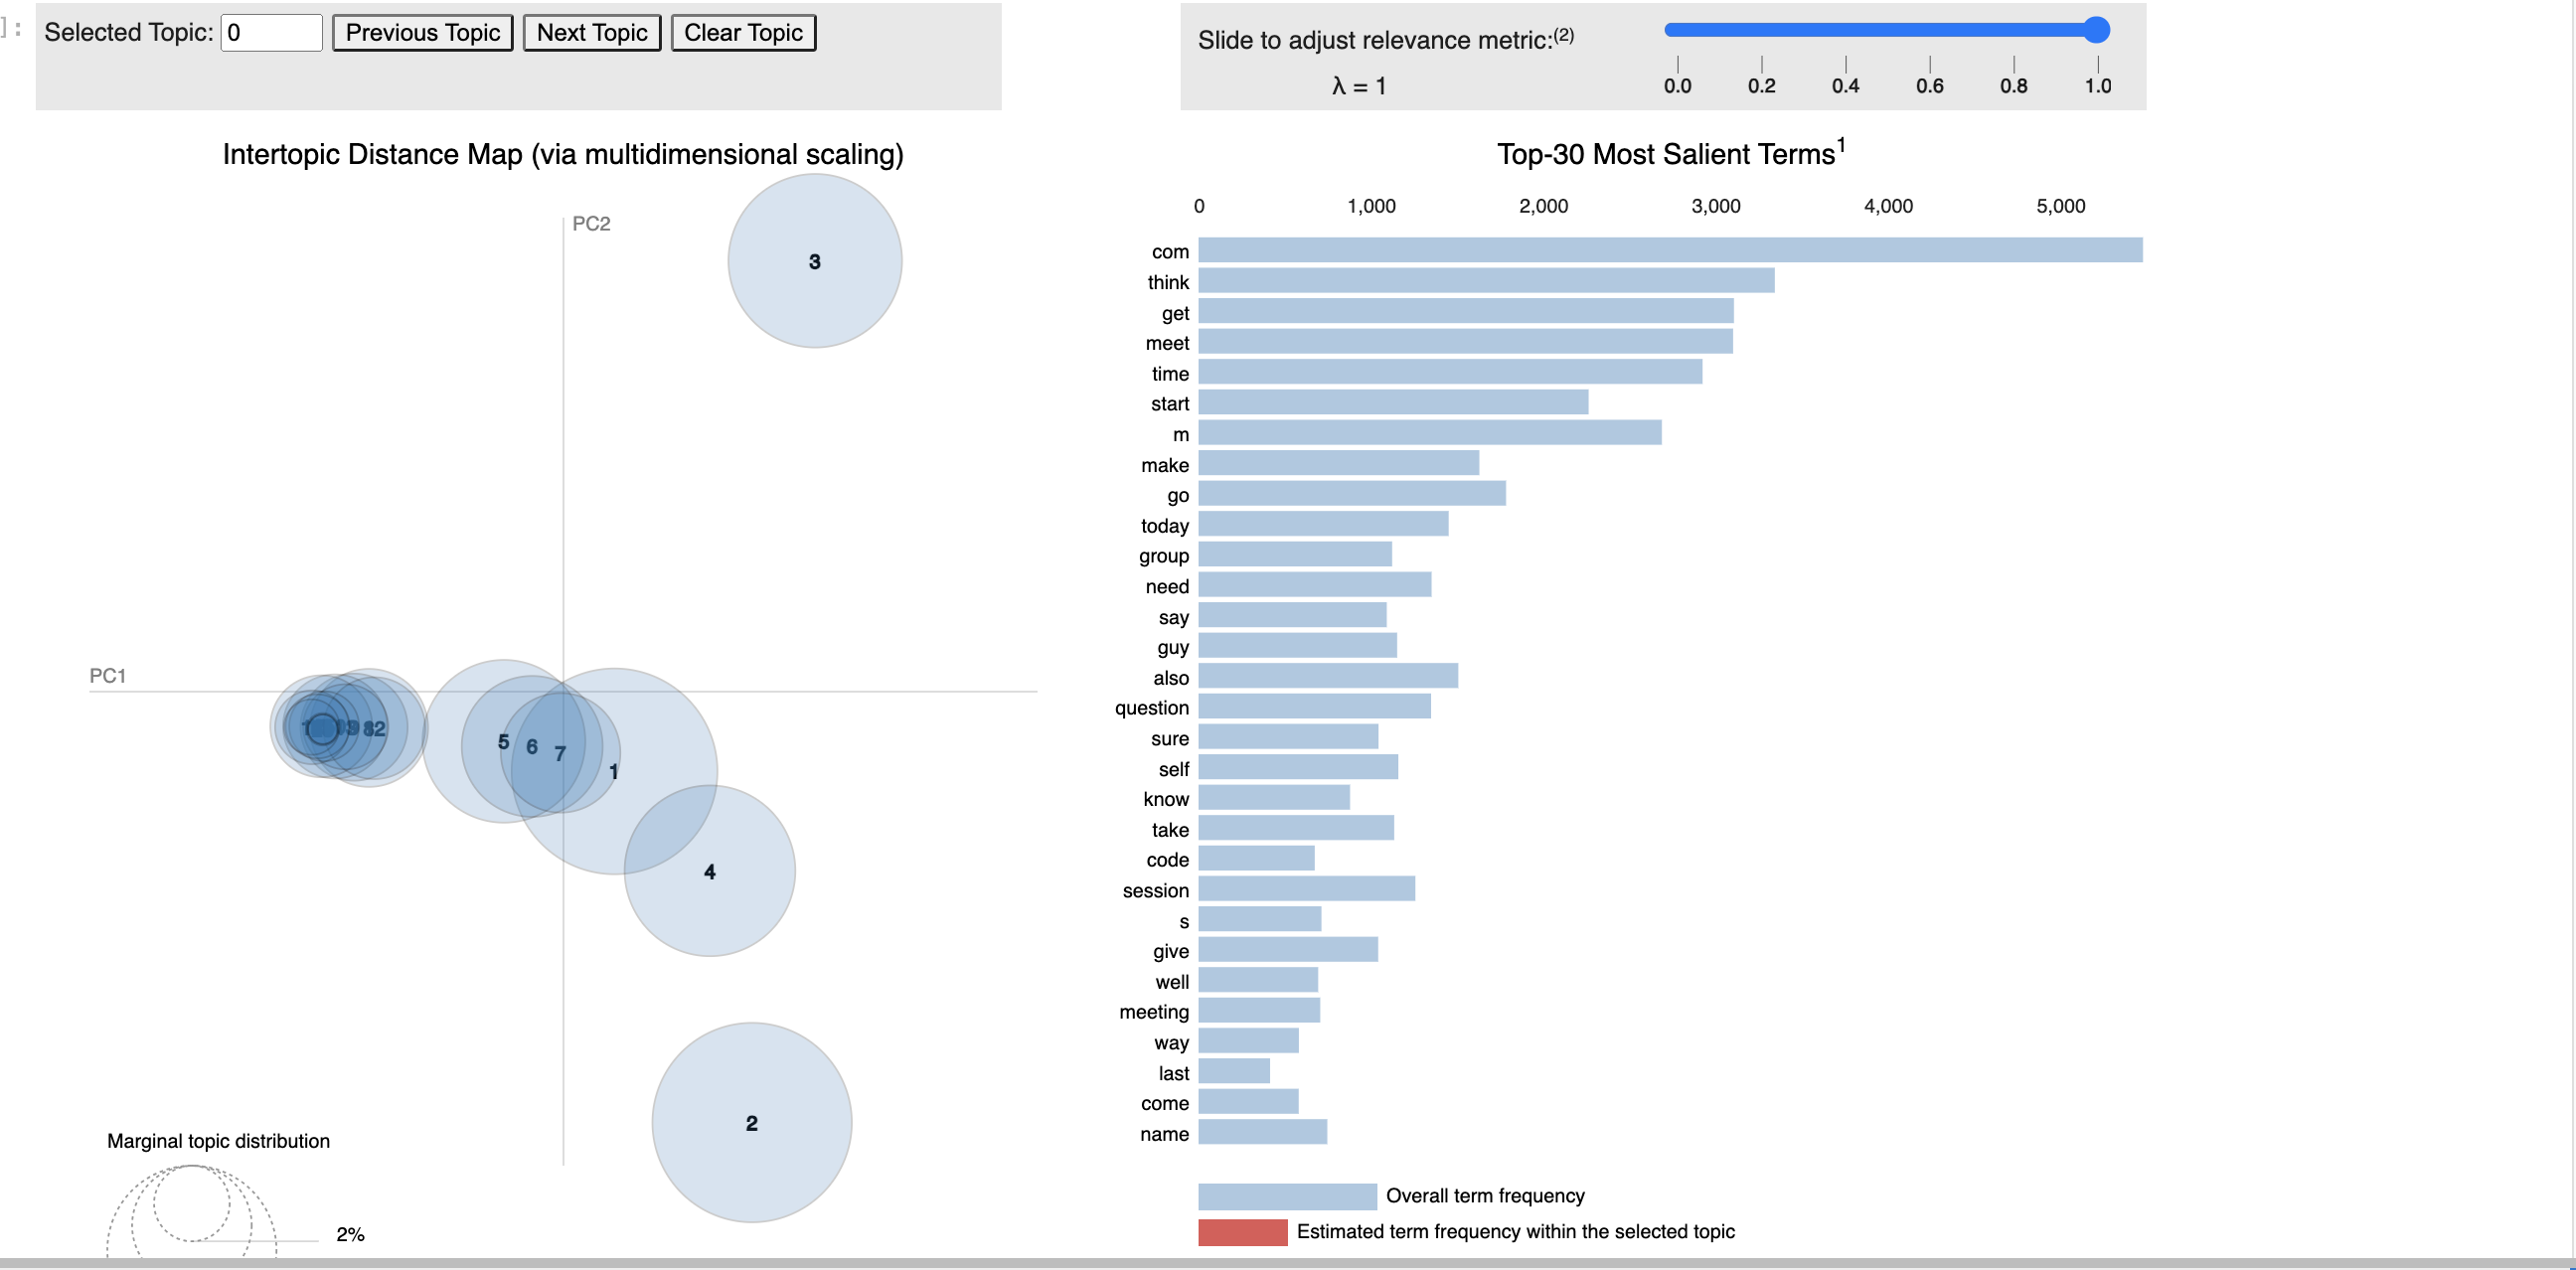
Topic Modeling
I was able to complete topic modeling and sentiment analysis in this section, which will categorize the subject into questions and answers. the following figure show sementical analysis:
In summary
Week 0 was an exciting voyage into the complexities of statistics. Every stage improved my abilities, from interactive notebooks to bug fixes. Fascinating insights were revealed by analyses of reaction times, channel dynamics, and user engagement. My visualization of the involvement and rhythm of time culminated in Temporal Patterns. I'm excited to interpret data stories and have gained new skills as I move on to the next step. Thrilled about the upcoming trials!
Contribution Welcomed!
Your contributions are the heartbeat of the open-source community, fostering a space to learn, inspire, and enhance. Every contribution you make is immensely valued. This version is complete, and I look forward to working on the next iteration next week. Stay tuned for the upcoming updates and improvements!
Fork the Project: here
Create your Feature Branch (git checkout -b feature/FeatureName)
Commit your Changes (git commit -m 'Add these features')
Push to the Branch (git push origin feature/FeatureName)
Open a Pull Request
Subscribe to my newsletter
Read articles from Azizadx directly inside your inbox. Subscribe to the newsletter, and don't miss out.
Written by

Azizadx
Azizadx
Learning