Marveling on Metrics & Observibility with TSDB
 Ayman Patel
Software engineers deal with 2 things. Code they write and metrics they monitor. Mostly we are ok or know what the code is and what it does. But from an observability point-of-view; we are winging it with our naive assumptions on the data that is emitted by our application. We don't even know how frequently our data is sampled, what a time-series database is, and what the querying engine used.
We just dump data into these without considering what the data represents. We also do not consider what to query. Do I query the average inherently wrong response time?
Time Series 101
So what is a time series anyway? Well from its Wikipedia definition
A time series is a series of data points indexed (or listed or graphed) in time order.
In the software world, it is the collection of observable metrics that are taken at a defined regular internal.
It is a kind of emitted event that has metadata info (usually added as Key-Value tags) with a timestamp
Example:
--event_name-|--------[tagKey:tagValue]----------------- |-value-|---timestamp------|
cpu_load_usage[location:us-east-one;application:web-sever]->75%->2023-02-02 00:00:00
Gotchas
Gotcha 1: Average and Standard Deviation Suck!
One thing we look at when we see a metric is average (and standard deviation). I have made the same mistake. Averages and standard deviation matter when they are part of normal distribution (which you see in statistics). However real-world metric data is anything but a normal distribution. Also, an outlier always skews your metric to either side, which is a different picture (either better-than-actual or worse-than-actual view for that metric).
Helpful alternatives are median, 50 or above percentiles (Median is p50 anyway!).
That is why it is imperative to use a TSDB. These gather various metrics in various formats while keeping in mind the need for aggregating and sampling of data which is required to gather the real-world picture of the software system that is deployed.
Gotcha 2: Cardinality is where $$$ is to be saved
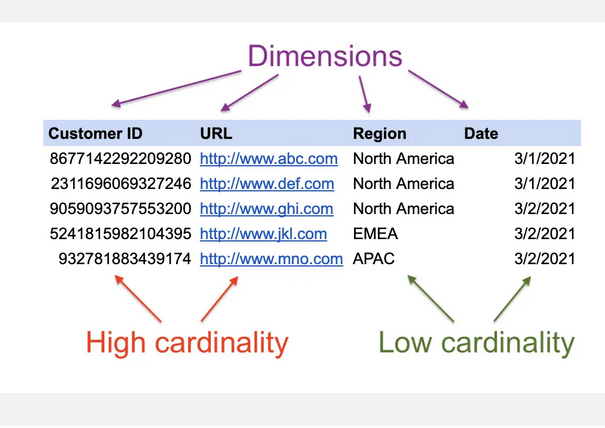
While you have a TSDB; it makes the development and product team inclined with an urge to custom tags/fields. Well, there ain't any free lunch in terms of storage cost and query execution time. Observability is both an art and science or which metric to measure. This talk gives a good framework for selecting the metrics. Metrics should be moved to buckets of heavily used, moderately used and least used along with cardinality data. Removing less used metrics with high cardinality (more unique, dissimilar rows)

So let the person who owns the Monitoring tool sleep with peace!

Tools
Graphite

Carbon
It is a daemon(aka background process) for handling how time-series data is handled before sending it to Graphite's TSDB (Whisper or Ceres).
There are 4 components of Carbon
- Carbon-relay
Use for replication and sharding of the data.
Grafana has its implementation of carbon-relay called carbon-relay-ng which is blazingly fast, built-in aggregator functionality such as cross-series & cross-time aggregations .etc. Read more on the Grafana doc site
- Carbon-aggregator
Used to aggregate metrics. Why aggregate? As too much data can lead to a lot of noise, performance degradation as well and storage costs; carbon-aggregator attempts to reduce the cardinality/granularity of data which ultimately leads to better I/O performance
- Carbon-cache
It takes data coming from the carbon-aggregator and dumps it to Whisper(or Ceres) for persistent storage. It also loads some of the data into RAM for faster access.
- Carbon-aggregator-cache
It is a combination of both Carbon-cache and Carbon-aggregator in order to reduce the resource utilization of running both as separate daemons.
Database and Data Storage
- Whisper
A fixed-size database which is similar to Round-Robin-database aka RRD
Unlike RDD, Whisper allows to backfill data which allows to import historical data. FOr more differences; read the doc
- StatsD
It is not a database per se, but it is commonly used as a data collector in Graphite to send additional information to the graphite instance. Information such as Gauges, Counters, Timing Summary Statistics, and Sets can be sent to Graphite.
- Query language
Graphite provides functions to query, manipulate, and transform data from the stored time series data.
List of functions (Exhaustive list here):
| Function | What | Example |
| absolute | Apply the mathematical absolute function | absolute(Server.instance01.threads.busy) |
| add | Add constant to the metric | add(Server.instance01.threads.busy, 10) |
| aggregate | Aggregate series using a given function (avg, sum, min, max, diff, stddev, count, range, last, multiply) | aggregate(host.cpu-[0-7].cpu-{user,system}.value, "sum") |
Data Ingestion
Graphite supports 3 data ingestion methods
Plaintext
Pickle
AMQP
| Method | Format | Usage | carbon.conf Reference |
| Plaintext | <metric path> <metric value> <metric timestamp> | Quick and trivial monitoring | |
| Pickle | [(path, (timestamp, value)), ...] | Allows multi-levbel tuples | DESTINATION_PROTOCOL and other PICKLE_RECIEVER_* |
| AMQP | Reliable data transfer via AMQP broker. | ENABLE_AMQP and other AMQP_* configs |
Data Model
There are 2 data formats for Graphite
- Simple Graphite message format
Example:
// Format
metric_path value timestamp\n

// Example
stats.api-server.tracks.post.500 -> 93 1455320690
- Graphite with Tag Support
A lot of TSDB such as Influx, Prometheus had tag support from the beginning, hence Graphite added Tag support in v1.1 to identify different time series data
Example:
// Format
my.series;tag1=value1;tag2=value2timestamp\n

// Example
cpu,cpu=cpu-total,dc=us-east-1,host=tars usage_idle=98.09,usage_user=0.89 1455320660004257758
=>
cpu.usage_user;cpu=cpu-total;dc=us-east-1;host=tars 0.89 1455320690
cpu.usage_idle;cpu=cpu-total;dc=us-east-1;host=tars 98.09 1455320690
InfluxDB

Database and Data Storage
For the storage engine, InfluxDB uses TSM tree (similar to a Log-structured merge tree) for storage along with a Write Ahead Log. LSM is used in Cassandra and HBase which has good read/write characteristics. InfluxDB takes the database approach, while Prometheus data storage is mostly append append-only approach similar to Kafka.
TODO: TSM explanation: IPAD thingy
WAL(similar to Postgres) is a log for ensuring data reliability due to some unexpected failure to the InfluxDB server.
Unlike Graphite and Prometheus which store on disk as a file, Influx DB stores data in their own relational-type storage engine which can be queried via InfluxDBQL or Flux(soon-to-be deprecated).
Query language
There are 2 ways to query (one of them is being deprecated)
-
SQL-like syntax queries which can be called by InfluxDB shell or InfluxDB API. Its functions are of various types such as aggregates, selectors, transformations, technical analysis
Supported SQL statements (who even knows all SQL keywords):
     DELETE*
     DROP MEASUREMENT*
     EXPLAIN ANALYZE
     SELECT (read-only)
     SHOW DATABASES
     SHOW SERIES
     SHOW MEASUREMENTS
     SHOW TAG KEYS
     SHOW FIELD KEYS
     SHOW SERIES EXACT CARDINALITY
     SHOW TAG KEY CARDINALITY
     SHOW FIELD KEY CARDINALITY
All InfluxDB functions can be found here
Flux (In maintenance mode from InfluxDB v3)
Flux is a human-readable, flexible query language that behaves for like a functional language than a query language such as SQL.
An example query is to filter CPU measurement for the last 1 hour for every 1-minute interval and calculate the mean for every window.
   from(bucket:"telegraf/autogen")
     |> range(start:-1h)
     |> filter(fn:(r) =>
       r._measurement == "cpu" and
       r.cpu == "cpu-total"
     )
     |> aggregateWindow(every: 1m, fn: mean)
Prometheus

Database and Data Storage
Unlike graphite originally, Prometheus stores in the following format with tags.
api_server_http_requests_total{method="POST",handler="/tracks",status="500",instance="<sample1>"} -> 34
api_server_http_requests_total{method="POST",handler="/tracks",status="500",instance="<sample2>"} -> 28
api_server_http_requests_total{method="POST",handler="/tracks",status="500",instance="<sample3>"} -> 31
Prometheus stores its data in the following format:
./data
├── 01BKGV7JBM69T2G1BGBGM6KB12
│   └── meta.json
├── 01BKGTZQ1SYQJTR4PB43C8PD98
│   ├── chunks
│   │   └── 000001
│   ├── tombstones
│   ├── index
│   └── meta.json
├── 01BKGTZQ1HHWHV8FBJXW1Y3W0K
│   └── meta.json
├── 01BKGV7JC0RY8A6MACW02A2PJD
│   ├── chunks
│   │   └── 000001
│   ├── tombstones
│   ├── index
│   └── meta.json
├── chunks_head
│   └── 000001
└── wal
    ├── 000000002
    └── checkpoint.00000001
        └── 00000000
Data is backed in a WAL (just like in InfluxDB). As it is an append-only log; it leads to compaction every 2 hours for saving space.
Query language
PromptQL is similar to a functional approach (Like InfluxDB's Flux); with various functions for selectors, functions, operators
PromptQL can also be used inside InfluxDB via Flux. But Flux not being supported in newer versions might lead to the risk of invalid PromptQL queries in the future.
Influx DB vs Prometheus
Scaling
As InfluxDB has a separate storage engine, it is horizontally scalable and decoupled from its storage engine (TSM). While Prometheus follows file-based data persistence, it is vertically scalable or via having a master Prometheus server that can pull data from Slave Prometheus servers.
Push(Influx DB) vs Pull (Prometheus)
Even though InfluxDB and Prometheus are useful tools in observing; their approach to gathering data is the opposite.
InfluxDB uses a push model, wherein the source of data can be pushed to InfluxDB. Prometheus on the other hand uses a pull mechanism that can pull various sources including InfluxDB, Mongo, Postgres etc. InfluxDB can also pull from various sources; albeit not natively. You can use Telegraf for this purpose.
Use Prometheus when:
Want a powerful querying language
High Availability for uptime of your monitoring platform
Pulling from various sources natively.
Use InfluxDB when:
Scale horizontally with separate database nodes (given you are OK with the Eventual consistency that comes when you do horizontal scaling)
Long-term data storage
High cardinality(higher number of tags) requirement for metrics.
Prometheus is a very powerful tool, but it is neither here nor there. It is a great aggregation tool and should be looked at as a TSDB. A great resource on this though can be found here by Ivan Velichko
Subscribe to my newsletter
Read articles from Ayman Patel directly inside your inbox. Subscribe to the newsletter, and don't miss out.
Written by

Ayman Patel
Ayman Patel
Developer who sees beyond the hype