Understanding Sample Size and Its Impact on Population Estimates
 Riya PC
Authors: Ardra K S , Jofin James Siby , Gokul Manoj , Riya PC
Introduction
This study delves into the correlation between sample size and its impact on key statistical measures, such as variance, standard error, and precision. While a population encompasses the entire set of subjects or items under examination, analyzing the entire population can be impractical. Therefore, we often turn to a representative subset, known as a sample, for analysis. Understanding how sample size influences statistical measures is vital for assessing the accuracy and reliability of population estimates derived from the sample.
The goal is to evaluate how changes in sample size impact the precision of estimates concerning population mean, providing valuable insights into the relationship between sample size and population estimates.
Data and Methods
Data and Data Preprocessing:
This study utilizes monthly rainfall data spanning from 1901 to 2015 for 36 meteorological subdivisions in India. The data, collected by the India Meteorological Department (IMD), combines manual observations from weather stations and automatic sensor measurements. Monthly rainfall values from various locations within each sub-division were averaged, yielding a single monthly rainfall value per sub-division. Annual rainfall values were then calculated for each sub-division and year based on the monthly data.
Method:
The investigation into the influence of sample size on population variance and standard error was conducted using the R programming language. The process involved:
1. Sampling: Creating random samples of various sizes from the complete rainfall dataset.
2. Variance and Standard Error Calculation: For each sample size, computing the variance and standard error of the sample mean rainfall.
3. Analysis: Examining the relationship between sample size, variance, and standard error to comprehend how sample size impacts the spread and accuracy of estimates for the population mean rainfall.
Results and Discussion
The focus of our analysis among the 18 variables, which encompass district names and precipitation data for various months, is the annual precipitation. We aim to explore the sample size and its influence on population estimates. The mean annual rainfall for the entire population is 1346.97, with variance of 703717.8 and standard deviation of 838.88. To gain insights into the distribution of annual rainfall, we employed a histogram.
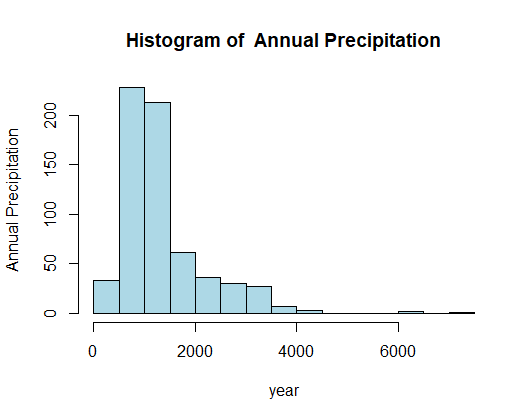
In order to check how much a random sample can resemble the true population we chose random samples of different sizes and see how the mean, variance and standard deviation along the histogram curve is changing.
SAMPLE 1
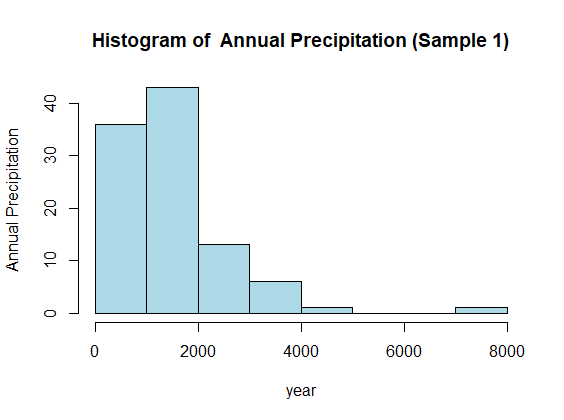
When the sample size is set to be 100, the mean is found to be 1462.7 with variance 1012035 and the standard deviation 1006. The histogram gives:
SAMPLE 2
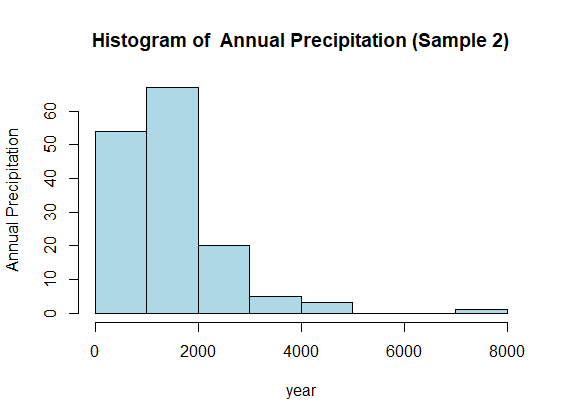
Similarly , when sample size is set to be 150, the mean is found to be 1427.4 with variance 824696.9 and the standard deviation 908.13. The histogram gives:
SAMPLE 3
When sample size is set to be 200, the mean is found to be 1404.8 with variance 627995.3 and the standard deviation 792.4616. The plot is:
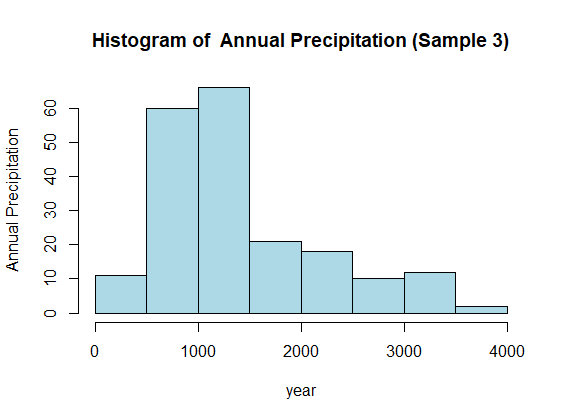
From the above histograms we can observe that as the sample size increases the curves tend to be more bell shaped which is as a result of central limit theorem. Additionally, the mean, variance and standard deviation also tends to be closer to the true population mean, variance and standard deviation.
To get a more precise conclusion we use sampling distribution so that we can take as many random samples as we need. Here we use a replicate function and get 1000 such random samples to see how it represents the true population.
SAMPLING DISTRIBUTION 1
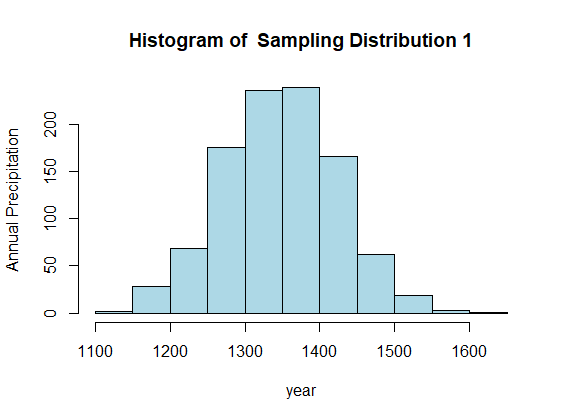
When the sample size was set to 100 and replicated 1000 times we got the mean as 1347.83, variance as 5940.19 and standard error as 77.07. When it is plotted as histogram:
SAMPLING DISTRIBUTION 2
Similarly, when the sample size was set to 150 and replicated 1000 times we got the mean as 1347.91, variance as 3788.17 and standard error as 61.55.
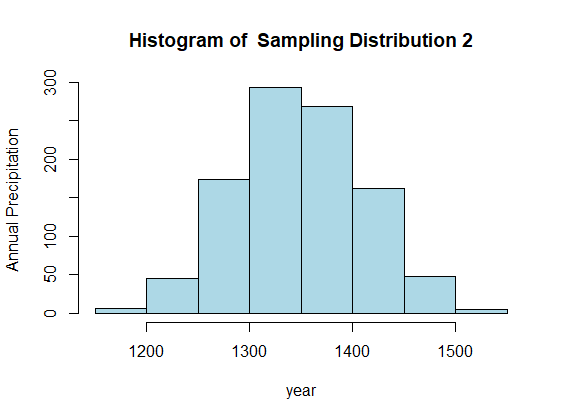
As observed in the preceding graphs, it exhibits a bell-shaped curve indicative of a normal distribution. Moreover, the mean value exhibited a significant reduction and accurately reflected the population mean. Notably, the standard error decreased as the sample size was increased.
Conclusion
In short, as sample sizes increased, the histograms exhibited a more bell-shaped curve, aligning with the central limit theorem. The mean, variance, and standard deviation also approached closer to the true population values. Further precision was achieved through a sampling distribution, replicating random samples. The resulting histograms demonstrated a reduction in standard error with increasing sample size, indicating improved representation of the population. This underscores the reliability of our analysis and the influence of sample size on the accuracy of population estimates.
Subscribe to my newsletter
Read articles from Riya PC directly inside your inbox. Subscribe to the newsletter, and don't miss out.
Written by
