REAL TIME MONITORING HANDS-ON : Prometheus and Grafana Dashboard on AWS EKS Cluster using Helm-Chart
 PRIYAM KUMAR SAHA
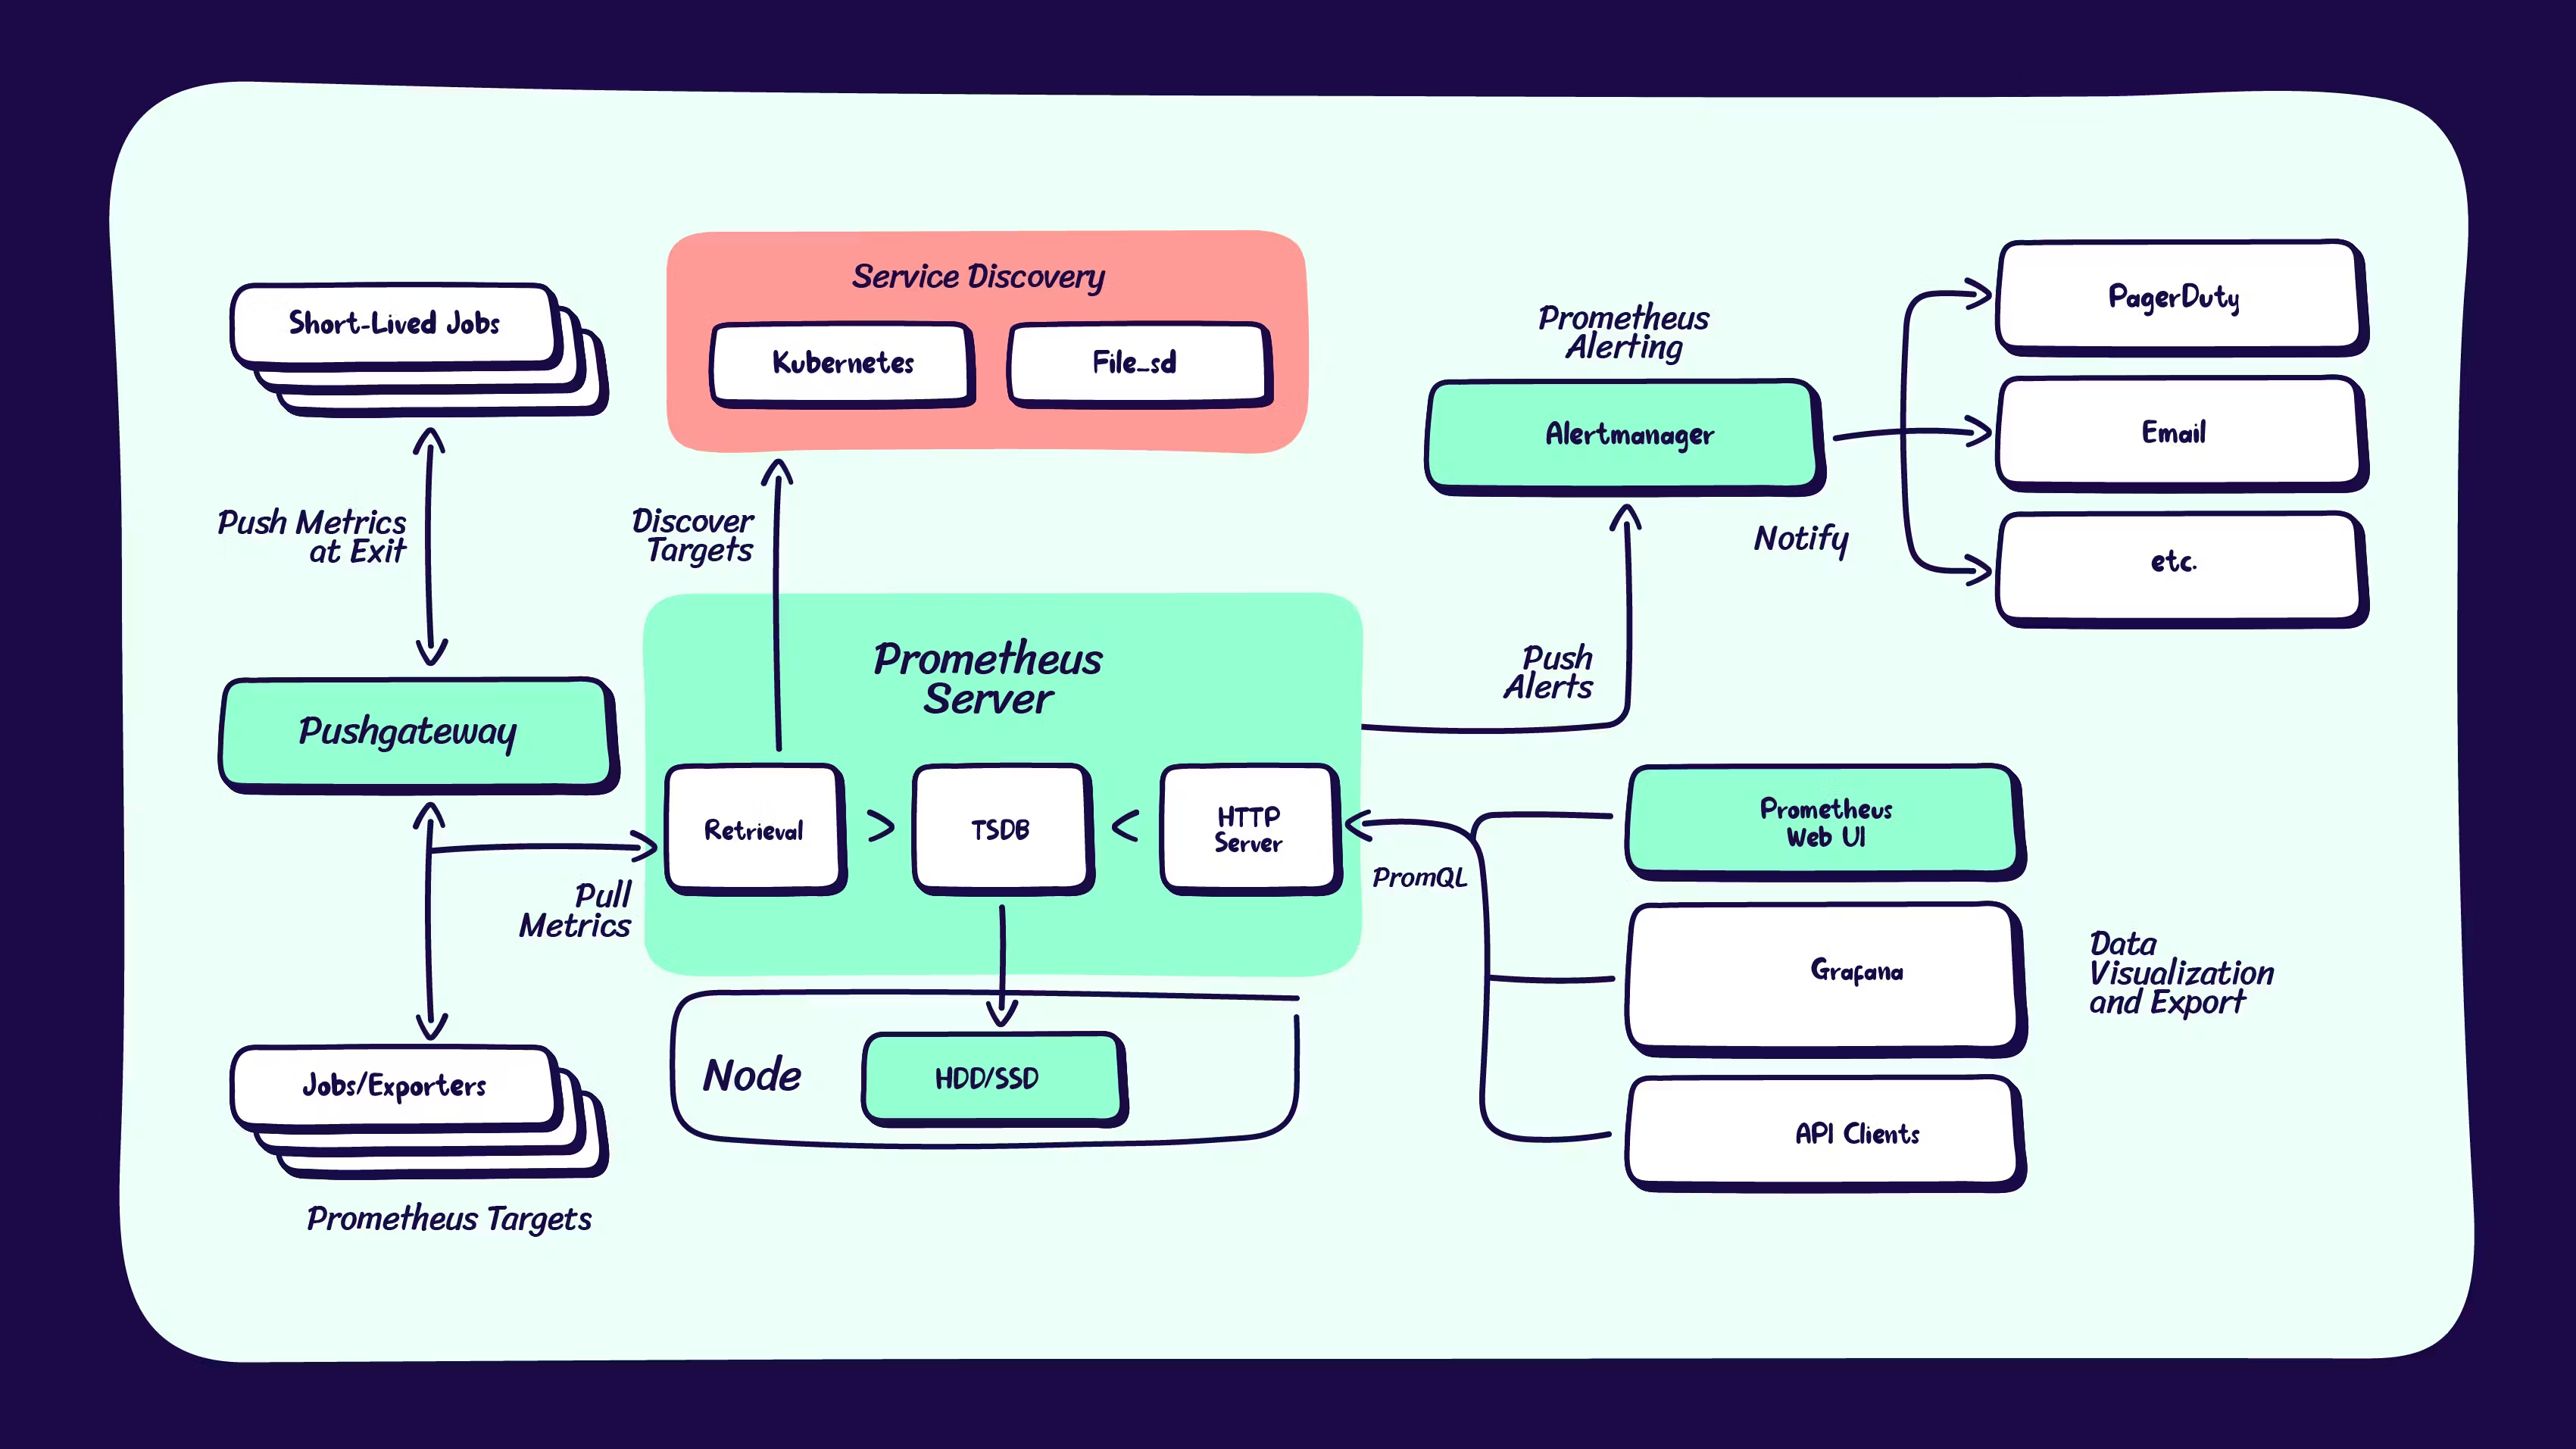
Setup EC2 Instance -
AMI - Ubuntu
Instance type - t2.medium
Inbound - all traffic
Storage - 30 GB of EBS General Purpose SSD (gp2)
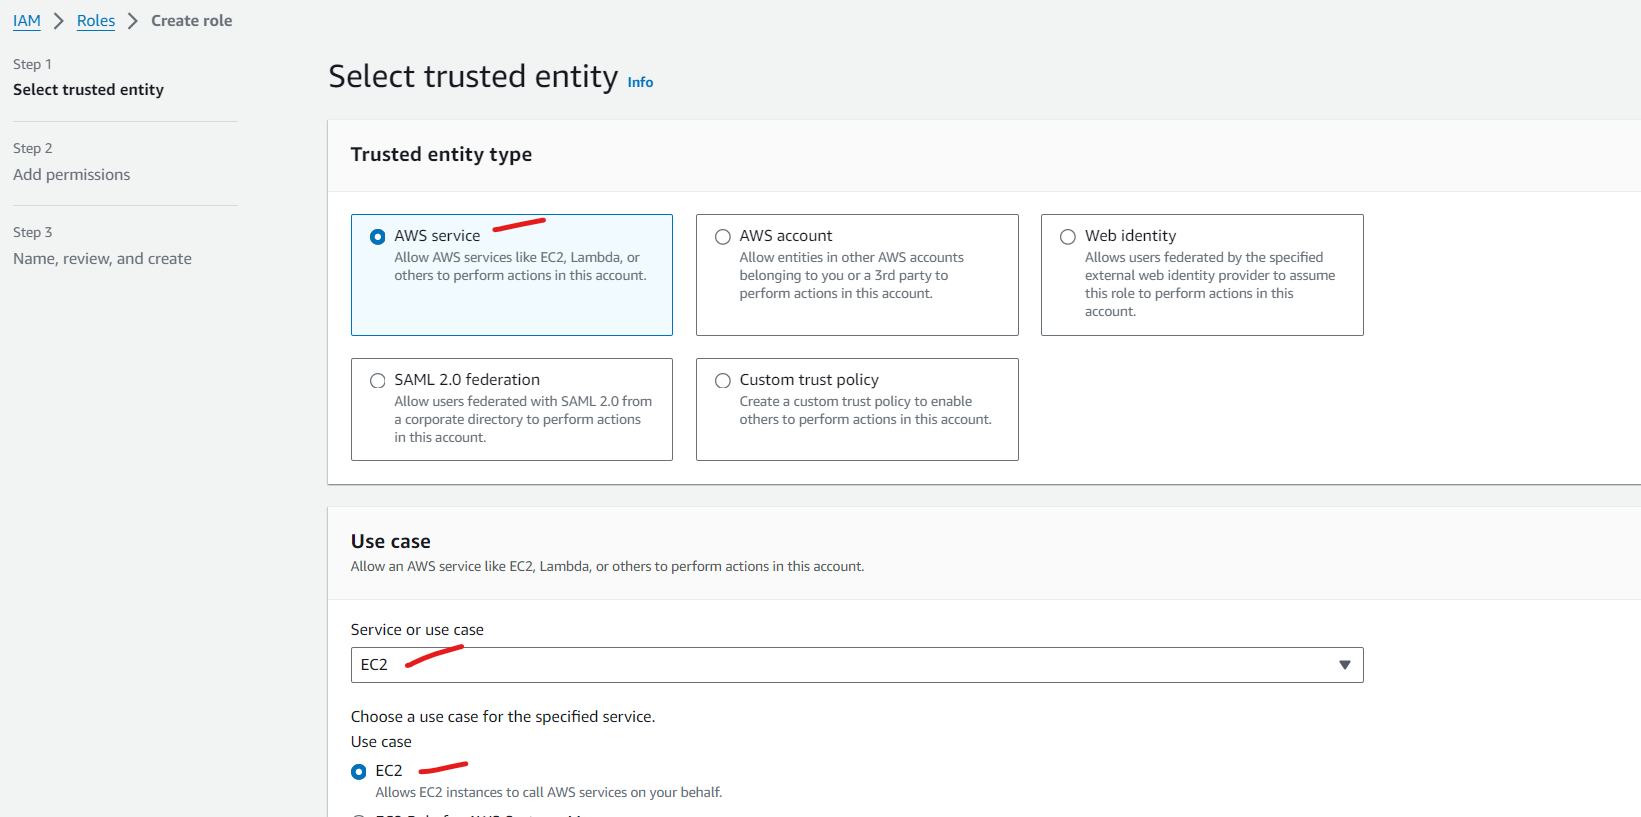
Create the IAM role having full access -
From EC2 we will be creating EKS which means that our EC2 should have access and permission to create EKS. This role will provide additional permissions between the two services.
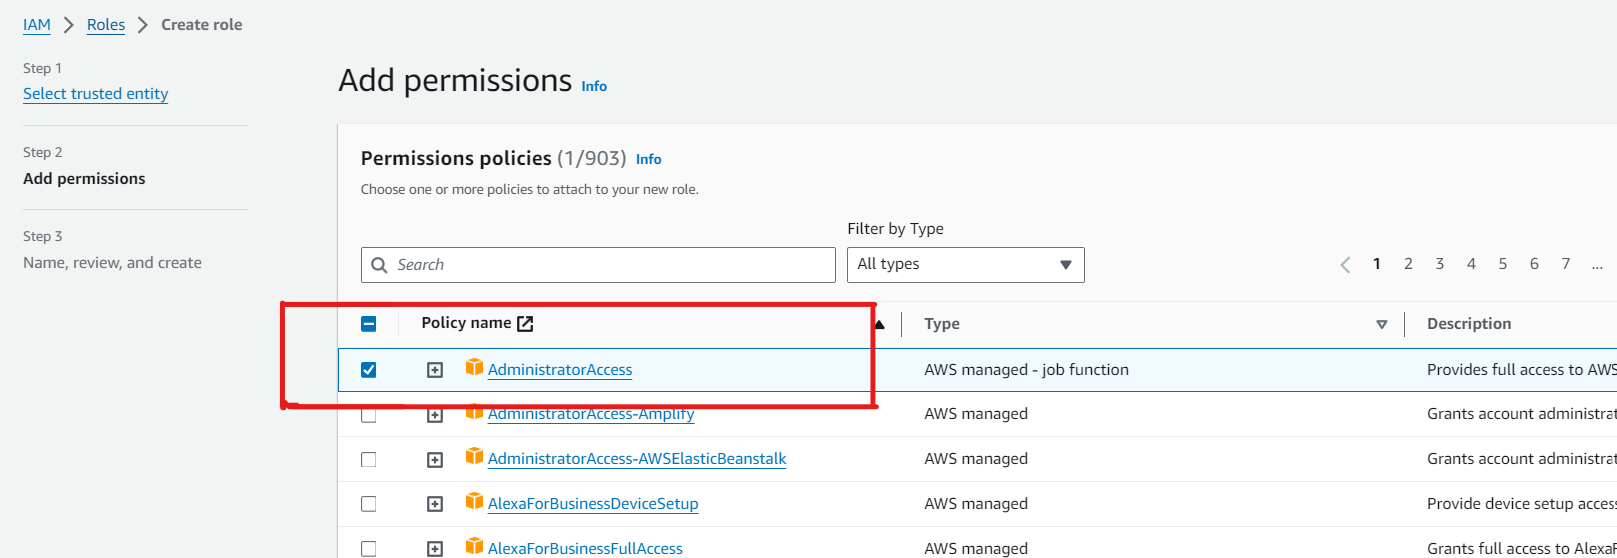
Provide Administrator access
Our IAM Role is created - EKS-Access-by-EC2

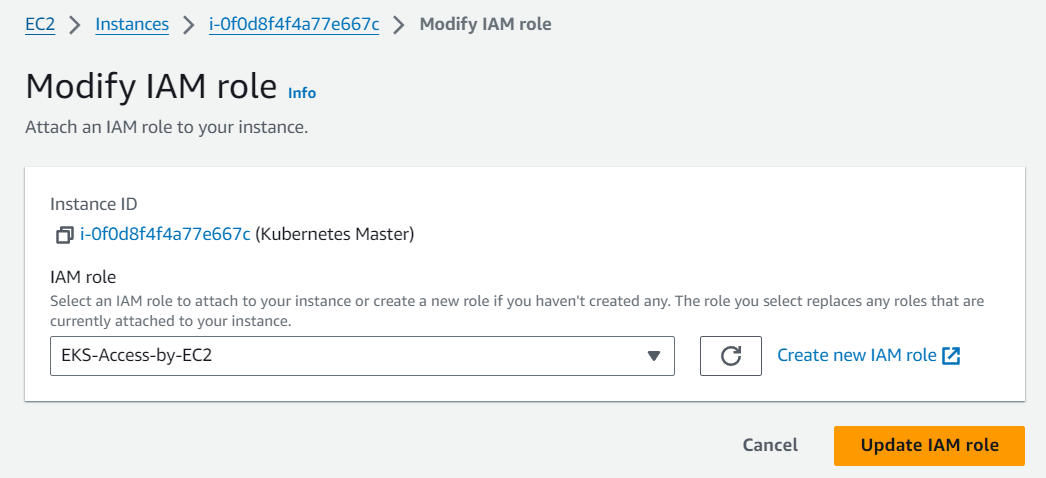
Attach the IAM role having full access to EC2 -
Go to EC2 → Action → security → Modify IAM role → select created role → update IAM role

Install AWS CLI and Configure -
 sudo su
 curl "https://awscli.amazonaws.com/awscli-exe-linux-x86_64.zip" -o "awscliv2.zip"
 sudo apt install unzip
 unzip awscliv2.zip
 sudo ./aws/install
 aws --version #to check
Install and Setup kubectl -
 curl -LO https://storage.googleapis.com/kubernetes-release/release/$(curl -s https://storage.googleapis.com/kubernetes-release/release/stable.txt)/bin/linux/amd64/kubectl
 chmod +x ./kubectl
 sudo mv ./kubectl /usr/local/bin
 kubectl version
Install and Setup eksctl -
 curl --silent --location "https://github.com/weaveworks/eksctl/releases/latest/download/eksctl_$(uname -s)_amd64.tar.gz" | tar xz -C /tmp
 sudo mv /tmp/eksctl /usr/local/bin
 eksctl version
Install Helm chart -
 curl -fsSL -o get_helm.sh https://raw.githubusercontent.com/helm/helm/main/scripts/get-helm-3
 chmod 700 get_helm.sh
 ./get_helm.sh
 helm version
Creating an Amazon EKS cluster using eksctl -
1. Name of the cluster : — eks2
2. Version of Kubernetes : — version 1.24
3. Region : — region us-east-1
4. Nodegroup name/worker nodes : — nodegroup-name worker-nodes
5. Node Type : — nodegroup-type t2.medium
6. Number of nodes : — nodes 2
7. Minimum Number of nodes : — nodes-min 2
8. Maximum Number of nodes : — nodes-max 3
eksctl create cluster --name eks2 --version 1.24 --region us-east-2 --zones=us-east-2a,us-east-2b --nodegroup-name worker-nodes --node-type t2.medium --nodes 2 --nodes-min 2 --nodes-max 3
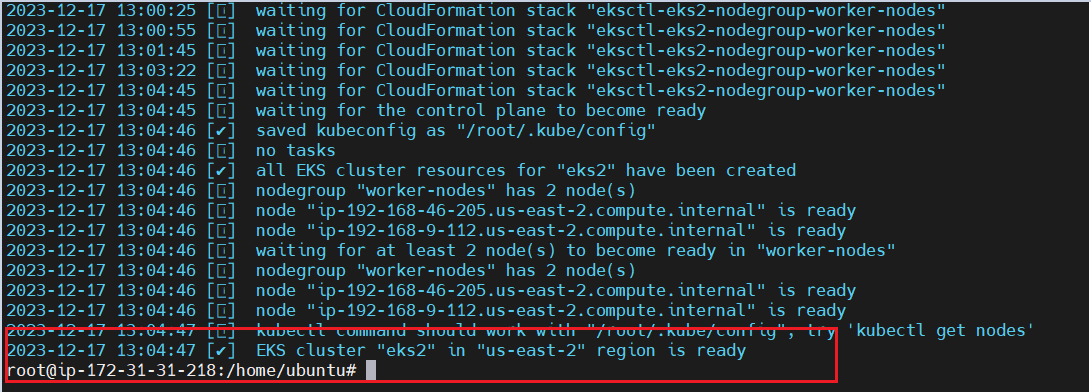
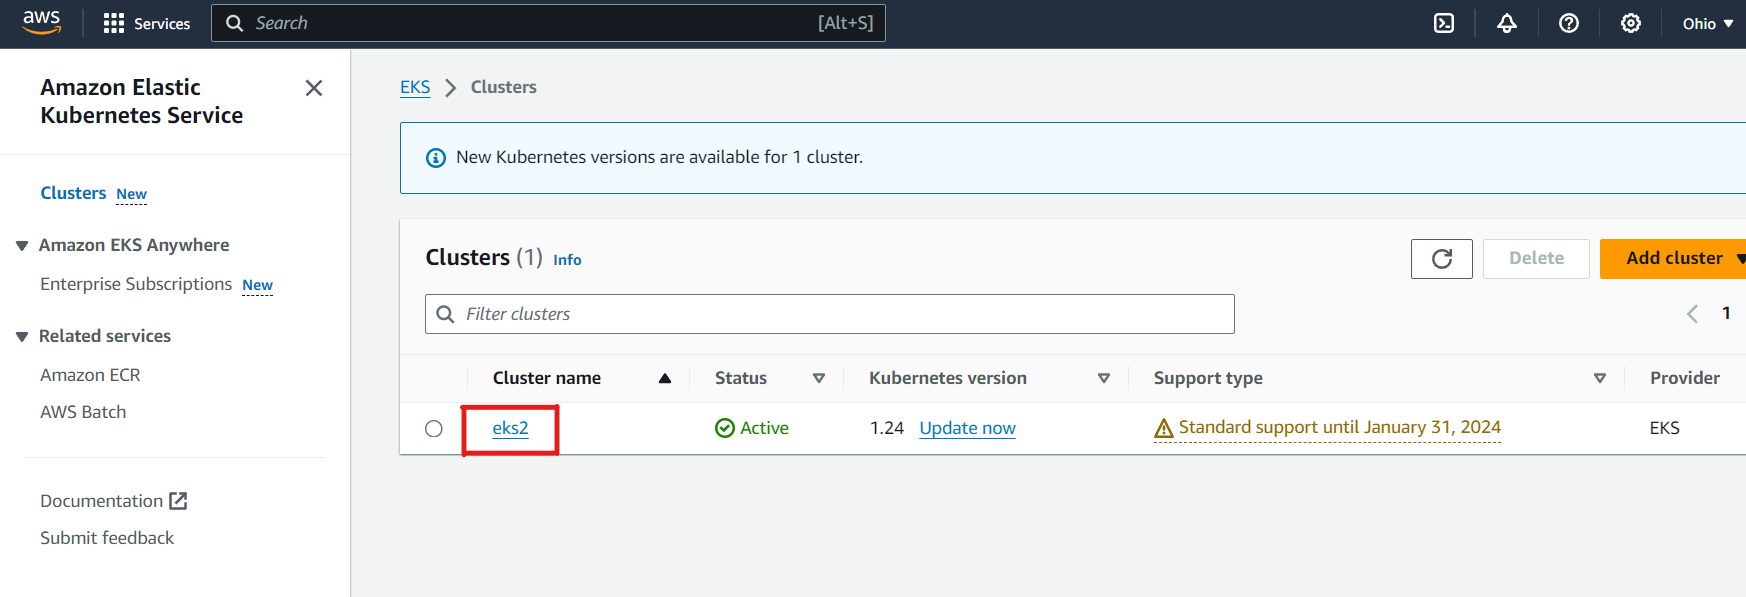
If any error received -
 aws eks update-kubeconfig --region <region-code> --name <cluster-name>
 #example:
 aws eks update-kubeconfig --region us-east-2 --name eks2
Installing the Kubernetes Metrics Server
The metrics-server fetches resource metrics from the kubelets and exposes them in the Kubernetes API server through the Metrics API for use by the HPA and VPA. We can also view these metrics using the kubectl top command. The metrics-server uses the Kubernetes API to track nodes and pods in our cluster.
In Kubernetes, there are three important types of metrics to monitor: resource metrics, cluster state metrics, and control plane metrics.
kubectl apply -f https://github.com/kubernetes-sigs/metrics-server/releases/latest/download/components.yaml

Verify that the metrics-server deployment is running the desired number of pods with the following command
kubectl get pods -n kube-system
Verify that the metrics-server deployment is running the desired number of pods with the following command -
kubectl get deployment metrics-server -n kube-system
Install Prometheus
We will install Prometheus using Helm charts
Add Prometheus helm chart repository to local repository
helm repo add prometheus-community https://prometheus-community.github.io/helm-charts
Update helm chart repository -
 helm repo update
 helm repo list
Create Prometheus namespace -
 kubectl create namespace prometheus
 kubectl get ns
Install Prometheus -
We are creating pod with persistent volume storage of gp2 type.
helm install prometheus prometheus-community/prometheus --namespace prometheus --set alertmanager.persistentVolume.storageClass="gp2" --set server.persistentVolume.storageClass="gp2"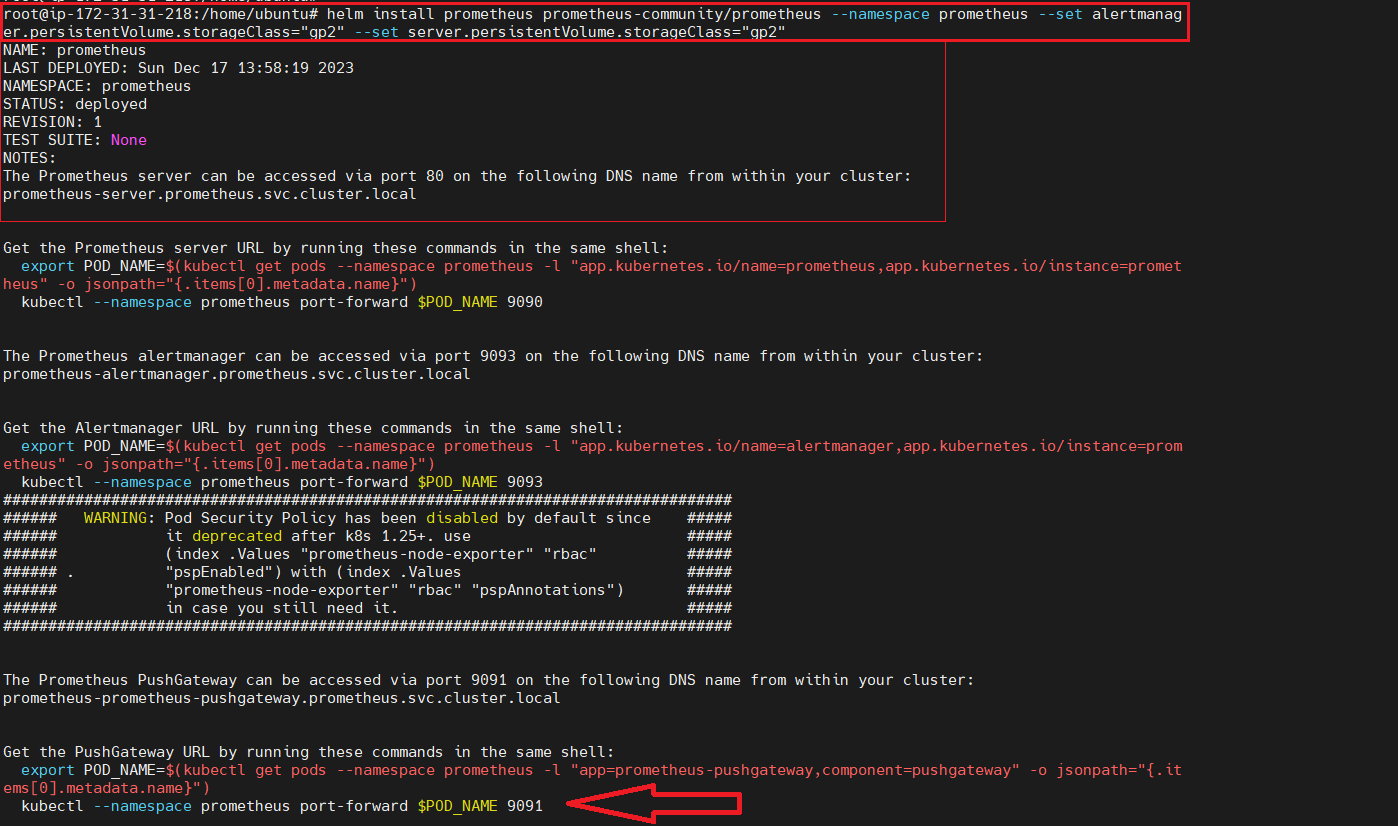
Create IAM OIDC Provider
Our cluster has an OpenID Connect (OIDC) issuer URL associated with it. To use AWS Identity and Access Management (IAM) roles for service accounts, an IAM OIDC provider must exist for your cluster’s OIDC issuer URL.
From EC2, we have given access to EKS, similarly, from EKS we need to talk to EC2.
OID is getting connected to EKS cluster
oidc_id=$(aws eks describe-cluster --name eks2 --region us-east-2 --query "cluster.identity.oidc.issuer" --output text | cut -d '/' -f 5)
echo $oidc_id
aws iam list-open-id-connect-providers | grep $oidc_id | cut -d "/" -f4
eksctl utils associate-iam-oidc-provider --cluster eks2 --approve --region us-east-2

Create iam-service account with role
We are creating an IAM-service account so that kubernetes can access the EBS volumes and backend systems in AWS
eksctl create iamserviceaccount --name ebs-csi-controller-sa --namespace kube-system --cluster eks2 --attach-policy-arn arn:aws:iam::aws:policy/service-role/AmazonEBSCSIDriverPolicy --approve --role-only --role-name AmazonEKS_EBS_CSI_DriverRole --region us-east-2

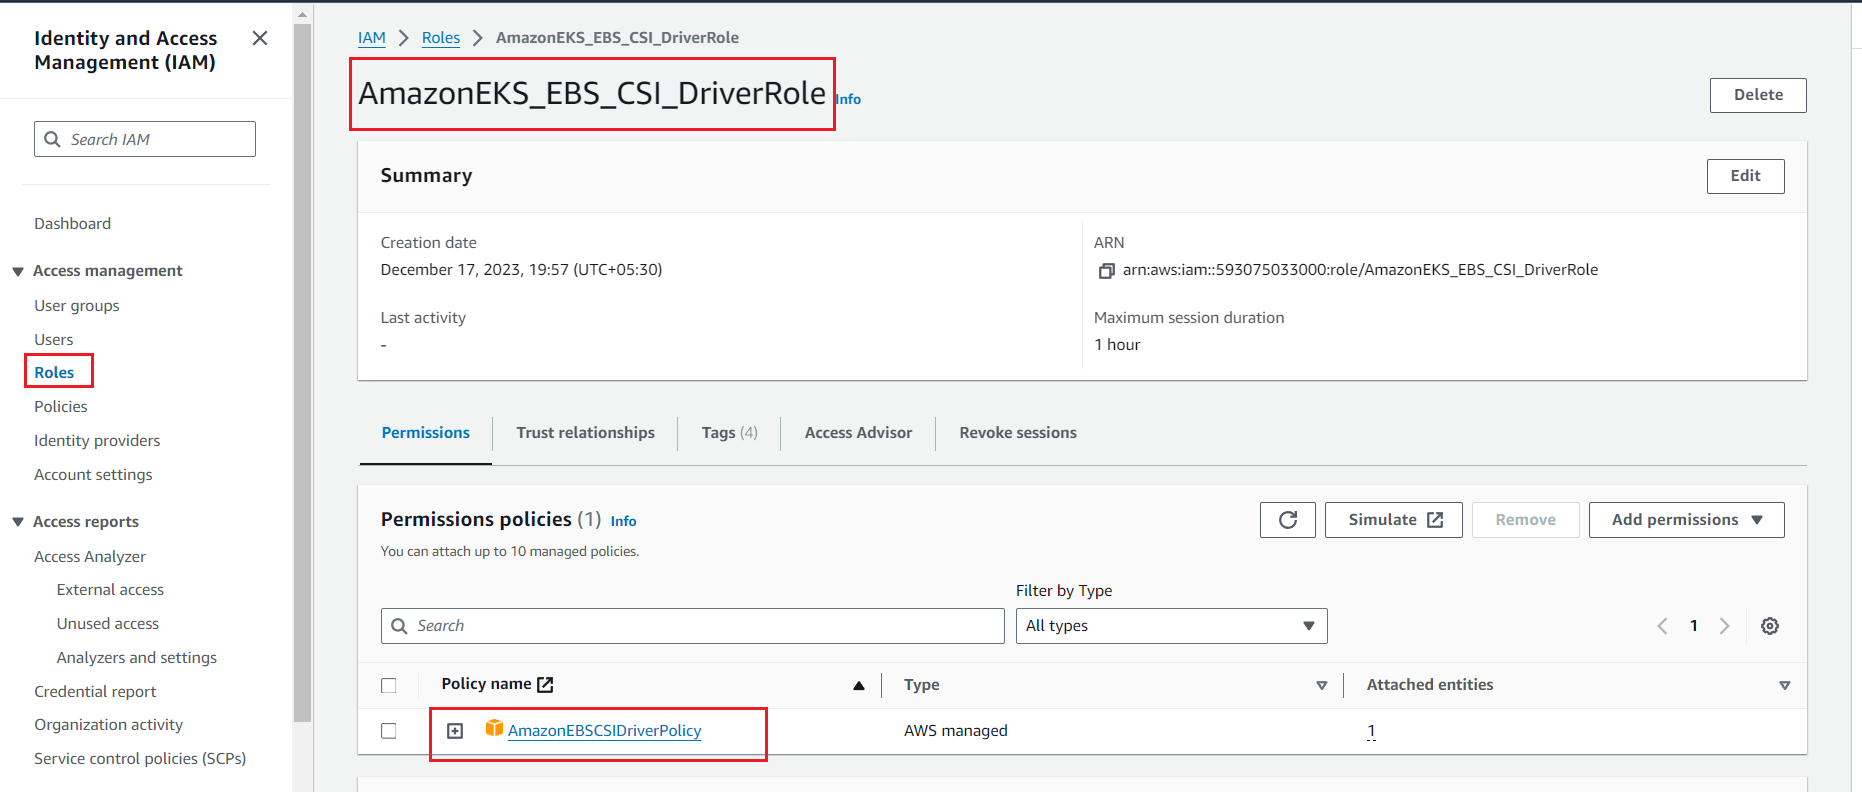
Attach the role to EKS by running the following command
In below command paste the <arn_id > and execute the command
eksctl create addon --name aws-ebs-csi-driver --cluster eks2 --service-account-role-arn <arn_id> --force --region us-east-2

#in my case
eksctl create addon --name aws-ebs-csi-driver --cluster eks2 --service-account-role-arn arn:aws:iam::593075033000:role/AmazonEKS_EBS_CSI_DriverRole --force --region us-east-2


To check the pods of prometheus -
 kubectl get pods -n prometheus
 kubectl get all -n prometheus
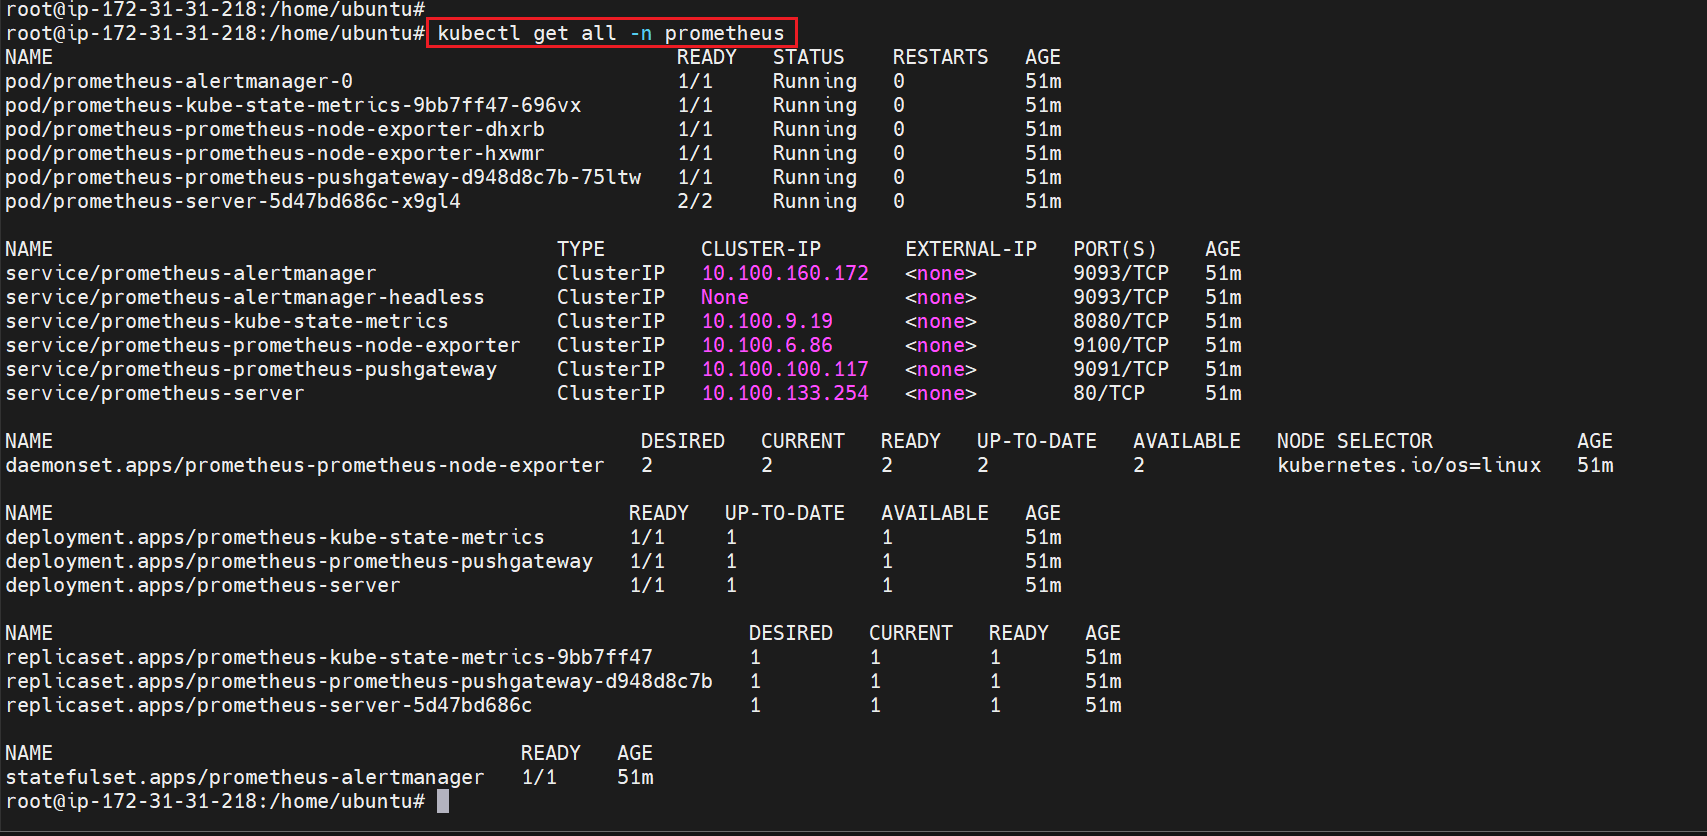
View the Prometheus dashboard by forwarding the deployment ports
kubectl port-forward deployment/prometheus-server 9090:9090 -n prometheus
Open different browser or duplicate tab and connect to your EC2 instance(Master)
curl localhost:9090/graph

Install Grafana
helm repo add grafana https://grafana.github.io/helm-charts
helm repo update

Creating Prometheus data source
We need to create Prometheus data source so that Grafana can access Kubernetes metrics
Create a yaml file prometheus-datasource.yaml and save the below data source into it.
datasources:
 datasources.yaml:
 apiVersion: 1
 datasources:
    - name: Prometheus
      type: prometheus
      url: http://prometheus-server.prometheus.svc.cluster.local
      access: proxy
      isDefault: true
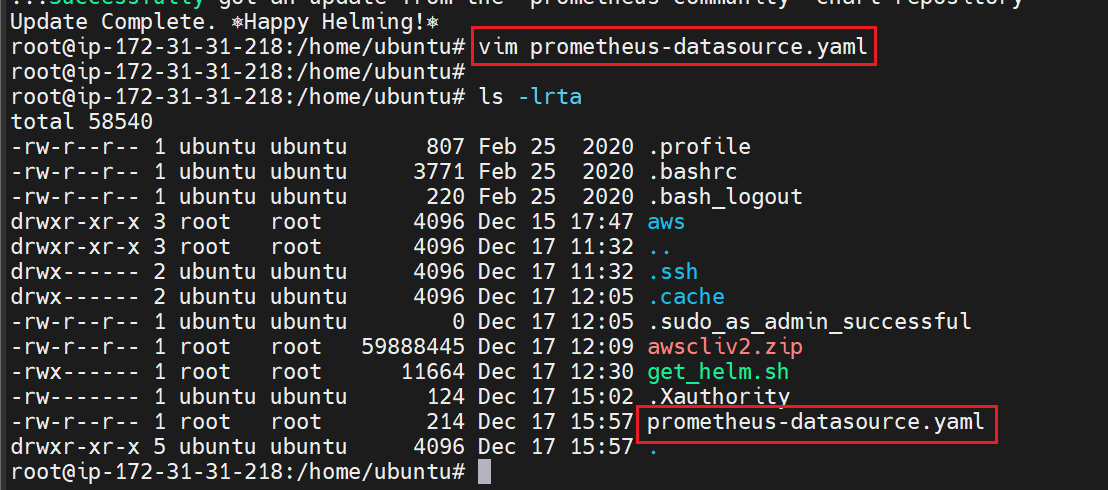
Create a namespace Grafana
kubectl create namespace grafana
Install the Grafana
This command will create the Grafana service with an external load balancer to get the public view
helm install grafana grafana/grafana --namespace grafana --set persistence.storageClassName="gp2" --set persistence.enabled=true --set adminPassword='EKS!sAWSome' --set service.type=LoadBalancer
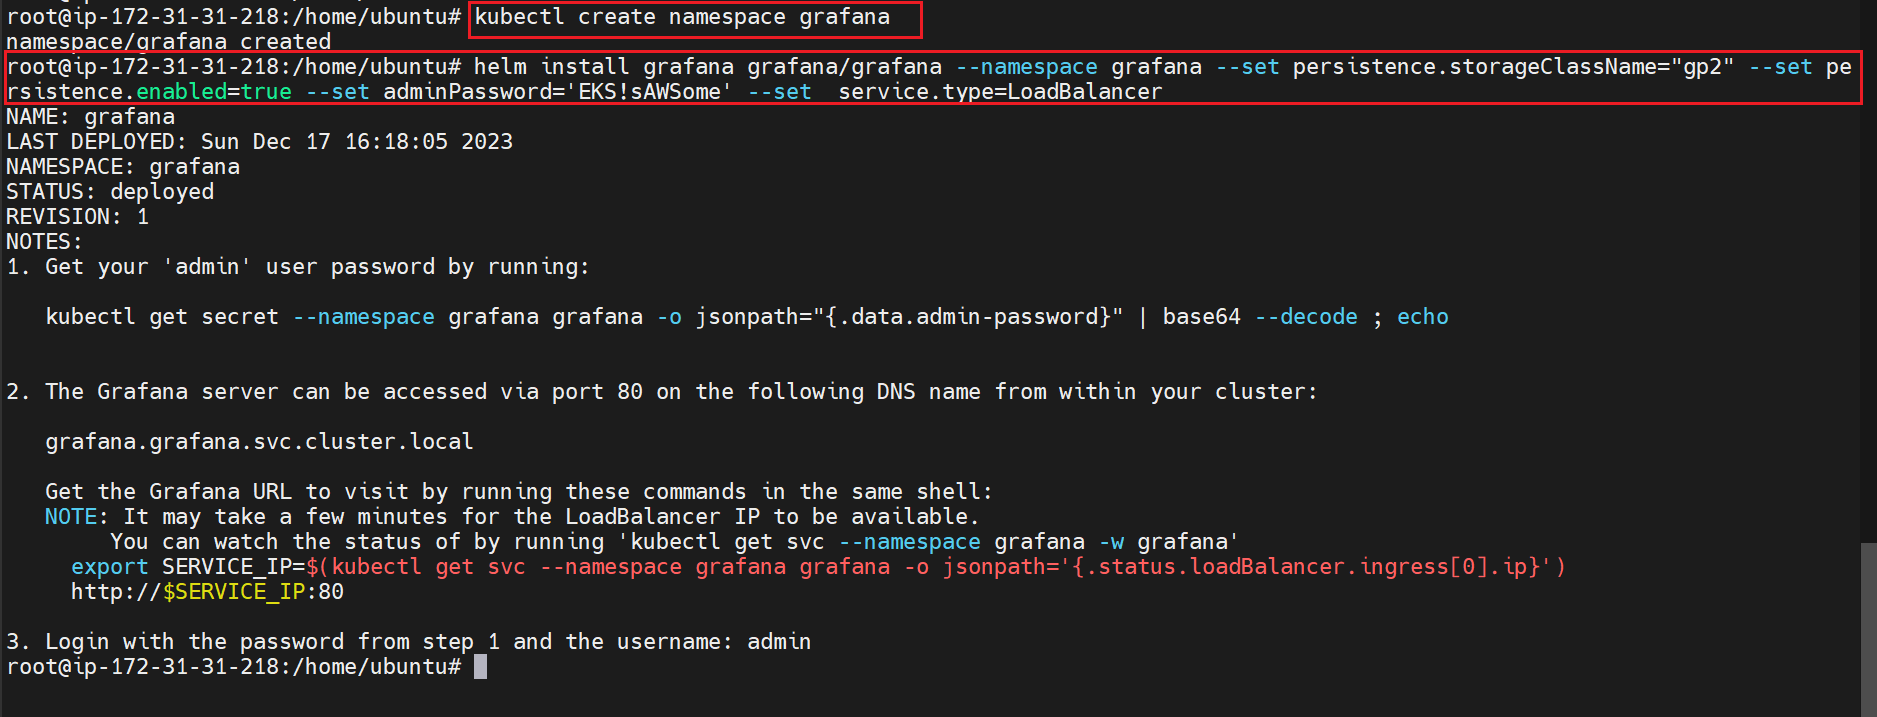
Verify the Grafana installation by using the following kubectl command
kubectl get pods -n grafana
kubectl get service -n grafana

Copy the EXTERNAL-IP and paste in browser

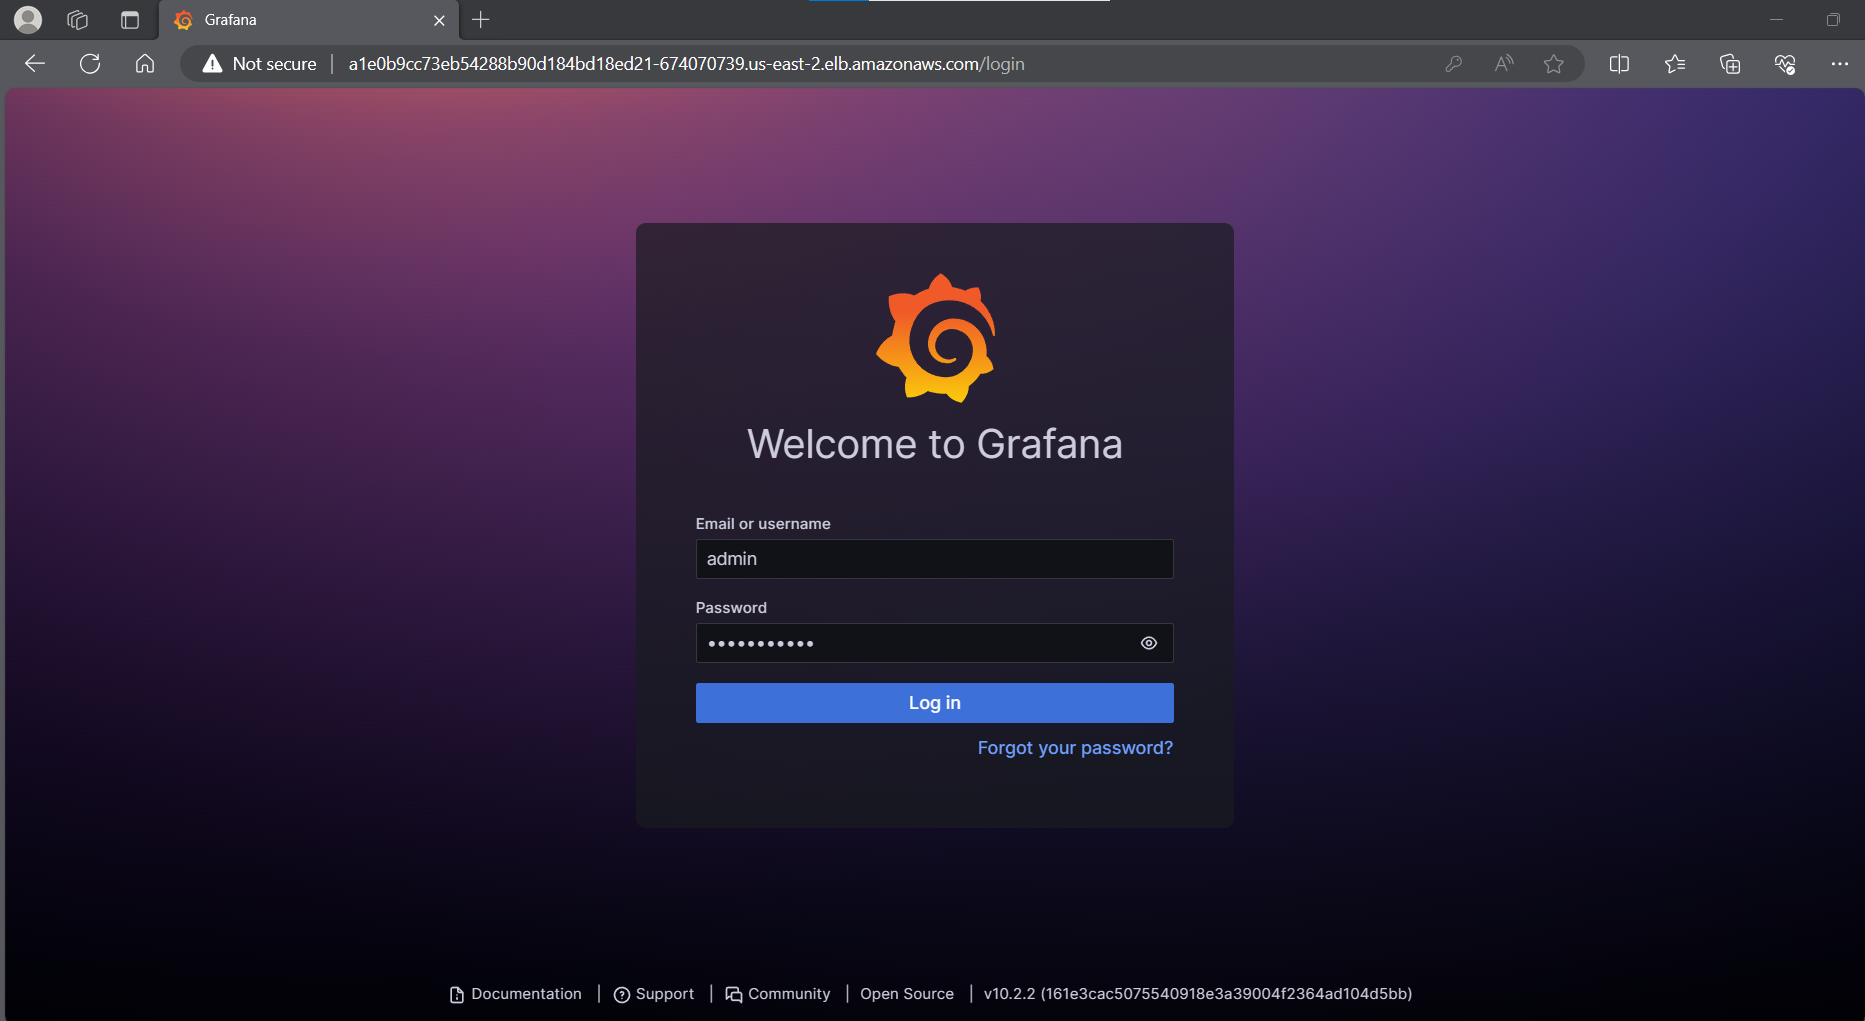
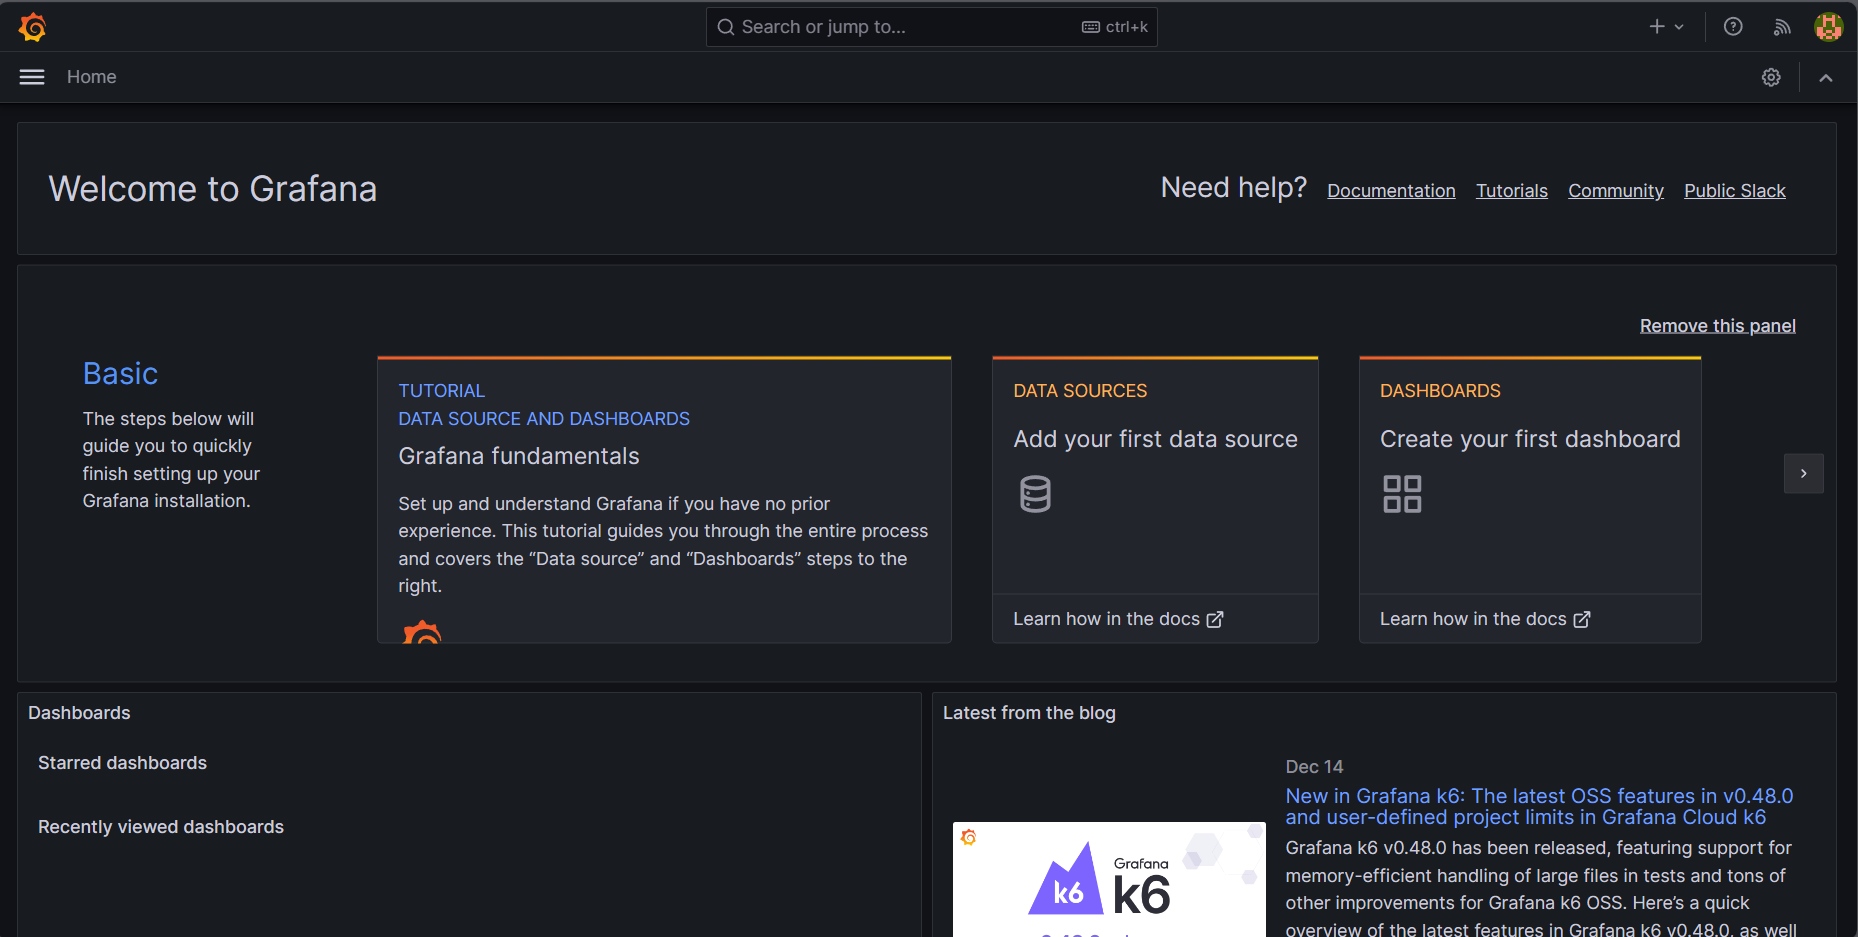
Add the Prometheus as the datasource to Grafana
Go to Grafana Dashboard → Add the Datasource → Select the Prometheus
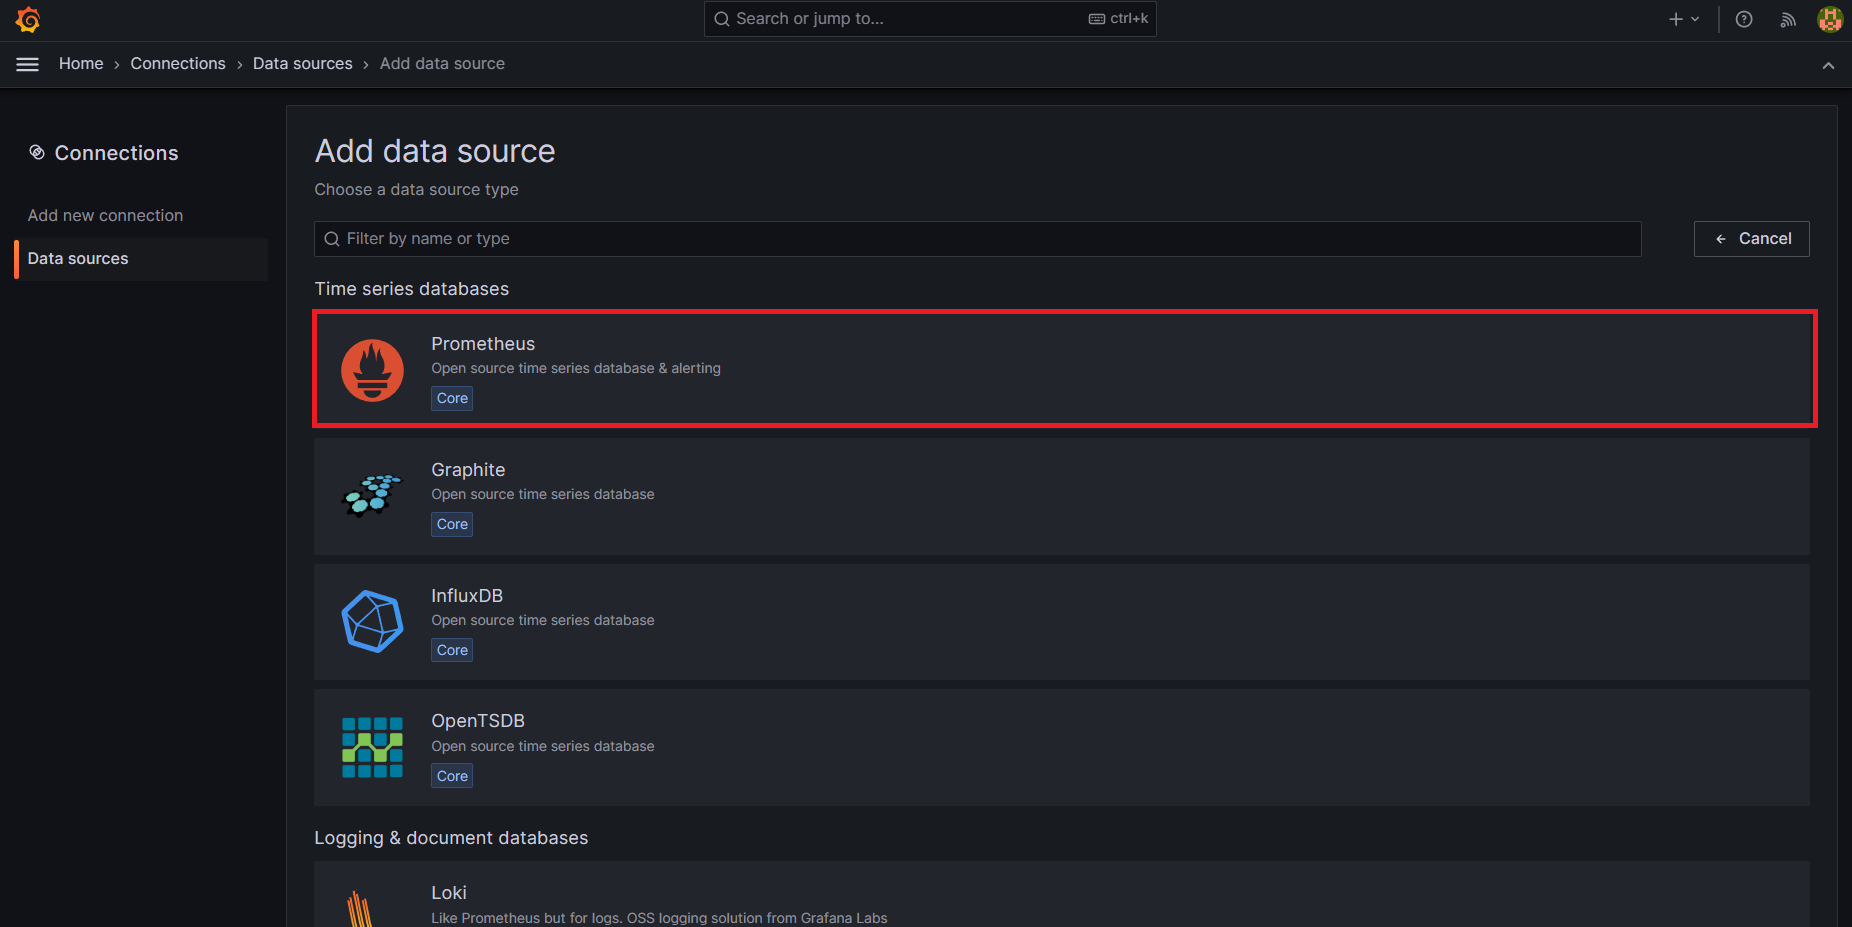
Add the below url in Connection and save and test
http://prometheus-server.prometheus.svc.cluster.local/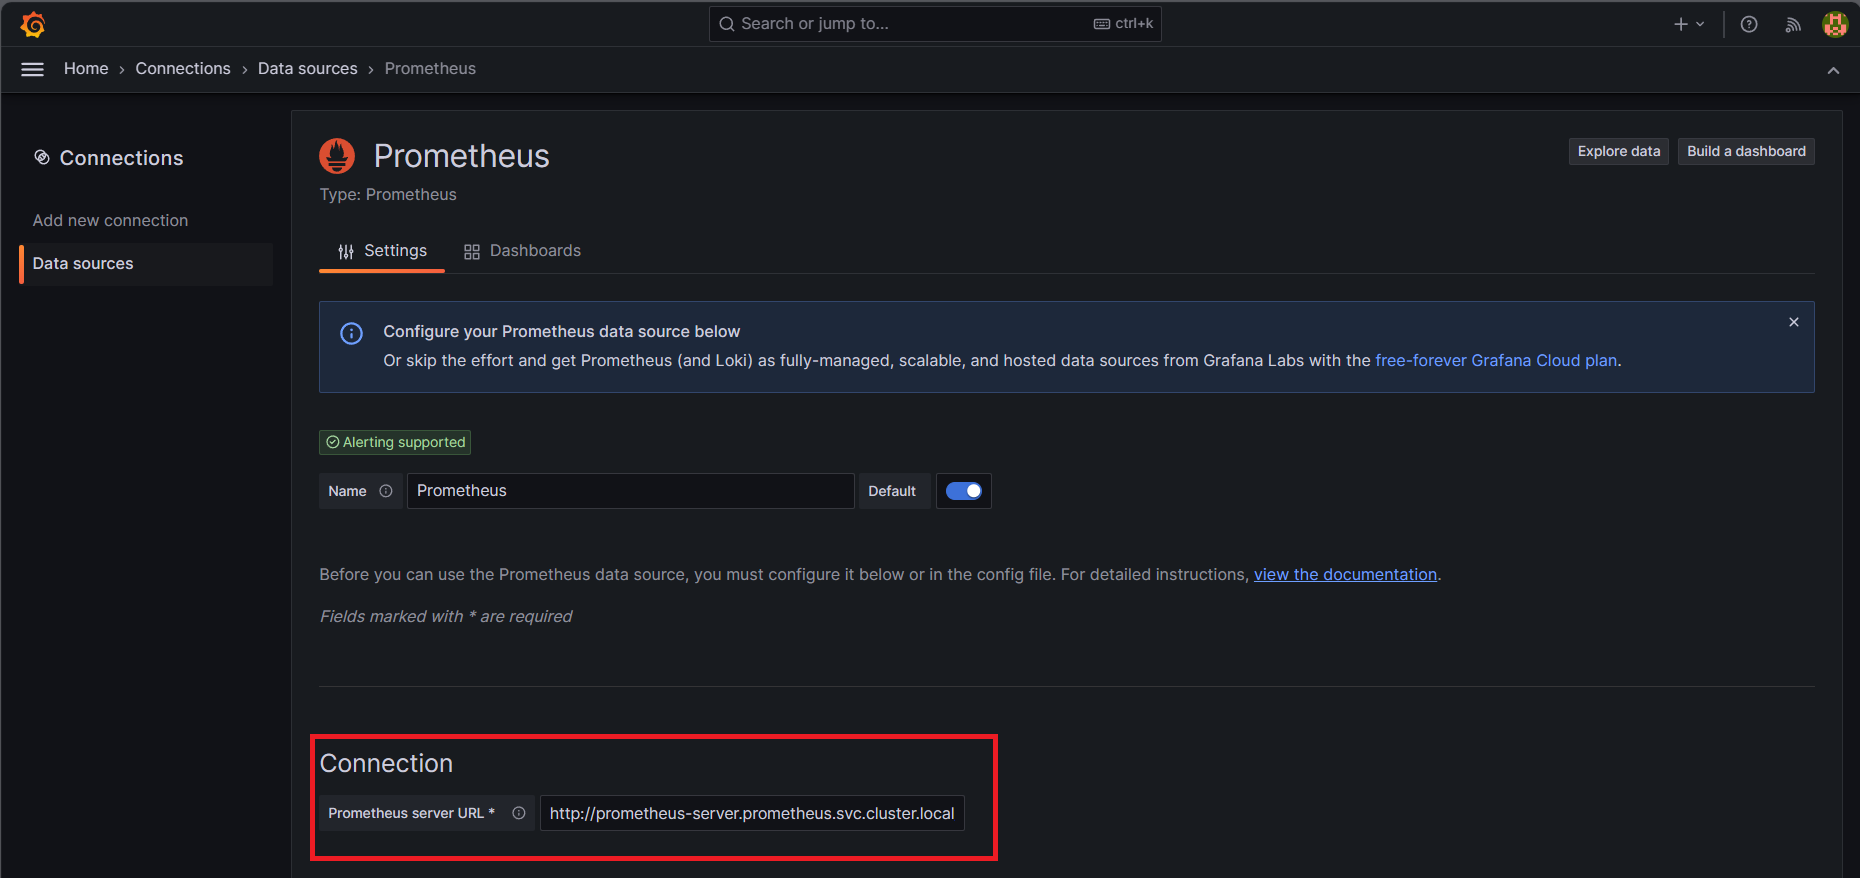

Import Grafana dashboard from Grafana Labs
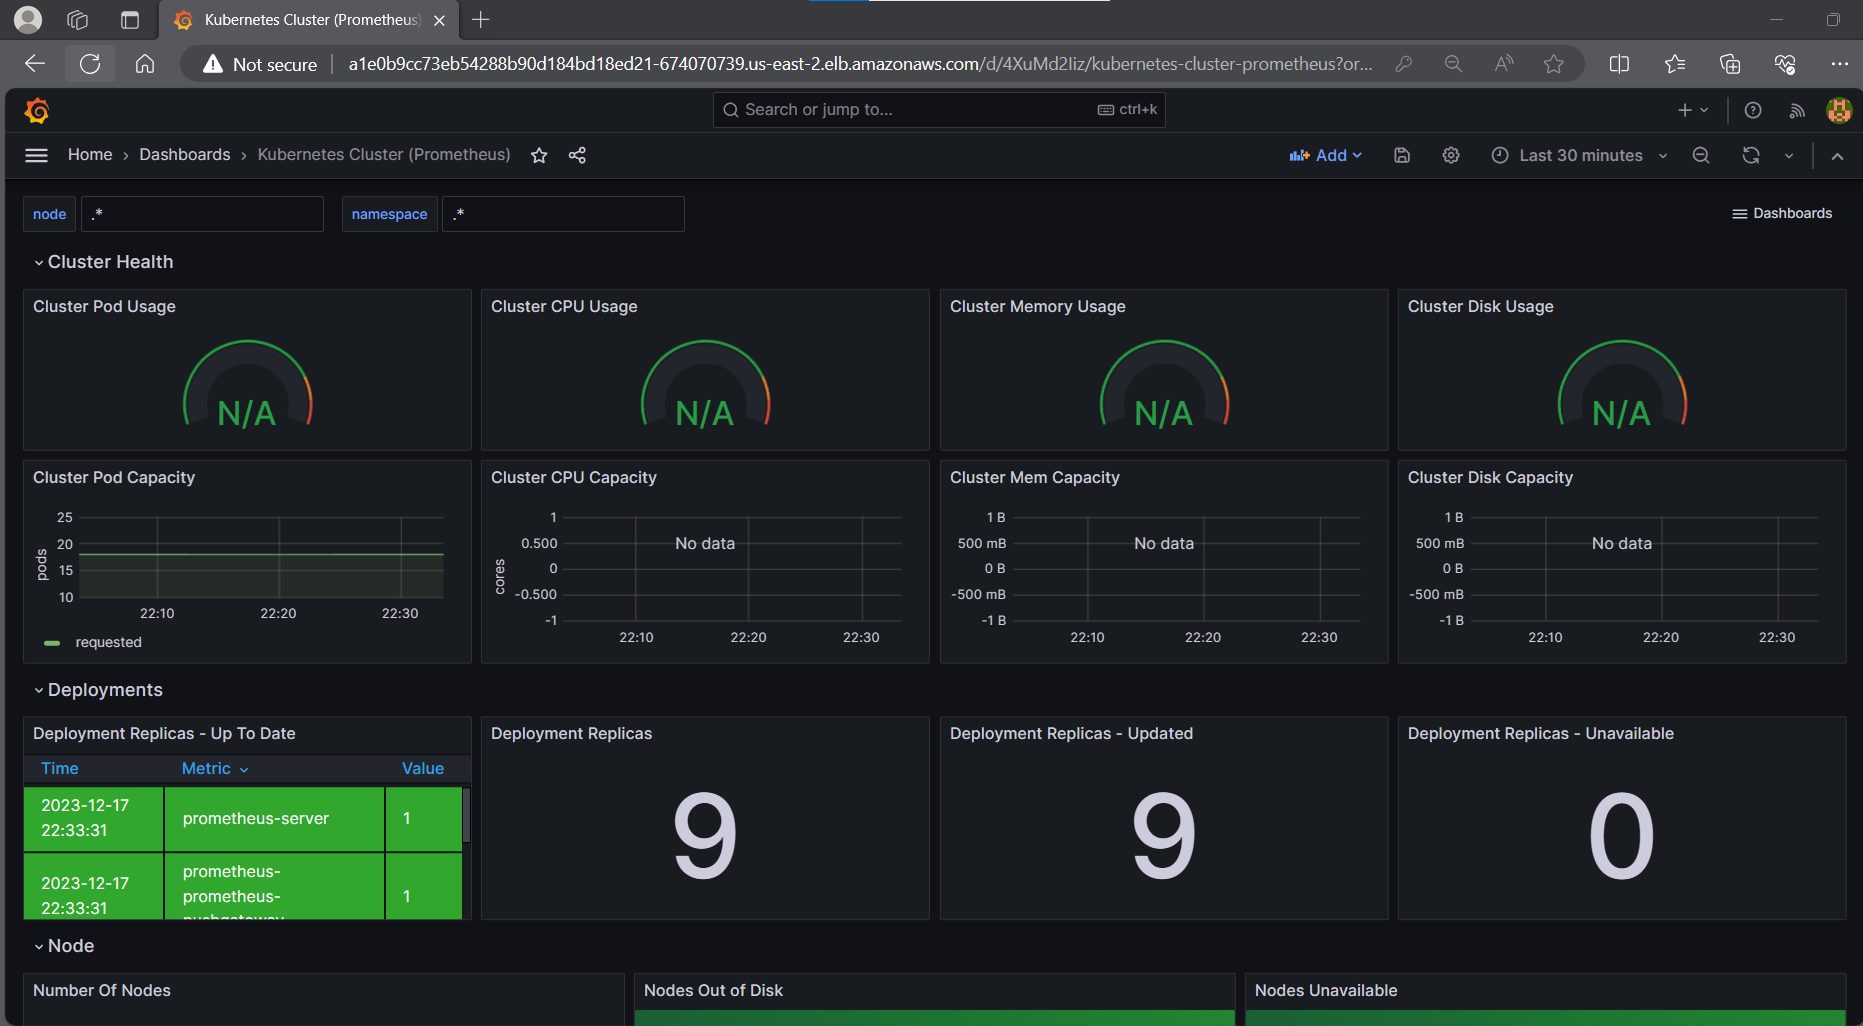
Now we have set up everything in terms of Prometheus and Grafana. For the custom Grafana Dashboard, we are going to use the open source grafana dashboard. For this session, I am going to import a dashboard 6417
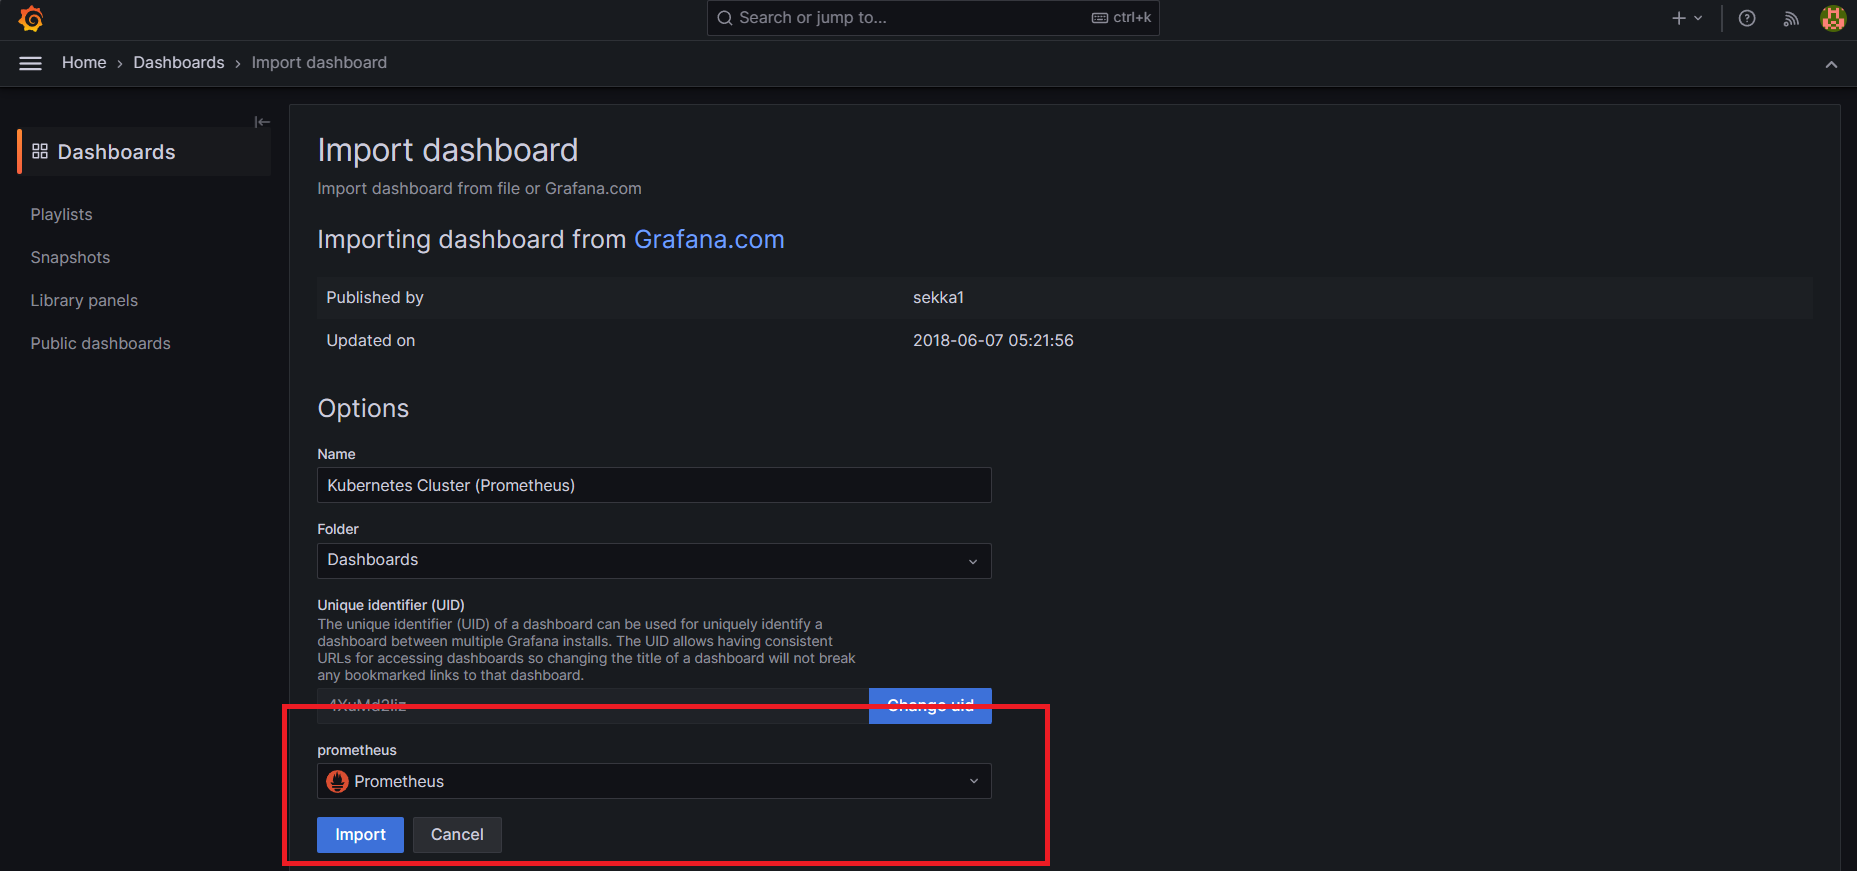
grafana dashboard → new → Import → 6417 → load → select prometheus → import

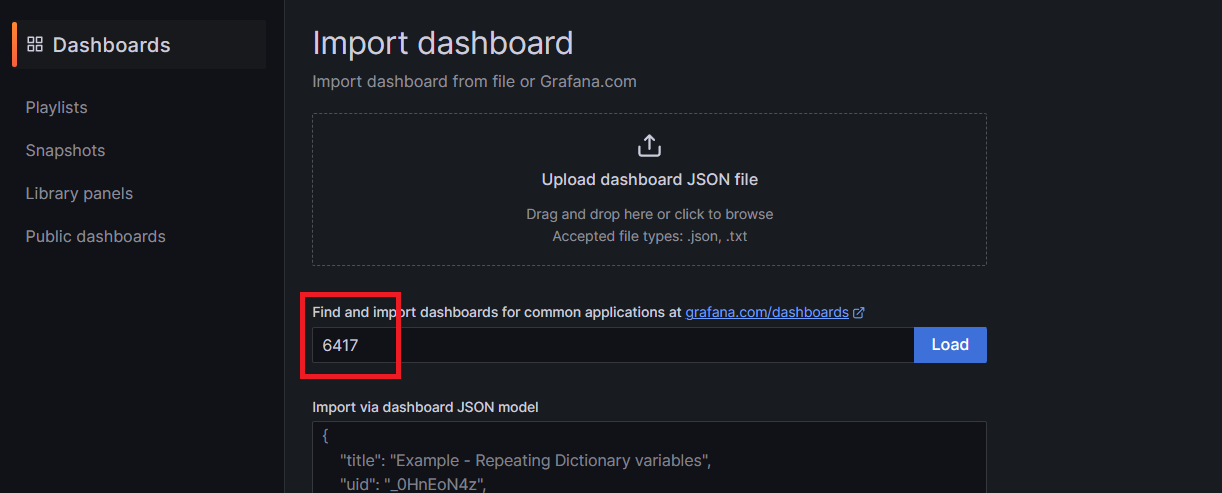
Select Prometheus and click on import
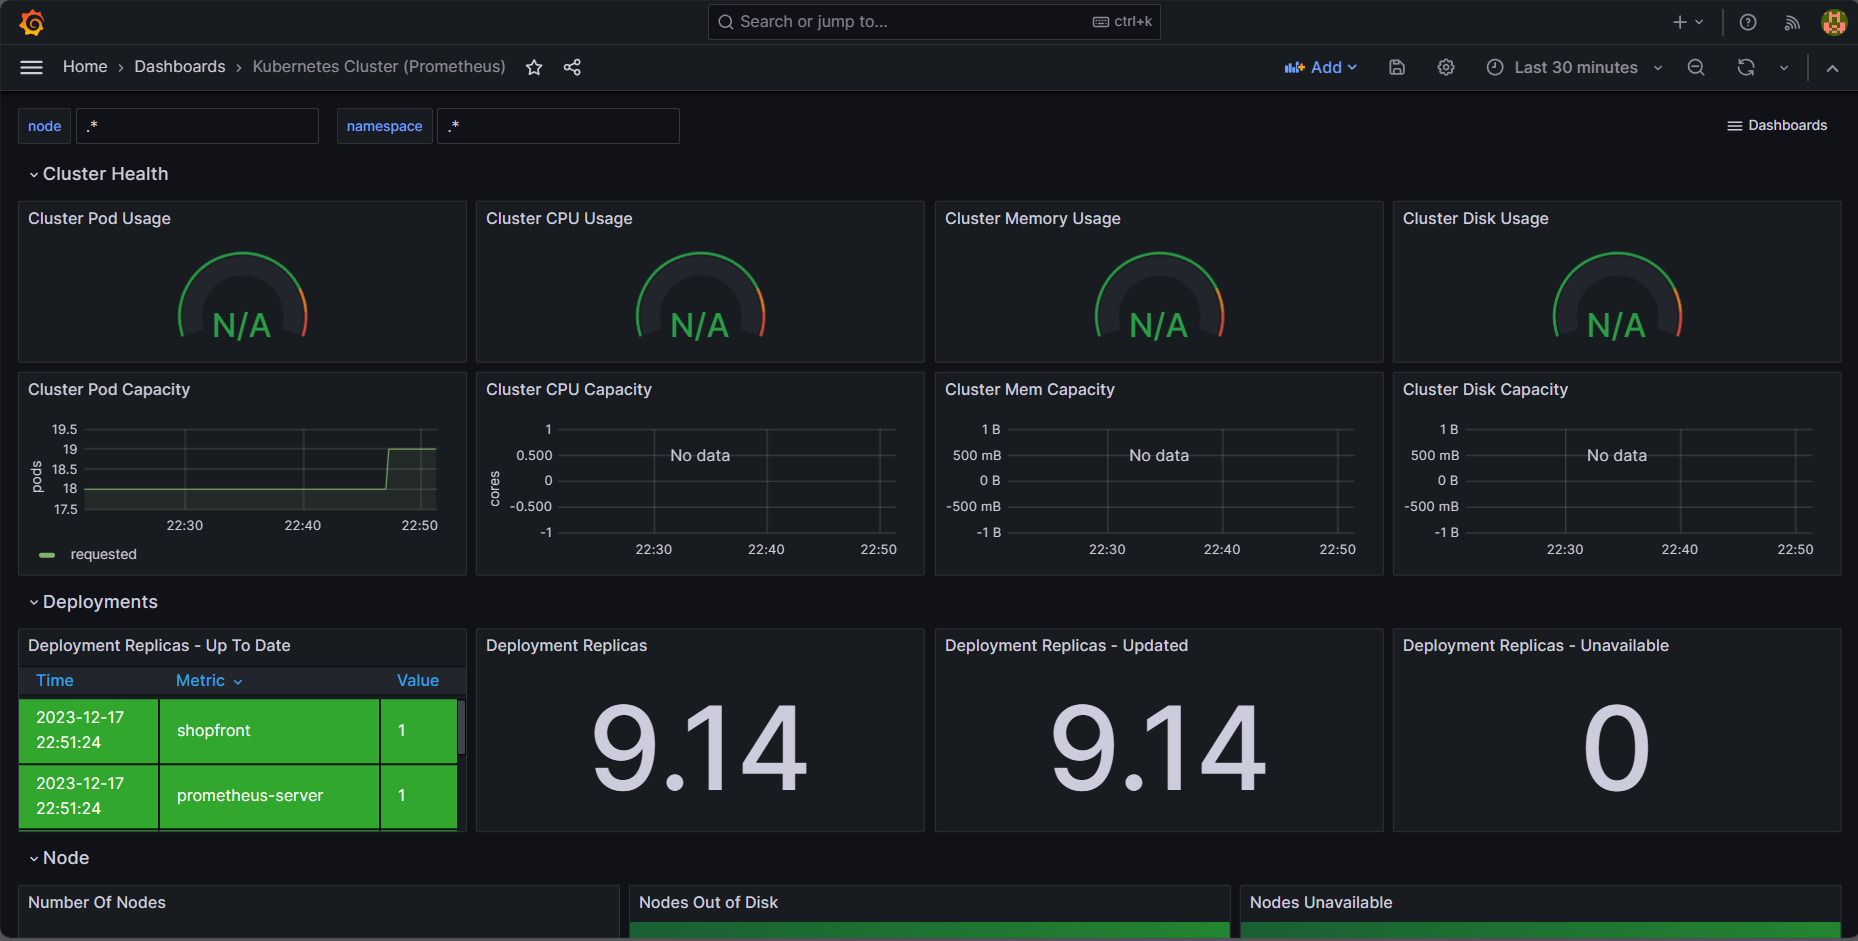
Deploy a Java application and monitor it on Grafana
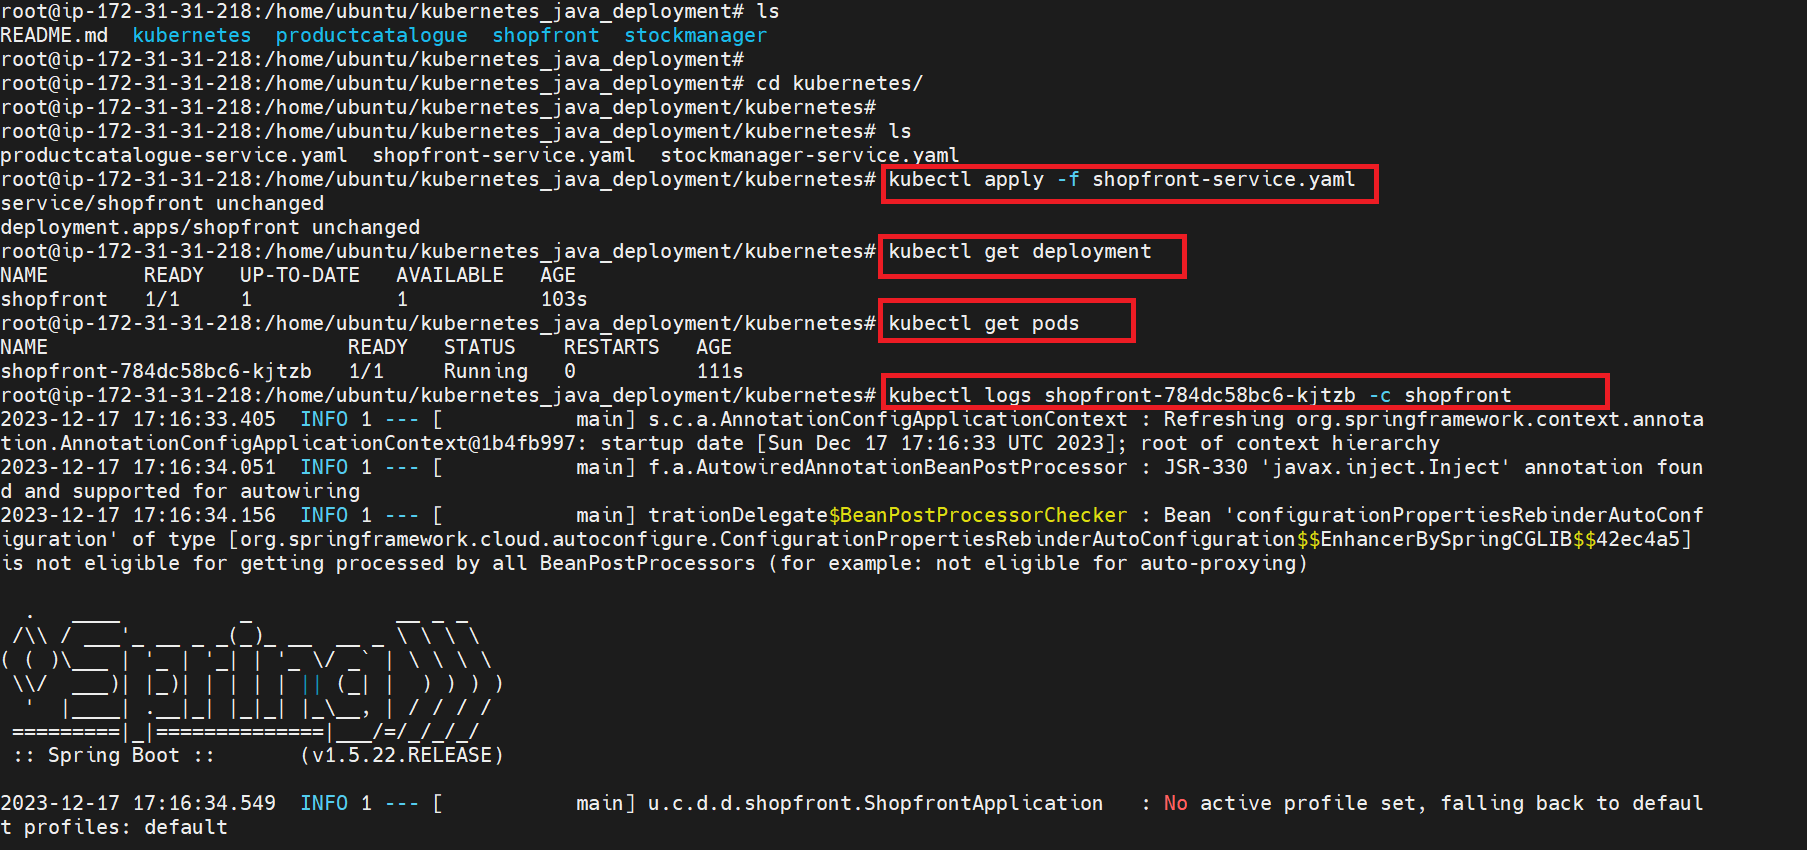
git clone https://github.com/iam-priyam/kubernetes_java_deployment.gitAfter cloning the project enter in to the project directory kubernetes_java_deployment and then open kubernetes directory and run below commands -
 kubectl apply -f shopfront-service.yaml
 kubectl get deployment
 kubectl get pods
kubectl logs shopfront-784dc58bc6-kjtzb -c shopfront

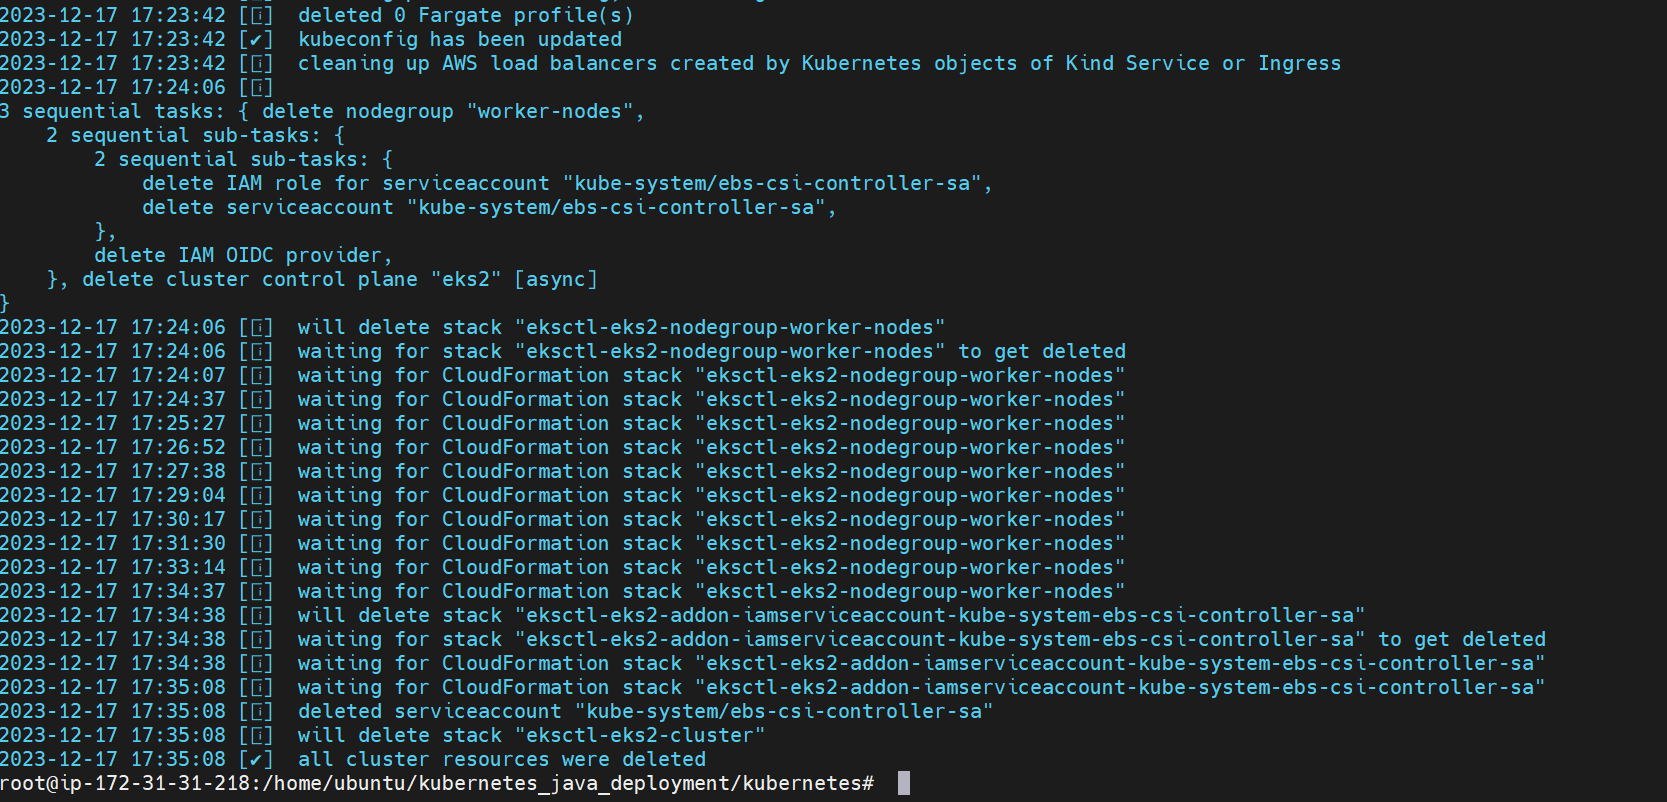
Delete the project by running the below command
eksctl delete cluster --name eks2 --region us-east-2
Key Learnings ~
In this project we created AWS IAM role and understood its implementation.
Created AWS EKS 3 nodes cluster using eksctl commands and understood its configuration.
Familiarized with Kubernetes metrics server.
Worked with Helm and installed tools using helm.
Created IAM OIDC Provider and understood why it is needed.
Created service account role attached it to EKS cluster.
Hands-on implementation of kubectl commands and manage PODS, Services, Deployments.
Hands-on implementation of Prometheus data-source and add it to Grafana
Subscribe to my newsletter
Read articles from PRIYAM KUMAR SAHA directly inside your inbox. Subscribe to the newsletter, and don't miss out.
Written by
