Set Up Grafana on a Linux machine (ec2)
 Subash Neupane
Embarking on this blog journey, we delve into the indispensable monitoring tool essential for data analysis through visualization—Grafana. Join us as we explore its features and real-world applications, providing a comprehensive understanding of this powerful tool.
What is Grafana?
Grafana, an open-source analytics and interactive visualization software, has been transforming data analysis since 2014. Its cross-platform compatibility makes it a versatile choice, delivering charts, graphs, and alerting functionalities for web applications when connected to supported data sources. The standout feature lies in its expandability through a plug-in system, empowering users to tailor and extend its capabilities to meet specific needs.
Grafana's Features:
User-Friendly Dashboards: Grafana takes pride in its intuitive and user-friendly dashboard interface, enabling users to effortlessly visualize and comprehend intricate data sets.
Multi-Data Source Integration: With a unified platform, Grafana seamlessly integrates with various data sources, including databases, cloud services, and IoT devices. This consolidation transforms diverse data streams into a cohesive and visually appealing display.
Alerting and Notification: Beyond visualization, Grafana excels in offering robust alerting capabilities. Users can configure alerts based on predefined thresholds, ensuring proactive responses to critical changes in data metrics.
Some real-world use cases of Grafana:
Infrastructure Monitoring
Application Performance Management (APM)
Internet of Things (IoT) Device Monitoring
Log Analysis and Visualization
Security Information and Event Management (SIEM):
Cloud Infrastructure Monitoring
Custom Metrics and Data Sources
Let's Dive into Installation:
Follow a step-by-step process to install Grafana on your EC2 instance, unlocking its full potential for creating intricate monitoring dashboards. Stay tuned for a hands-on guide to harnessing the power of Grafana for effective data visualization and monitoring solutions.Create an ec2 instance

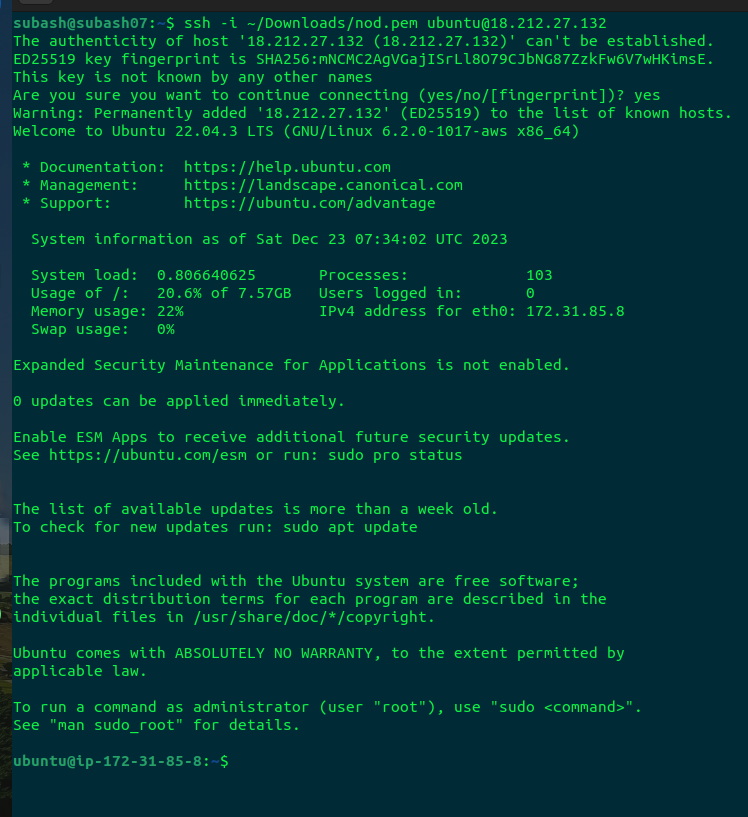
Connect to the Instance using SSH protocol

Update the packages in the ec2 instance
Sudo apt-get update
sudo apt-get upgrade
Add the Grafana APT repository

Import Grafana GPG key

Install Grafana

Start the Grafana and check the status of Grafana

Our Grafana server is installed successfully and is running actively.
Let's enable the Grafana on booting so that it starts after booting is started.

To access Grafana in a web browser, we need to hit piblic_ip:3000 since the default port of Grafana is 3000. But we haven't set any security rule in the ec2 instance, we cannot access the Grafana. Therefore, we need to add the inbound rule in the security groups of our grafana_Server instance.

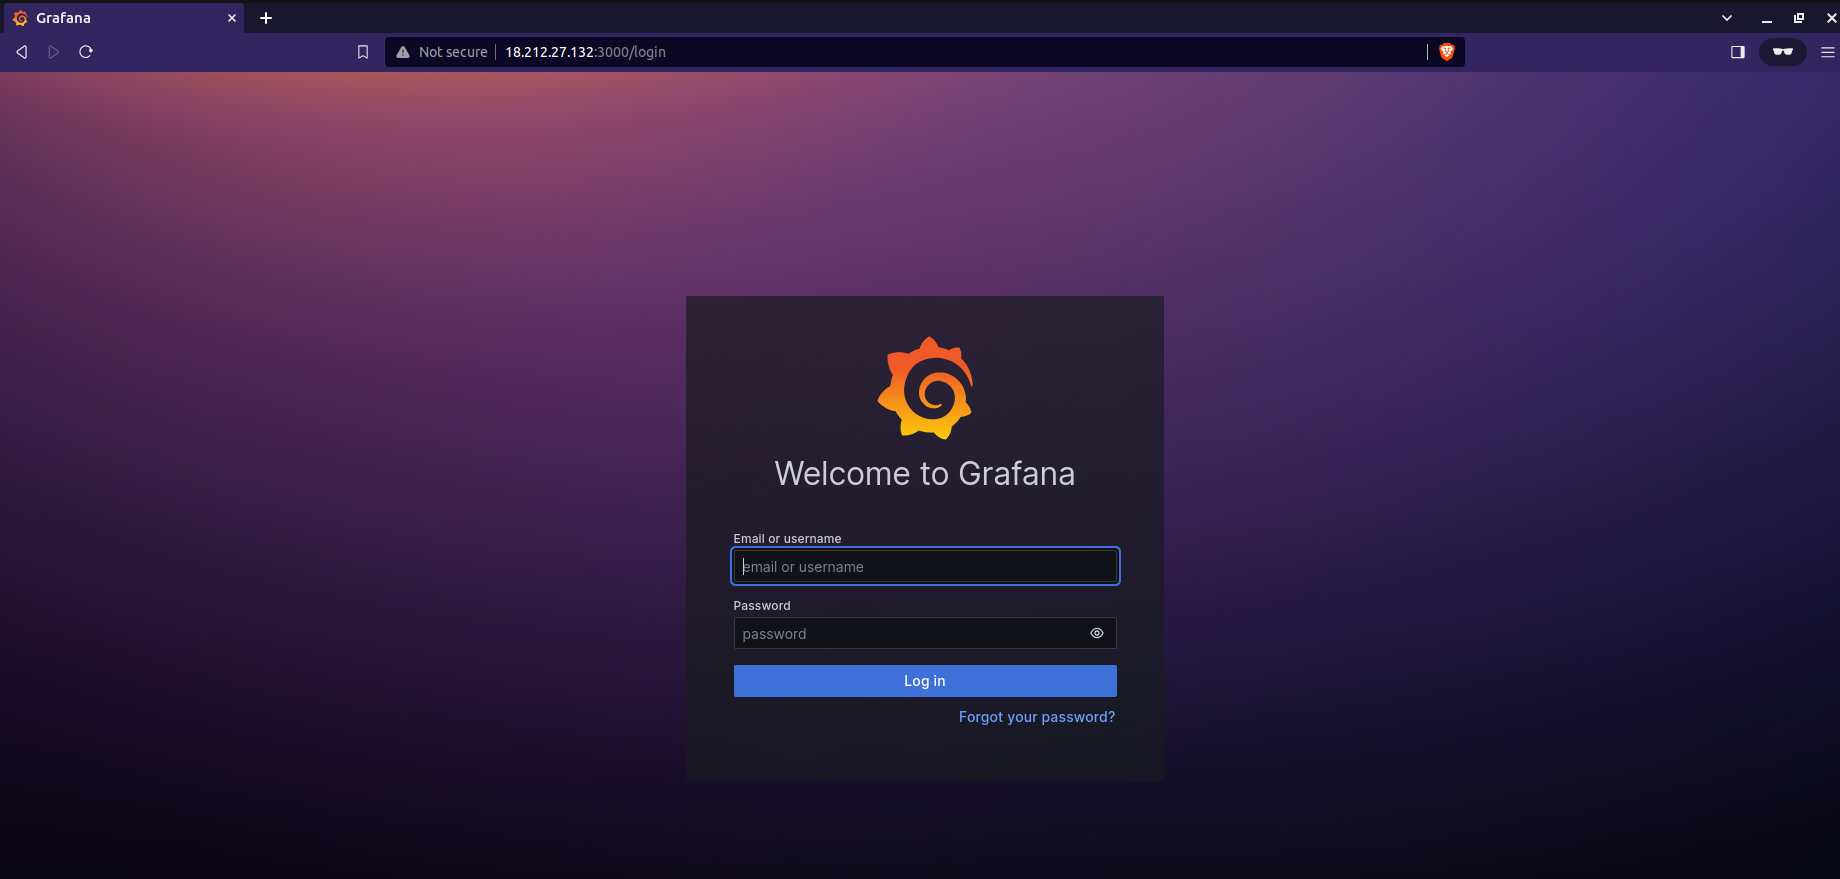
Now we have set the inbound rule for the Grafana, let's access it in the browser.

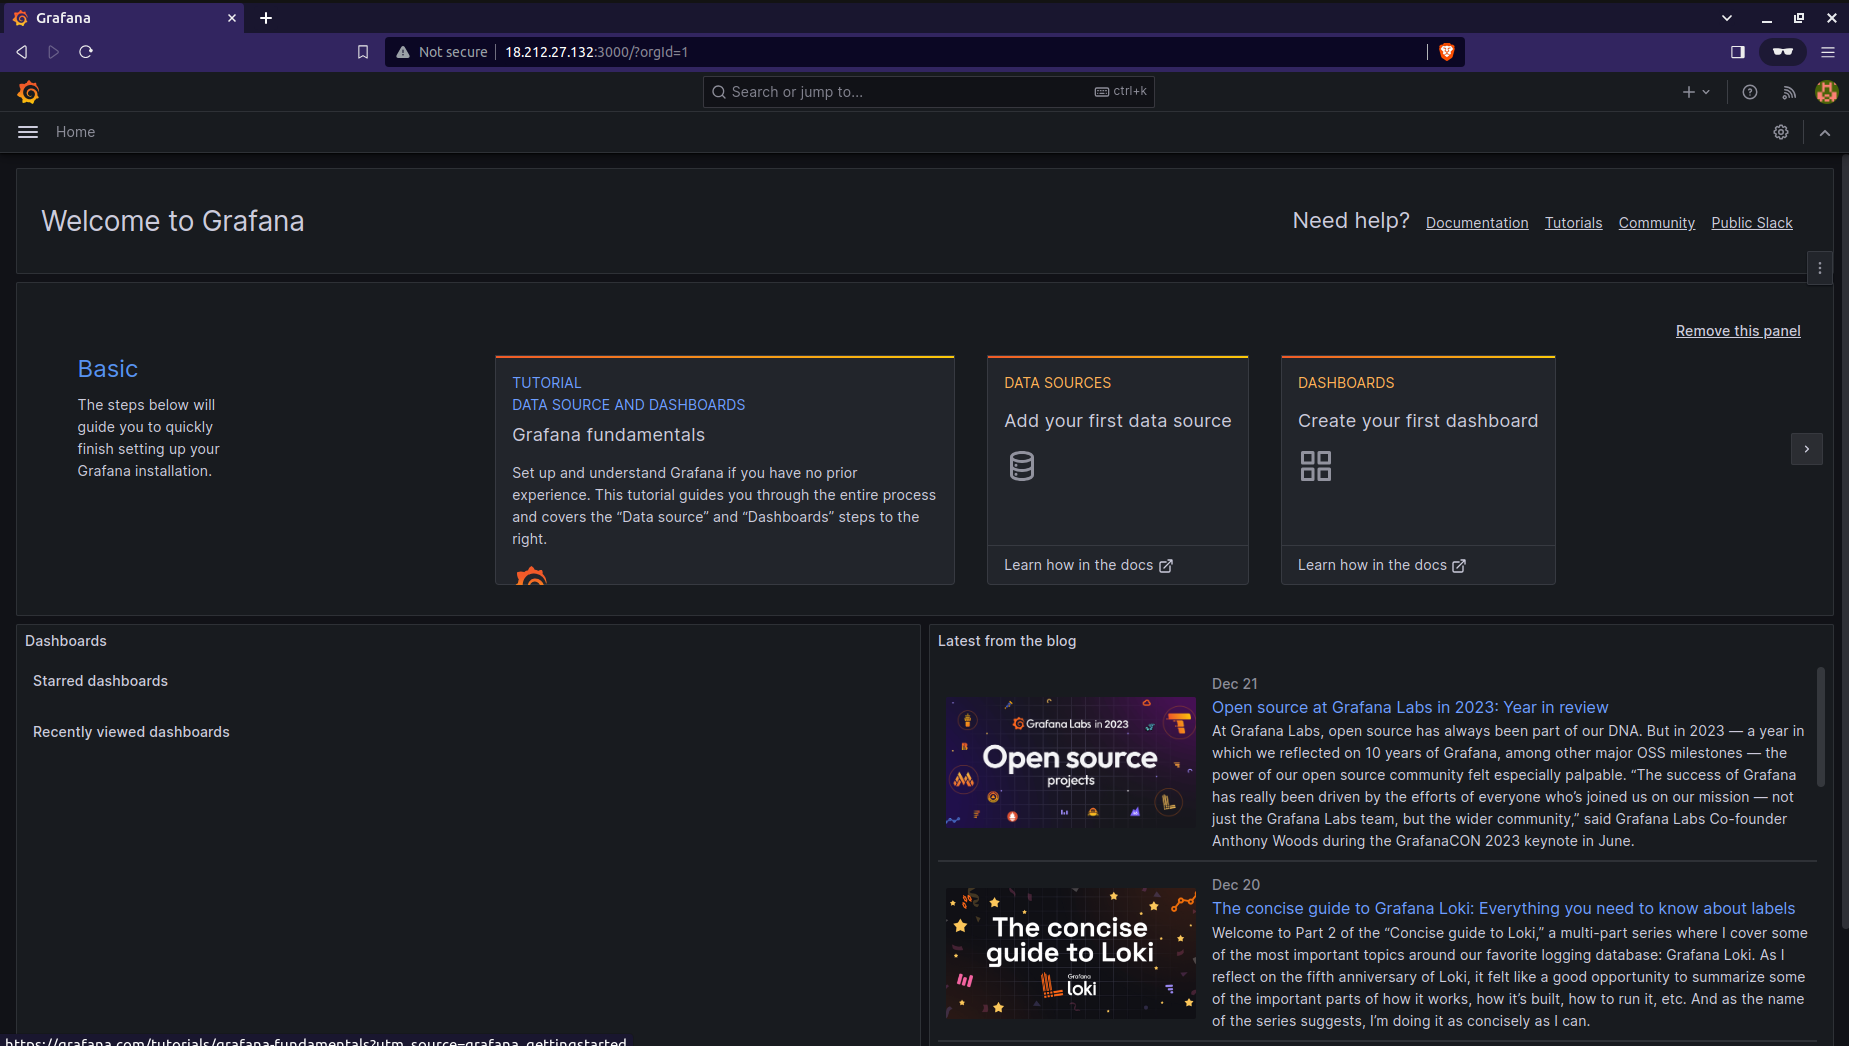
Great news! We've successfully established Grafana on our EC2 instance, and now it's time to dive into the action. By default, the login credentials are set to username "admin" and password "admin." Once you've entered these details, Grafana prompts you to change the password for enhanced security. After updating the password, you gain access to the Grafana main dashboard, opening the door to a world of monitoring and visualization possibilities.

Congratulations, we have completely set up the Grafana in our ec2 instance and is easily accessible at port 3000.
Happy Learning!!
Subscribe to my newsletter
Read articles from Subash Neupane directly inside your inbox. Subscribe to the newsletter, and don't miss out.
Written by

Subash Neupane
Subash Neupane
Computer Science graduate