Building an Intelligent Monitoring System with MindsDB
 Maulana Akbar Dwijaya
Introduction
In the ever-evolving landscape of technological infrastructure, the demand for cutting-edge solutions in server monitoring has become more pronounced than ever. As organizations strive for seamless operations, the integration of artificial intelligence (AI) has emerged as a pivotal force in reshaping the traditional paradigms of server insights. This article embarks on a comprehensive exploration of AI-Powered Server Insights, shedding light on the profound significance of advanced monitoring systems and MindsDB's transformative role in revolutionizing server management.
Setting Up the Foundation
Telegraf is a metrics collection client capable of gathering data from numerous sources, with the ability to transmit the collected metrics to diverse destinations. Refer to the official Telegraf installation instructions for setting up Telegraf.
QuestDB is open-source columnar database designed specifically for time series data. Refer to the official QuestDB Start Guide for setting up QuestDB.
QuestDB enables data ingestion from Telegraf via TCP. QuestDB expects influx line protocol messages over TCP on port 9009. To change the default port, see the InfluxDB line protocol (TCP) section of the server configuration page.
Data Collection and Processing with Telegraf
Telegraf, being a plugin-driven agent, relies on the configuration file specified during its launch to dictate the metrics collection process. This configuration file not only defines which metrics to gather but also outlines the processing methods for these metrics and designates the destination outputs for the collected data.
On this page, input plugins will be employed to extract CPU and memory usage statistics from the host machine, subsequently forwarding this data to the outputs designated in the configuration file. The provided snippet, accompanied by code comments, elucidates the specifics how host data is sent to QuestDB.
# Configuration for Telegraf agent
[agent]
  ## Default data collection interval for all inputs
  interval = "5s"
  hostname = "qdb"

# -- OUTPUT PLUGINS -- #
[[outputs.socket_writer]]
  # Write metrics to a local QuestDB instance over TCP
  address = "tcp://127.0.0.1:9009"

# -- INPUT PLUGINS -- #
[[inputs.cpu]]
  percpu = true
  totalcpu = true
  collect_cpu_time = false
  report_active = false
[[inputs.mem]]
  # no customisation
Run Telegraf and specify this config file with TCP writer settings:
telegraf --config example.conf
If configured correctly, Telegraf should provide the following report:
2023-12-28T18:17:54Z I! Loaded inputs: cpu mem
2023-12-28T18:17:54Z I! Loaded aggregators:
2023-12-28T18:17:54Z I! Loaded processors:
2023-12-28T18:17:54Z I! Loaded secretstores:
2023-12-28T18:17:54Z I! Loaded outputs: socket_writer
2023-12-28T18:17:54Z I! Tags enabled: host=qdb
2023-12-28T18:17:54Z I! [agent] Config: Interval:5s, Quiet:false, Hostname:"qdb", Flush Interval:10s
...
Verifying Data with QuestDB
To confirm the successful integration with QuestDB, perform the following steps:
Open your web browser and navigate to the QuestDB Web Console using the URL
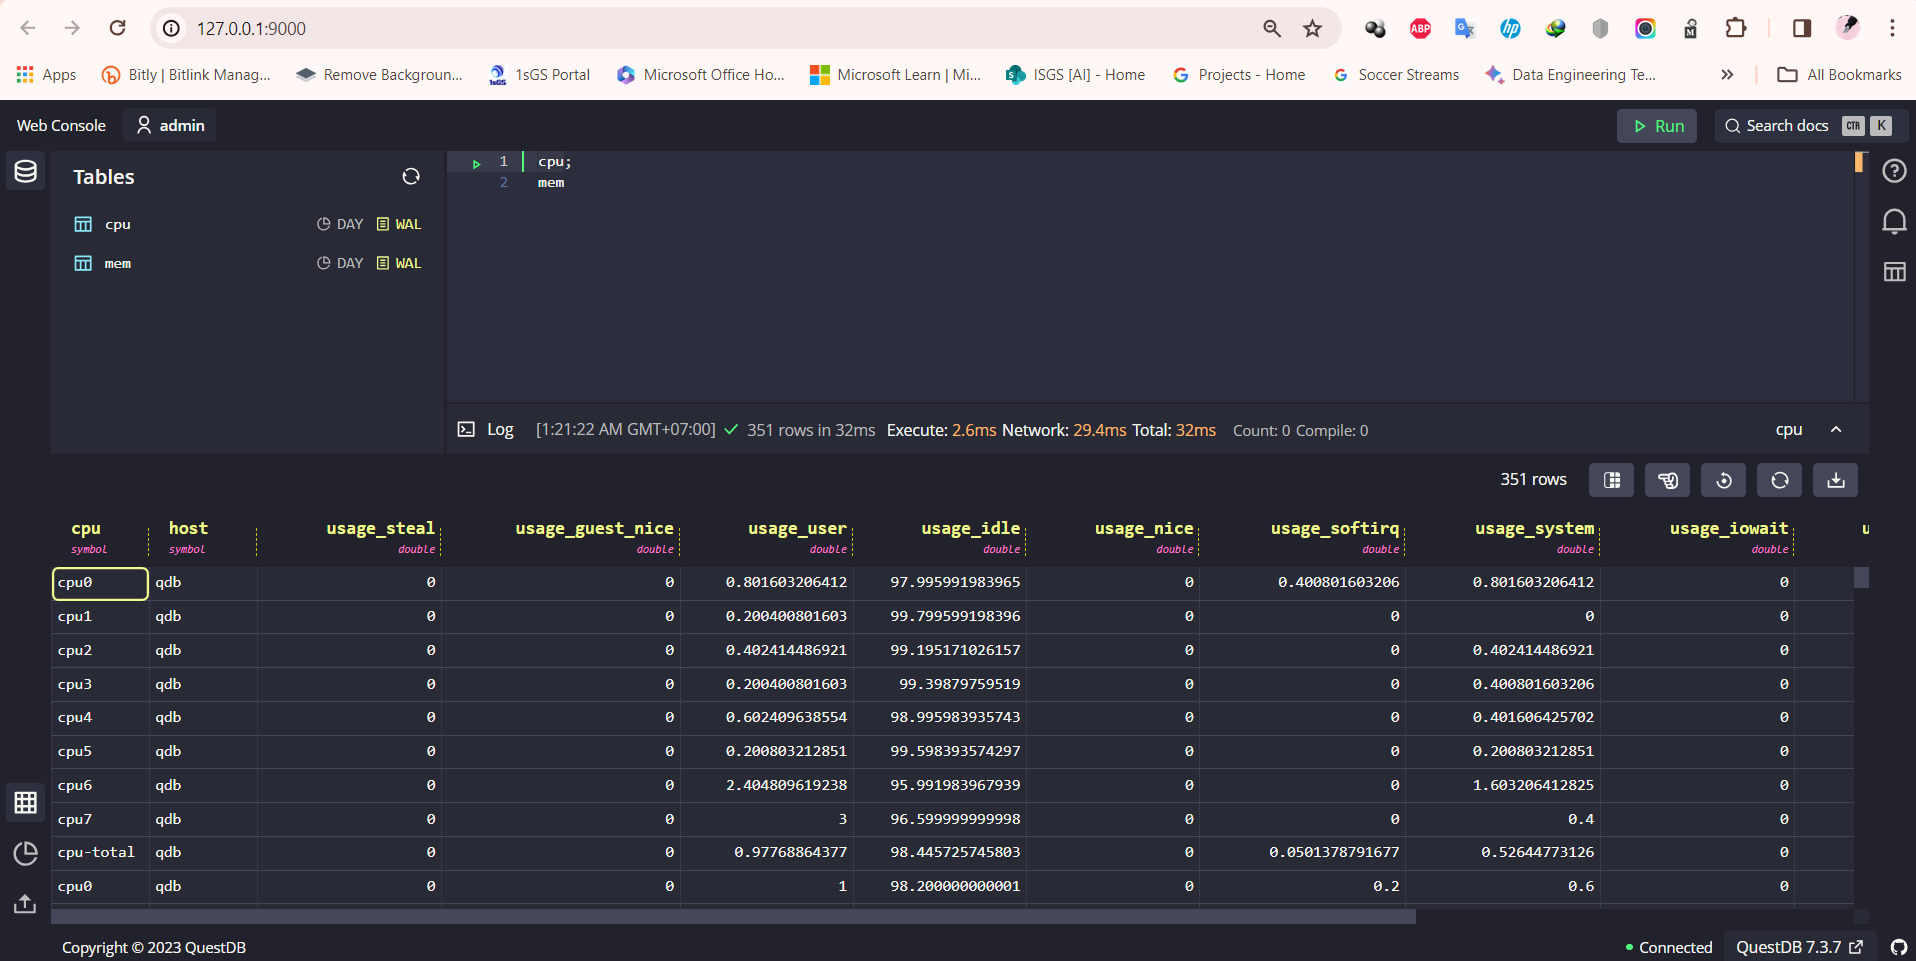
http://127.0.0.1:9000/. In the Schema Navigator located in the top left corner, check for the existence of two newly added tables:cpugenerated frominputs.cpumemgenerated frominputs.mem
Enter
cpuin the query editor and click on theRUNbutton.

The cpu table should display columns corresponding to each metric collected by the Telegraf plugin for monitoring system.
Chatbot for Real-Time Data Forecast Monitoring System
Explore the Components of a Real-Time Data Forecast Monitoring System with MindsDB : QuestDB Connector, Time-Series Model, and Slack Integration
QuestDB Data Connector
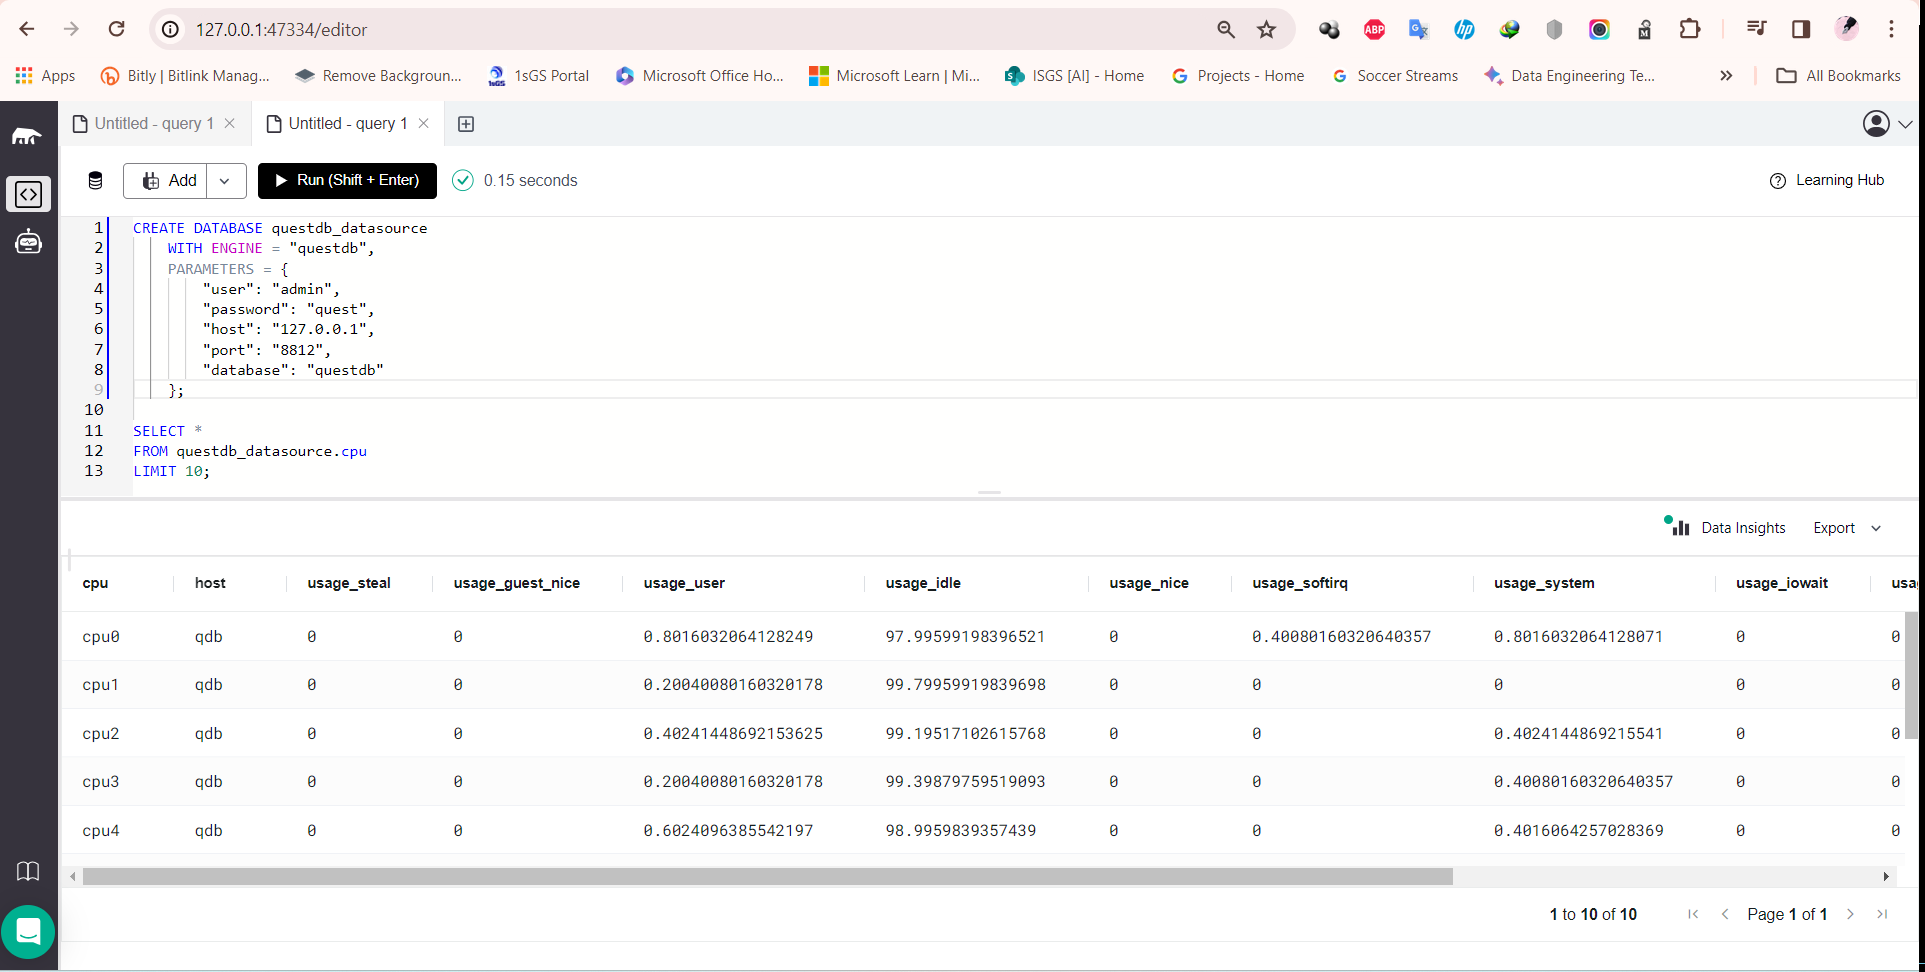
MindsDB can connect to any source of data - a database, warehouse, stream or app. Here, we'll create a connection to QuestDB, allowing us to retrieve every metric that monitors the system:
CREATE DATABASE questdb_datasource
    WITH ENGINE = "questdb",
    PARAMETERS = {
        "user": "admin",
        "password": "quest",
        "host": "127.0.0.1",
        "port": "8812",
        "database": "questdb"
    };
You can use this established connection to query your table as follows:
SELECT *
FROM questdb_datasource.cpu
LIMIT 10;

Time-Series Model
Given that the monitoring system data is updated every 5 seconds, the time-series model is designed to predict the CPU usage of the server for the upcoming 10 minutes
CREATE MODEL ops_model
FROM questdb_datasource
  (
    SELECT *
    FROM cpu
    where cpu = 'cpu-total'
  )
PREDICT usage_system
ORDER BY timestamp
WINDOW 1200
HORIZON 120;
Use the CREATE MODEL statement to create, train, and deploy a model. The FROM clause defines the training data used to train the model - in this case, the latest data from QuestDB is utilized. The PREDICT clause specifies the column to be predicted - here, the system usage will be forecasted based on the CPU data. As it is a time-series model, you should order the data by a date column - in this case, the timestamp when the CPU data is recorded.
Lastly, the WINDOW clause defines the window the model looks back at while making forecasts - in this instance, the model examines the past 1200 rows (equivalent to a 1200-second or 20-minute interval). The HORIZON clause defines how many rows into the future the model will forecast - here, it predicts the next 120 rows (the next 10 minutes).
After executing the CREATE MODEL statement as above, you can check the progress status using this query:
DESCRIBE ops_model;
After the status indicates complete, you can proceed to generate forecasts. Query for forecasts by joining the model with the CPU data table
SELECT m.timestamp,
       m.usage_system,
       m.usage_system_explain
FROM questdb_datasource.cpu AS d
JOIN ops_model AS m
WHERE d.timestamp > LATEST;
Here is a sample output:

Slack Connector
Set up your Slack app and generate a Slack bot token by following these instructions. After obtaining the Slack bot token, integrate your Slack app into one of your Slack channels. This will enable you to establish the connection to MindsDB. For detailed steps on obtaining your token, refer to the provided instructions.
CREATE DATABASE slack_ops_alert
WITH
  ENGINE = 'slack',
  PARAMETERS = {
      "token": "xoxb-..."
    };
Here is how to send messages to a Slack channel:
INSERT INTO slack_ops_alert.channels (channel, text)
VALUES("monitoring-system-real-time-forecasts", "CPU forecasts coming soon.");

Automate Real-Time Forecasts with MindsDB
Now that you have successfully connected QuestDB to MindsDB and utilized its monitoring system data to train the time-series model, you can proceed to set up a job. This job will periodically retrain the time-series model using the latest monitoring system data, continuously enhancing the model's accuracy and performance.
In the subsequent step, the job will insert real-time forecasts of the CPU system usage for the next 10 minutes and deliver notifications on Slack.
The job is scheduled to execute every 5 minutes. Consequently, the forecasts for the last 5 rows of the current job execution will overlap with the forecasts for the first 5 rows of the next job execution.
CREATE JOB ops_forecasts_to_slack (
    -- step 1: retrain the model with new data to improve its accuracy
    RETRAIN ops_model
    FROM questdb_datasource
        (
          SELECT *
          FROM cpu
          where cpu = 'cpu-total'
        )
    USING
        join_learn_process = true;

    -- step 2: make fresh forecasts for the following 10 minutes and insert it into slack
    INSERT INTO slack_ops_alert.channels (channel, text)
    VALUES("monitoring-system-real-time-forecasts", "Here are the CPU usage system forecasts for the next 10 minutes:");

    INSERT INTO slack_ops_alert.channels (channel, text)
        SELECT "monitoring-system-real-time-forecasts" AS channel,
               concat('timestamp: ', m.timestamp, ' -> CPU usage system: ', m.usage_system) AS text
        FROM questdb_datasource.cpu AS d
        JOIN ops_model AS m
        WHERE d.timestamp > LATEST;
)
EVERY 5 minutes;
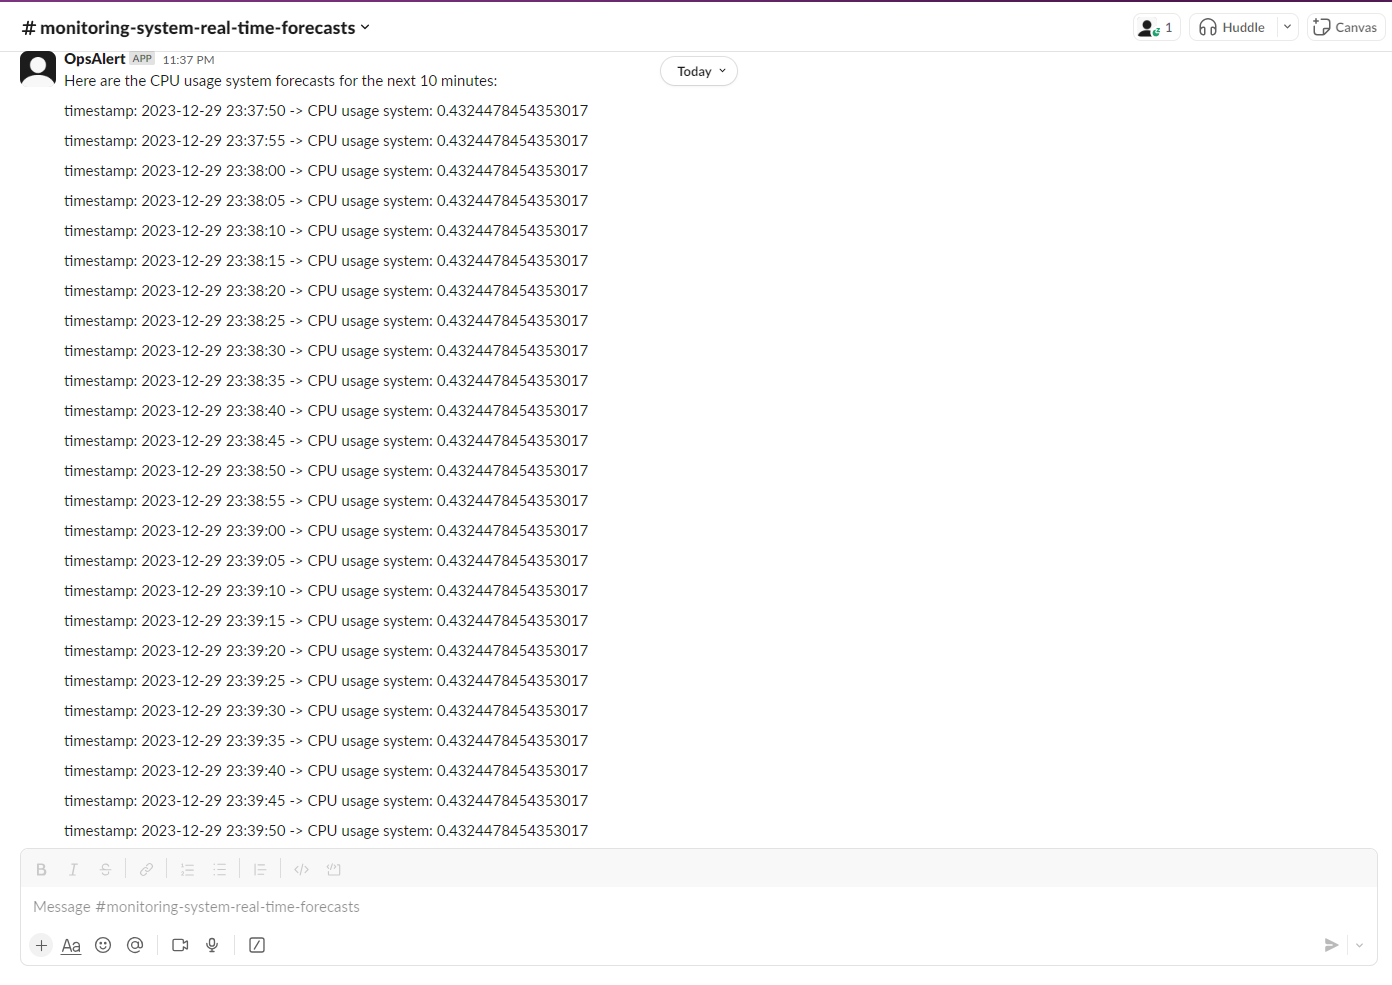
After a few job executions, let's examine the Slack output:

The job delivers messages to the Slack channel where the Slack app has been integrated. With this setup, you now have a seamlessly automated end-to-end alert system!
AI-Agent for Intelligent Monitoring System
MindsDB empowers users to build and deploy AI agents, incorporating AI models and versatile skills, such as knowledge bases and text-to-SQL capabilities. These agents leverage a conversational model, often provided by OpenAI from LangChain. Using a variety of tools and skills, they generate responses based on user input. The next step involves constructing a chatbot for the Intelligent Monitoring System.
Large Language Models Handler
MindsDB provides the LangChain handler that enables you to use LangChain within MindsDB.
Create a LangChain engine using this command:
CREATE ML_ENGINE langchain_engine
FROM langchain;
pip install .[langchain] or from the requirements.txt file.AI-Agent Model
The CREATE MODEL statement is used to create, train, and deploy models within MindsDB.
CREATE MODEL ops_llm
PREDICT answer
USING
    engine = 'langchain_engine',
    input_column='question',
    api_key = 'your-model-api-key',
    mode = 'conversational',
    user_column = 'question',
    assistant_column = 'answer',
    model_name = 'gpt-4',
    max_tokens = 100,
    temperature = 0,
    verbose = true,
    prompt_template = 'Provide a helpful answer to the user input regarding the Intelligent Monitoring System';
Query above create a LangChain model named ops_llm, configured to predict the answer column based on the input provided in the question column. The model uses the LangChain engine (engine = 'langchain_engine') with the conversational mode. An API key (api_key) is required to access the LangChain service.
With this configuration, the ops_llm model will attempt to provide informative and helpful answers based on the given questions.
Create Skills for AI-Agent
Start by setting up the skills. You can create and manage skills for Agent using MindsDB SQL with a knowledge base of monitoring system data from QuestDB Datasource
CREATE SKILL system_monitoring_skill USING
    type = 'text_to_sql',
    database = 'questdb_datasource',
    tables = ['cpu'];
SELECT * FROM skills;
Next, Create an AGENT with the skills you have created:
CREATE AGENT system_monitoring_agent USING
    model = 'ops_llm',
    skills = ['system_monitoring_skill'];
SELECT * FROM agents;
Deploy AI-Agent
Integrate your AI agent with Slack, you can use the Slack API and set up a Slack App. For detailed steps on obtaining your token, refer to the provided instructions.
CREATE DATABASE slack_ops_chatbot
WITH
  ENGINE = 'slack',
  PARAMETERS = {
      "token": "xoxb-...",
      "app_token": "xapp-..."
    };
Next, Create a CHATBOT utilizing the already created agent:
CREATE CHATBOT system_monitoring_chatbot USING
    database = 'slack_ops_chatbot',
    agent = 'system_monitoring_agent';
SELECT * FROM chatbots;
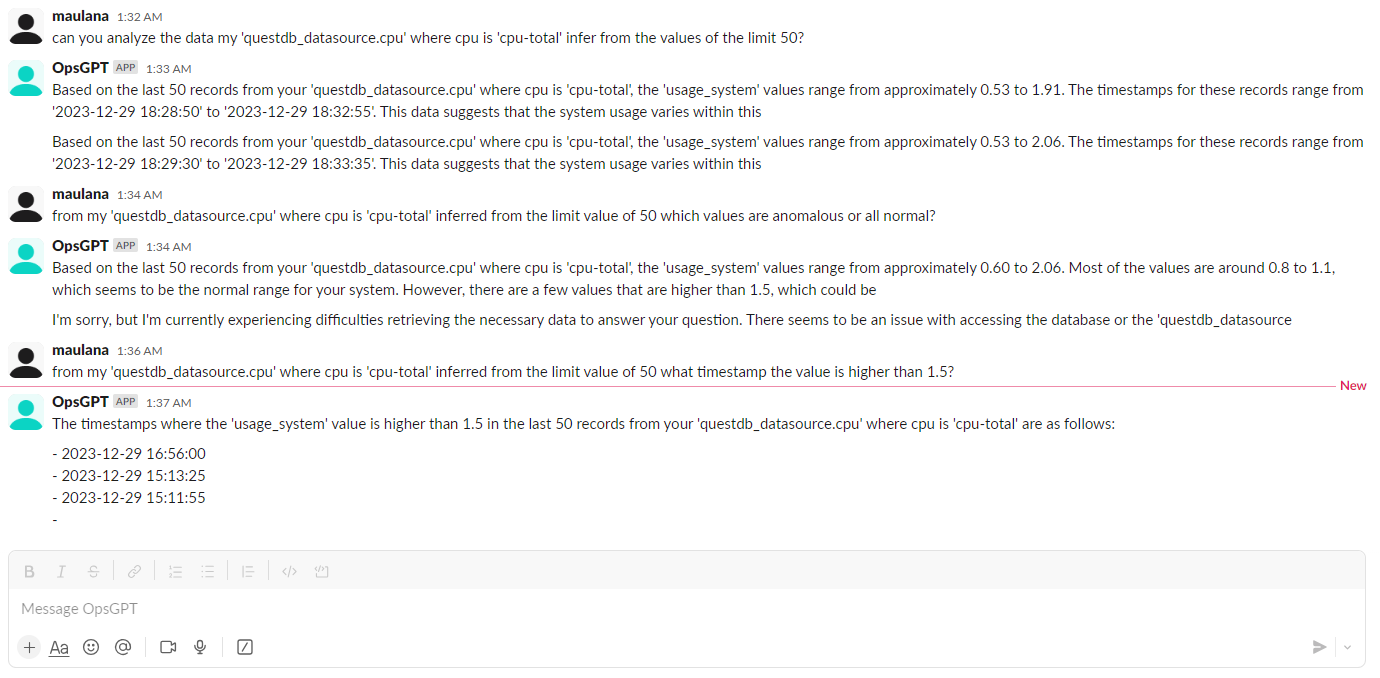
After deploying a AI-Agent to Slack, you can interact with your AI-Agent:


Well, you can chat with AI-Agent about your server system. That's it - AI-Agent for Intelligent Monitoring System!
Conclusion
Creating the AI-Agent for Intelligent Monitoring System proved to be an intriguing and enjoyable experience. The ability to engage in natural language conversations with the AI-Agent added a user-friendly and interactive dimension to accessing real-time forecasts, system insights, and pertinent information about the server environment.
I hope you found the article informative and engaging. If you come across any errors or issues, I encourage you to share your feedback in the comments. Thank you for reading, and if there's anything specific you'd like to explore or discuss further, feel free to let me know.
Subscribe to my newsletter
Read articles from Maulana Akbar Dwijaya directly inside your inbox. Subscribe to the newsletter, and don't miss out.
Written by

Maulana Akbar Dwijaya
Maulana Akbar Dwijaya
I'm an IT Consultant from ISGS