Creating a Custom Prometheus Alert to Notify on Python Application Errors
 Ankit Singh
Use Case:-
In a real-time use case, let's consider a scenario where you have a critical Python application running in a production environment, and you want to be notified immediately whenever an error occurs. You can use Prometheus to monitor the error count and set up an alert that triggers a notification.
Step Up:-
Download & setup the Prometheus & Alertmanager on your system from official documentation. https://prometheus.io/download/
After completing the initial setup you can start the prometheus & alertmanager using the commands ./prometheus & ./alertmanager.
You can access prometheus at https://localhost:9090 & alertmanager at https://localhost:9093
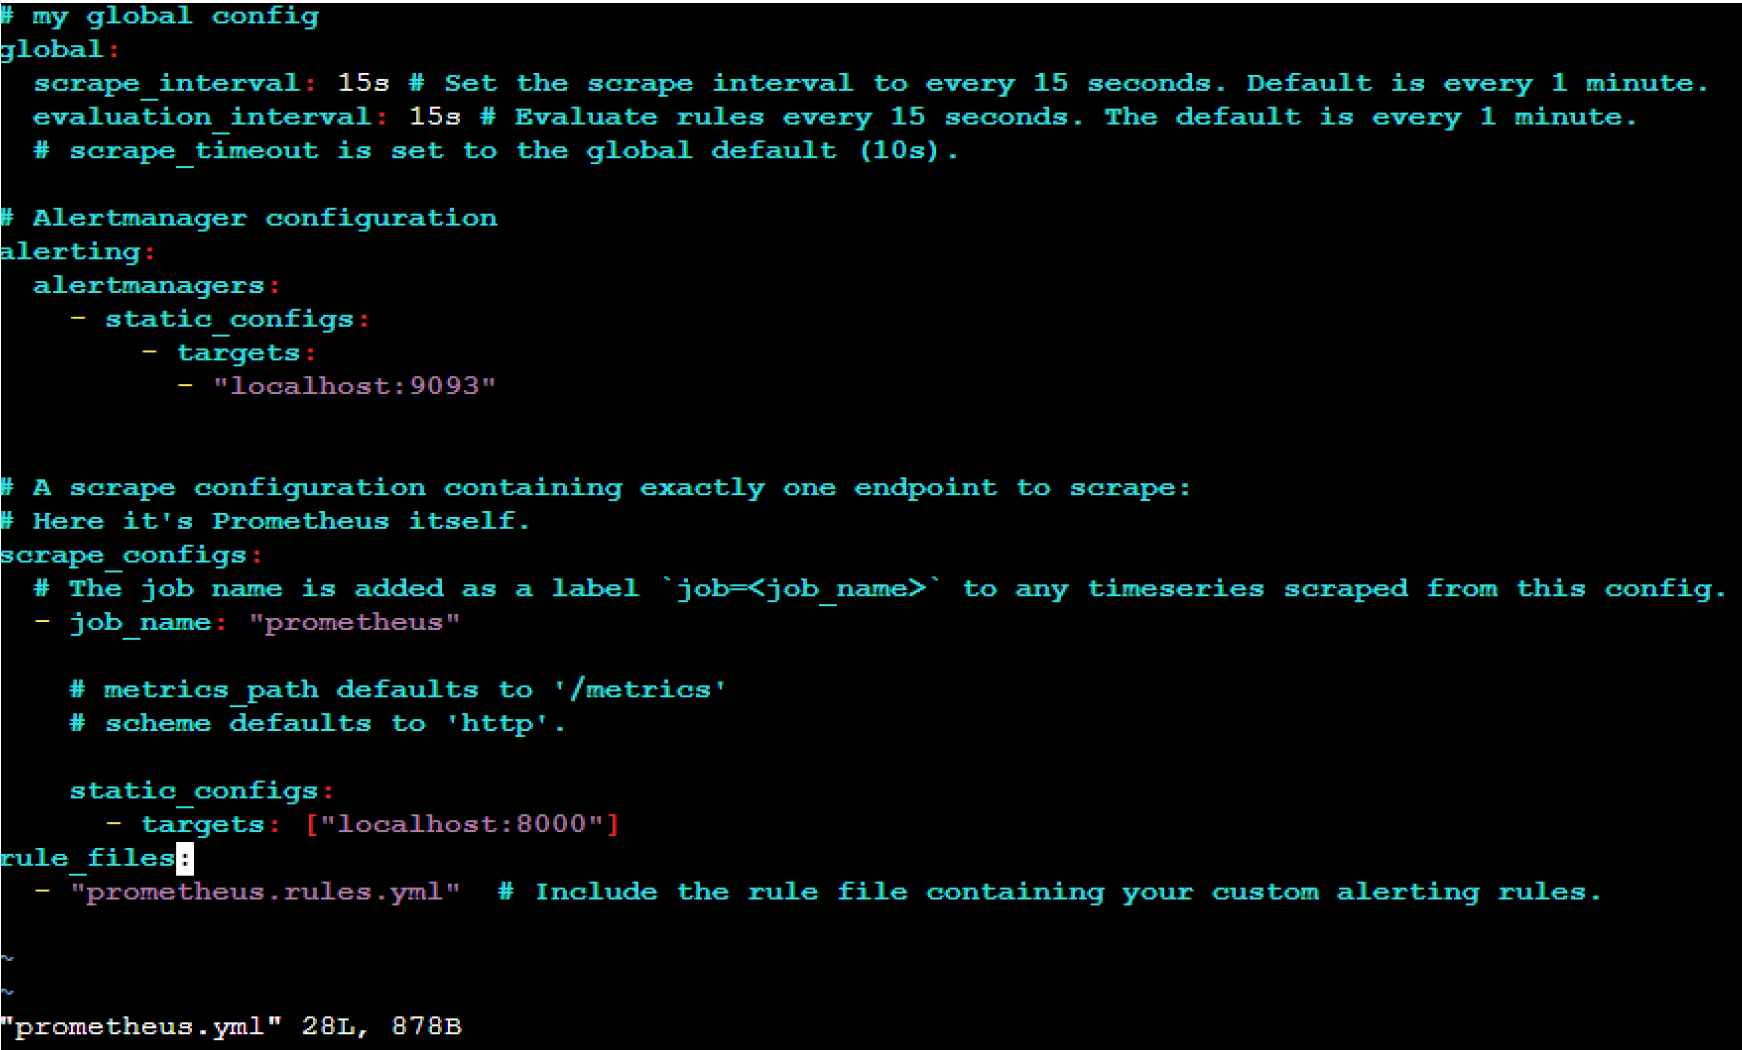
Specify the targets: ["localhost:8000"] in the prometheus.yml file as the metrics for the python will be exposed at http://localhost:8000/metrics .
Install prometheus_client library on your server & Write down the python script file on the basis of which the alert should be triggered.
from prometheus_client import start_http_server, Counter
import random
import time

error_counter = Counter('my_python code errors total', 'Number of errors encountered in the application')

def simulate_error():
    if random.random() < 0.3:
        raise Exception("Something went wrong!")

if __name__== "__main__":
    start_http_server (8000)
    while True:
        try:
            simulate_error()
        except Exception as e:
            error_counter.inc()
            print("Error occurred: (e)")
        time.sleep(5)
- Below is the prometheus.rules.yml which specify the threshold for alarm trigger.
groups:
- name: my_python_code_alert_rules
  rules:
- alert: PythonCodeError
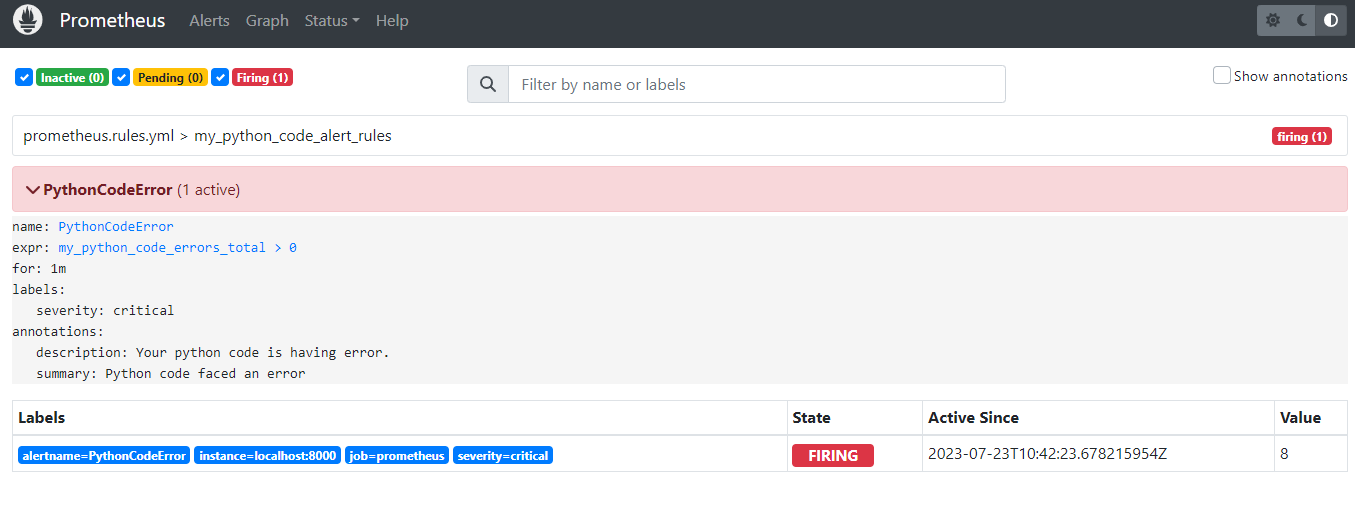
  expr: my_python_code_errors_total > 0
  for: 1m
  labels:
    severity: critical
  annotations:
    summary: "Python code faced an error"
    description: "Your python code is having error."
- specify the above file in the prometheus.yml in the rule_files section.

- Now specify the sender & receiver email address & credentials for email alarm notification.
route:
  group_by: ['alertname']
  group_wait: 30s
  group interval: 5m
  repeat_interval: 1h
  receiver: 'send email'
receivers:
- name: 'send email'
  email configs:
  - to: < Your email ID >
    from: < Sender email ID >
    smarthost: smtp.gmail.com:587
    auth username: < Username >
    auth_password: < Password >
    require_tls: true
Execute your python script to generate an intentional error.
The error will shown as in the pending state of the prometheus alert.

- After one minute it will be in the firing state where the alert will be sent to alertmanager based on the metrics.

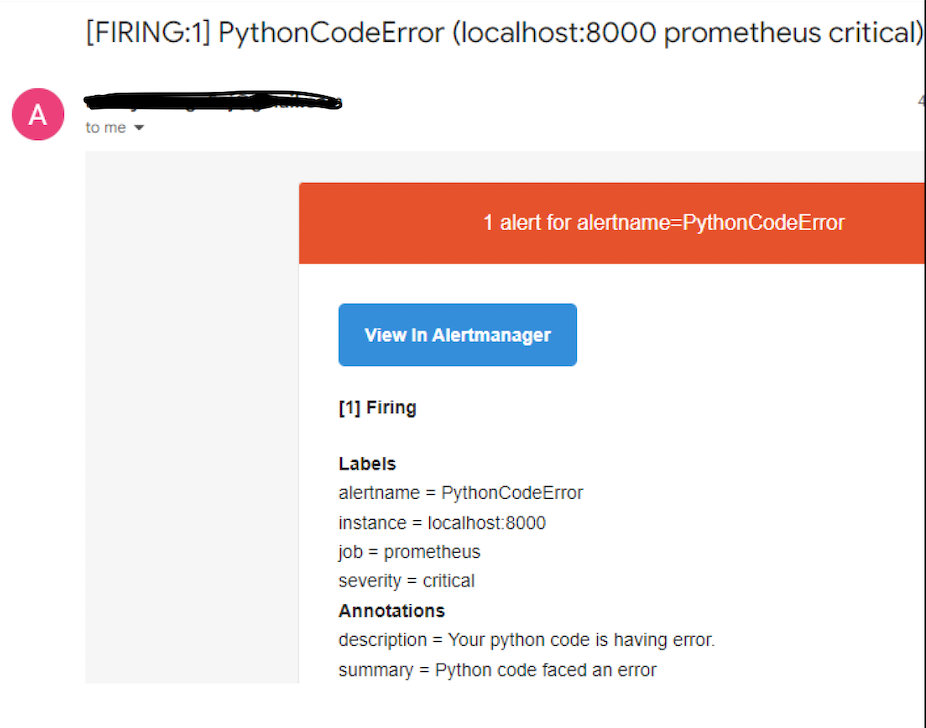
- After the firing stage if everything worked right you will receive an email alert on the receiver email address.

Conclusion:-
- In conclusion, by integrating Prometheus and Alertmanager into your system, you've established a robust monitoring and alerting framework for your critical Python application. The defined alerting rules, coupled with email notification configuration, ensure swift detection and notification of errors. This proactive approach allows you to address issues promptly, enhancing the reliability and performance of your production environment.
Subscribe to my newsletter
Read articles from Ankit Singh directly inside your inbox. Subscribe to the newsletter, and don't miss out.
Written by

Ankit Singh
Ankit Singh
I am a DevOps engineer looking to exchange knowledge and gain insights from fellow professionals.