Top 4 Data Modeling Best Practices for Effective Analytics
 DataClear Consult
Introduction
In the realm of data analytics, data modeling stands as a critical process, forming the backbone of data analysis and business intelligence. A well-structured data model is key to ensuring data integrity, enhancing performance, and enabling accurate, actionable insights. In this article, we explore best practices in data modeling to guide professionals in creating robust, scalable, and efficient data models.
Understanding Data Modeling
Data modeling is a process of creating a visual representation of data and its relationships. It is used to define and analyze data requirements needed to support the business processes. It is a theoretical representation of data objects, the associations between different data objects, and the rules. Data models help in defining and formatting high-quality, integrated data.
Before diving into data modeling best practices, it's crucial to have clarity in business requirements. The foundation of effective data modeling lies in thoroughly understanding business requirements. Engaging with stakeholders to grasp the data’s purpose ensures the model aligns with business objectives. This practice minimizes revisions and aligns the model with end-user needs. Here are Top 4 Data Modeling Best Practices:
Avoid Wide Tables:
When it comes to efficient data modeling, one fundamental principle is to avoid creating tables with an excessively large number of columns – known as "wide tables." Wide tables can lead to several issues that hinder the performance and scalability of your database.
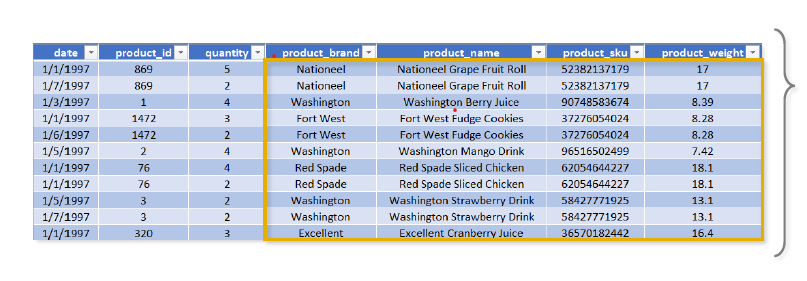
When you don't normalize, you end up with tables like this—one above; all of the rows with duplicate product info could be eliminated with a lookup table or dimension table on product id. This concept is known as Database Normalization. Normalization is the process of organizing the tables and columns in a relational database to reduce redundancy and preserve data integrity. It is commonly used to:
Eliminate redundant data to decrease table sizes and improve processing speed and efficiency.
Minimize errors and anomalies to data modifications (Inserting, Updating or deleting records).
Simplify queries and structure the data for meaningful analysis.
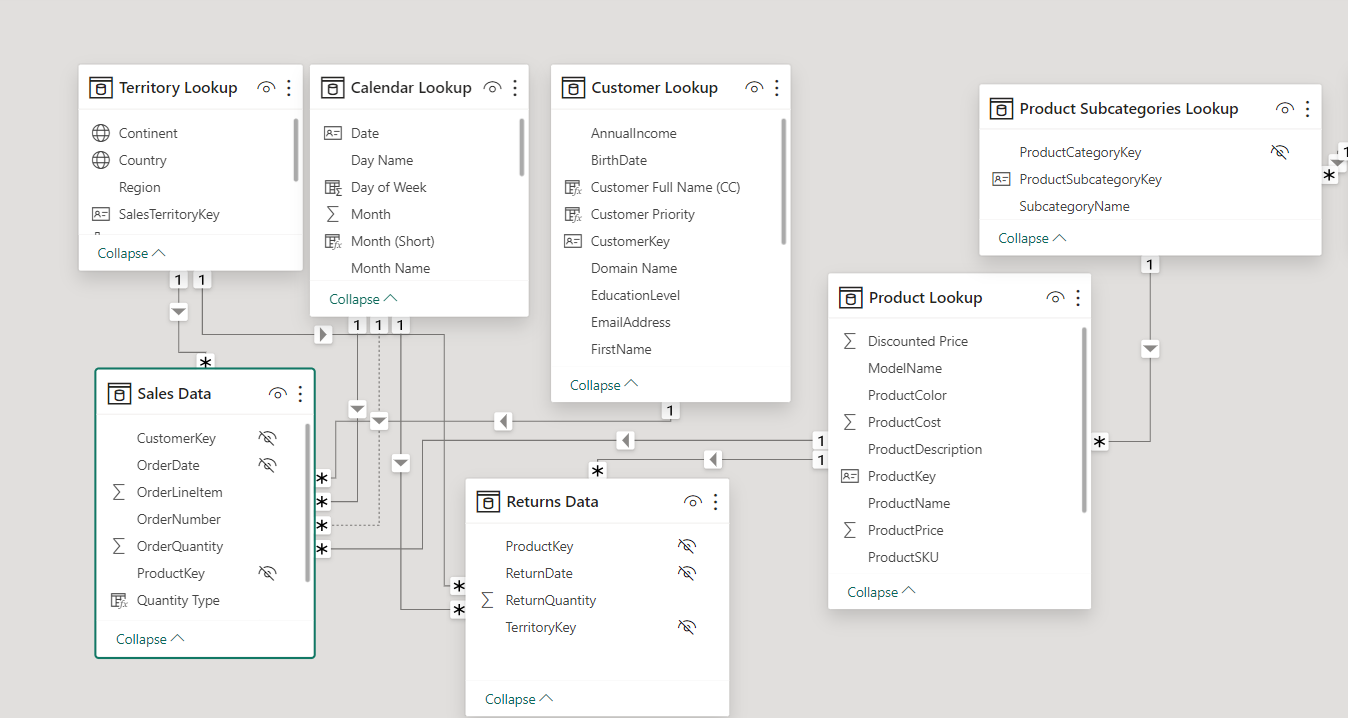
TIP: In a normalized database, each table should serve a distinct and specific purpose (i.e. product information, dates, transaction records, customer attributes, etc..). A good example of a normalized database is shown below:
Choose a Schema Type:
Selecting the right database schema is critical for data modeling as it determines how data is stored, organized, and accessed. The choice between a star schema, snowflake schema, or a more normalized form like the third normal form (3NF) depends on specific use cases and performance needs.
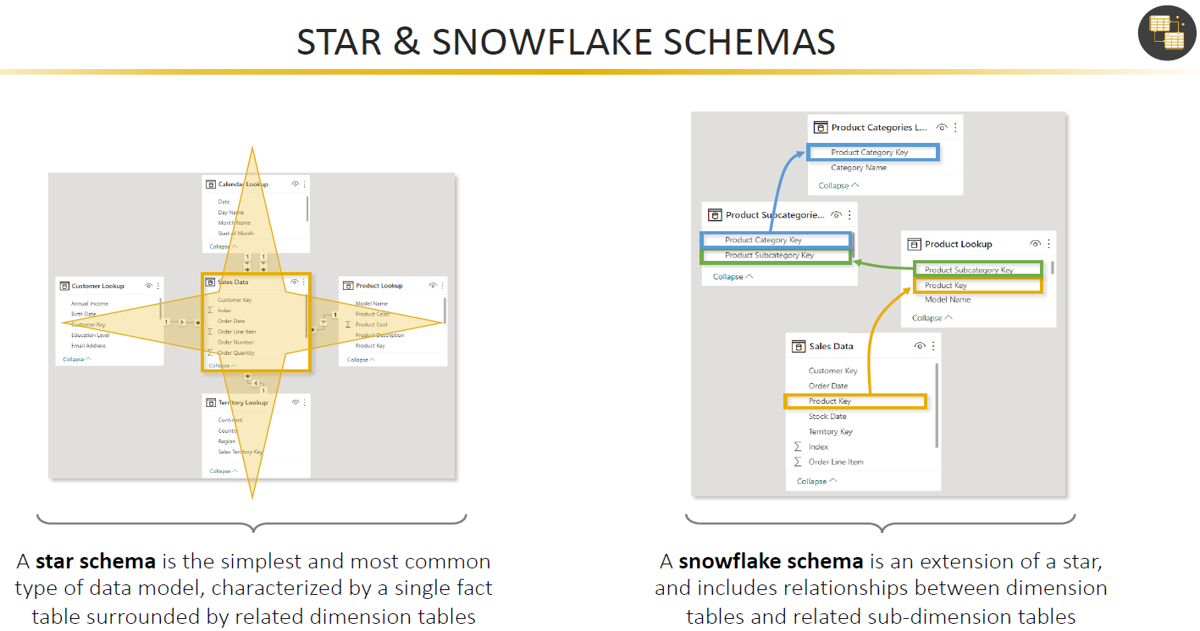
Star Schema: Characterized by a central fact table connected to several dimension tables, the star schema is ideal for simple, fast query operations and is widely used in data warehousing and business intelligence applications. It simplifies the data model and is generally easier for end-users to understand.
Snowflake Schema: An extension of the star schema where dimension tables are normalized, breaking down into additional tables. This schema can lead to more complex queries but offers advantages in terms of data redundancy and potentially, storage space.
3NF and Beyond: Normalized schemas, such as those following the third normal form, prioritize reducing data redundancy and improving data integrity by ensuring that every non-key column is not only dependent on the primary key but also independent of every other column. This approach is beneficial for transactional databases where data consistency and integrity are paramount.
The Star and Snowflake are most common Schema Type. When choosing a schema type, consider the following:
Query Performance: Star schemas generally provide better performance for read-heavy analytical queries.
Data Integrity and Normalization: If the integrity of transactional data is a priority, a normalized schema is usually preferred.
Complexity and Maintenance: Star schemas are simpler to maintain and navigate, making them user-friendly for reporting and analysis.
Storage Space: Although less of a concern with today's storage capabilities, snowflake and normalized schemas can be more space-efficient.
Data Update Frequency: In scenarios with frequent data updates, normalized schemas can be more efficient and less error-prone.
Understand your organization's reporting needs, data operations, and maintenance capabilities to choose the most appropriate schema. In some cases, a hybrid approach might be the best solution, combining aspects of star and snowflake schemas to balance performance with normalization.
Use Primary Keys for Filtering & Disable foreign keys from fact tables:
A key principle in data modeling, especially within dimensional modeling used in data warehousing, is to filter queries using primary keys from the dimension (lookup) tables rather than foreign keys in the fact tables.
Data Integrity: This is the most important reason why you should filter using primary keys from the lookup tables. Primary keys in dimension tables are unique identifiers for dimension records, ensuring that filters based on these keys yield precise results. Relying on foreign keys in fact tables can yield misleading and inaccurate data.
Optimized Query Performance: Dimension tables are typically smaller and their primary keys are indexed, which means that filtering based on these keys is much faster. Fact tables can be very large, and filtering on foreign keys can lead to slower query performance.
Simplicity in Query Design: Filtering on primary keys simplifies the query logic. It makes queries easier to understand and maintain since the primary keys represent the unique entities in dimension tables.
Consistent Results: Using primary keys for filtering ensures that the resulting dataset is consistent and reliable. Dimension tables are structured to provide context to the numerical metrics in fact tables, and primary keys serve as the definitive reference points for this context.
PS: Lookup tables are also known as dimension tables and Fact tables are also known as Data tables.
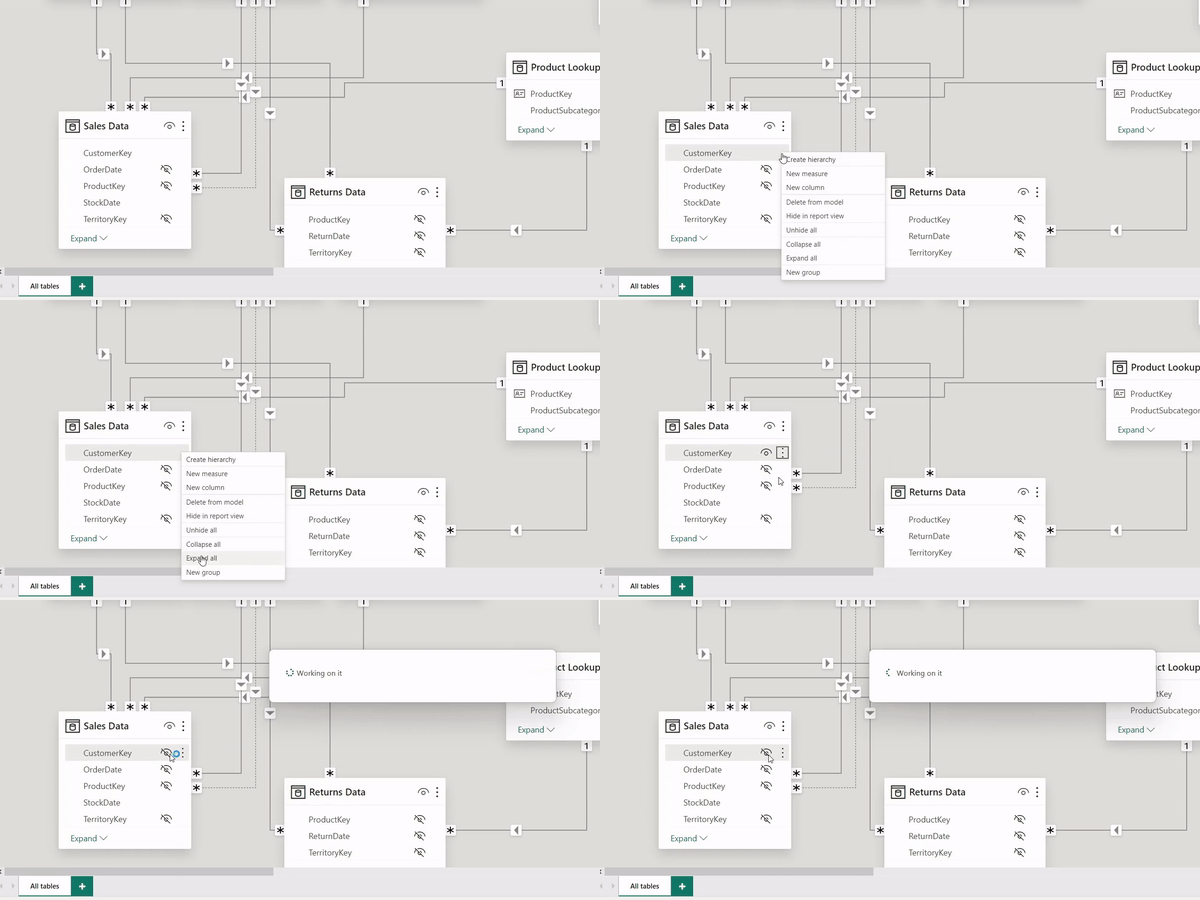
To effectively implement this practice, Power BI has an inbuilt feature "Hide in Report View" which helps hide these foreign keys from the report. This means dashboard users won't be able to see these foreign keys from the front end let alone having to mistakenly filter using these fields. This not only streamlines the query process but also aligns with the relational database design principle. By following this approach, your data models will be cleaner, your databases will perform better, and end-users will have a more seamless experience when running queries.
Streamline Power BI Models with 'Collapse All' Option:
I can safely say, not may Power BI users are aware of this option probably they are aware but just haven't used it yet but it is a powerful one that can help you save a lot of time most especially when working on a complex model. In Power BI's model view, the 'Collapse All' feature is an invaluable tool for those looking to streamline their visual workspace.
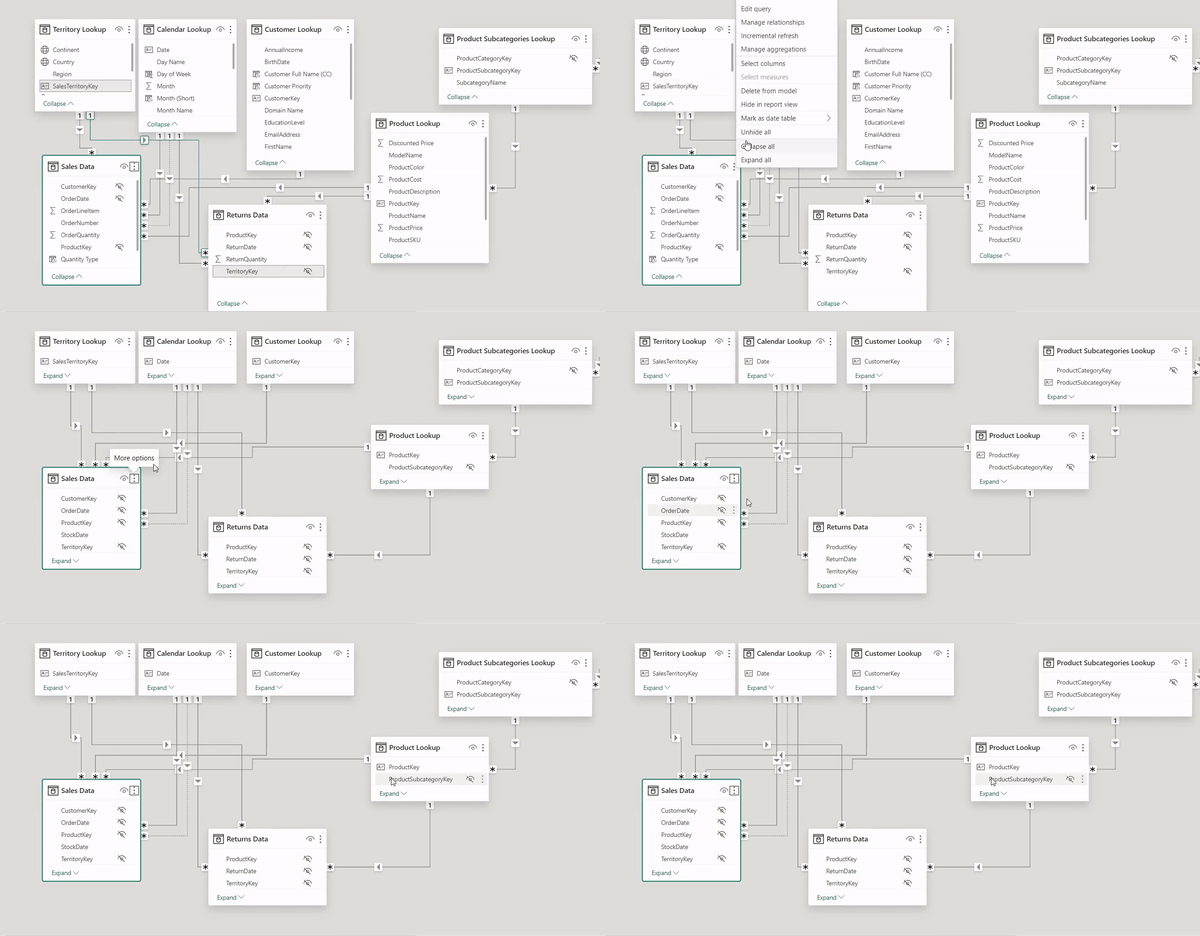
Enhanced Clarity: When you use 'Collapse All', Power BI minimizes each table to display only the key fields used for table relationships. This decluttering makes complex data models easier to navigate and understand at a glance.
Focus on Relationships: By collapsing tables to show only connection points, you can focus on the relationships and data flow between tables, which is essential for validating your model's integrity and design.
Easier Management: A simplified view aids in managing and revising the model, particularly in identifying and addressing any issues with table relationships or in planning how new data elements should be integrated.
Improved Collaboration: When sharing your model with colleagues, a collapsed view can help others quickly grasp the model's structure without getting overwhelmed by the details of each table.
Remember, while 'Collapse All' is great for visual management and simplification, the full details of each table are still accessible when needed. This balance between detail and abstraction is key to effective data model management in Power BI.
Conclusion:
Effective data modeling is both an art and a science. It requires a blend of technical proficiency, strategic thinking, and a clear understanding of the data's role in driving business insights. By adhering to best practices—such as avoiding wide tables, selecting the appropriate schema, filtering using primary keys, and utilizing features like Power BI's 'Collapse All'—data professionals can construct models that are not only robust and scalable but also intuitive and aligned with business objectives.
The journey to mastering data modeling is continuous. As technologies evolve and business needs change, so too must our approaches to organizing and analyzing data. Yet, the principles discussed here provide a solid foundation upon which to build and refine your data modeling expertise. Embrace these practices, and you will be well on your way to creating data models that are not just functional but also pivotal in turning data into actionable business solutions.
Did we overlook any essential data modeling tips? We welcome your expertise and suggestions, so please share your thoughts in the comments section below!
Subscribe to my newsletter
Read articles from DataClear Consult directly inside your inbox. Subscribe to the newsletter, and don't miss out.
Written by

DataClear Consult
DataClear Consult
DataClear Consult is a leading Data Science and Analytics Consulting firm that specializes in providing cutting-edge and scalable solutions to business problems through data-driven clarity and valuable insights. Our goal is to be at the forefront of driving positive transformations for businesses through innovative data solutions and consulting expertise.