How To Check The Performance Of Your Code in Python | Ft Timeit and cProfile module
 Vishnu Tiwari
Whenever we write code for a product, project, or any service we are working on, the next step before committing or pushing changes in the Version Control System (VCS) is to check the performance, often referred to as benchmarking. It is a crucial part of code optimization.

Why it is crucial?
Just imagine working on a feature for a product that is expected to be used by 3000-4000 users. For example, you write one piece of code that takes 15 seconds to complete a certain task. Afterward, you optimize the code, and now it performs the same task in 10 seconds. Initially, you might think it's just a 5-second difference, not much. However, if you calculate the impact, considering one user visiting that feature three times a day, resulting in 15 seconds saved daily, 7.5 minutes saved monthly, and 1.5 hours saved annually. If the product is used by 4000 users, this amounts to 6000 hours saved.
This means even a small improvement in your code could save a considerable amount of time for the customer. In the modern world, we all know that time is equivalent to real money.
But optimizing the code is boring asf!!!!

I know it looks boring but trust me, it won't be boring if you play it like a game. Think of each optimization as leveling up in your coding adventure. 🚀💻
Some intellectual says we are also saving energy by optimizing the code as optimized code requires fewer resources since it also contributes to energy efficiency. It aligns with the trend towards more sustainable computing practices.
Having grasped the significance of code performance and profiling, let's delve into the methods for measuring how well our code performs.
timeit Module - for small snippets of code
Purpose:
timeitis designed for measuring the execution time of small code snippets or functions.Usage: It's suitable for quick and simple measurements to get an idea of how long it takes to run a specific piece of code.
The timeit module in Python provides a simple way to measure the execution time of small bits of Python code. It is particularly useful for assessing the performance of specific code snippets or functions. The timeit module can be employed both in the command line and within scripts to obtain accurate timing information. It helps in evaluating the efficiency of different implementations and aids in making informed decisions regarding code optimization.
And I just want to stress that timeit should be used strictly for small snippets of code.
timeit runs the code multiple times and calculates the average time taken. This helps in getting more reliable and repeatable results, especially for short-running code where the timing might be affected by other processes running on the system.
Let's see how we can use timeit to check the code performance.
Here am importing three modules
import timeit # timeit module
import time
import random
I imported 3 modules, now let's take a simple example and check which is the fastest from two inbuilt random function
random.randint(a, b):This function is used to generate a random integer between the specified range
[a, b].random.random():It gives a random float between 0 and 1
Let's test which one is fast between these two.
import timeit
import random
import time

"""
There are two inbuilt function in random which is
1. random.randint
2. random.random

1. it gives the random number between two numbers which user provides.
2. it gives random float between 0 and 1.
"""

print(random.randint(1,2))
print(random.random())


randint_checker = timeit.timeit(stmt='random.randint(0,5)',
                                setup='import random',
                                number=100_000)

random_checker = timeit.timeit(stmt='random.random()',
                               setup='import random',
                               number=100_000)

print(f'Time of randint function is {round(randint_checker,4)} '
      f'\nTime of random function is {round(random_checker,4)}')

print(f'We can clearly see {"random function" if random_checker < randint_checker else "RandInt"}'
      f' as high in performance.')

Let me explain the code for a bit.
The
stmtparameter intimeit.timeitis the statement that will be executed and timed. In your case, it's the function callsrandom.randint(0,5)andrandom.random().The
setupparameter is used to set up the environment before running the timed code. In your case, it imports therandommodule.The
numberparameter specifies the number of times the statement should be executed for each timing measurement. By default it sets to 1 millionThe results are printed, and the code determines which function is faster based on the execution times.
Now let's get back to the real scenarios, eg: you wrote two functions to perform the same task and you want to find out which one is fast, In the example, we have two functions both used to generate the Fibonacci Series.
first 1
def fibonacci_series(n):
    fib_series = []
    a, b = 0, 1

    for _ in range(n):
        fib_series.append(a)
        a, b = b, a + b

    return fib_series

# Example: Print the first 10 numbers in the Fibonacci series
n = 10
result = fibonacci_series(n)
print(f"Fibonacci Series up to {n} terms: {result}")
Second 2
def fibonacci_generator(n):
    a, b = 0, 1
    count = 0

    while count < n:
        yield a
        a, b = b, a + b
        count += 1

# Example: Print the first 10 numbers in the Fibonacci series using the generator
n = 10
fibonacci_gen = fibonacci_generator(n)
result = list(fibonacci_gen)
print(f"Fibonacci Series up to {n} terms: {result}")
Let's check the performance
import timeit


def fibonacci_series(n):
    fib_series = []
    a, b = 0, 1

    for _ in range(n):
        fib_series.append(a)
        a, b = b, a + b

    return fib_series


# Example: Print the first 10 numbers in the Fibonacci series using the generator
def fibonacci_generator(n):
    a, b = 0, 1
    count = 0

    while count < n:
        yield a
        a, b = b, a + b
        count += 1


n = 10

checker_fs = timeit.timeit(stmt='fibonacci_series(n = n)',
                           globals=globals())
checker_fg = timeit.timeit(stmt='fibonacci_generator(n = n)',
                           globals=globals())

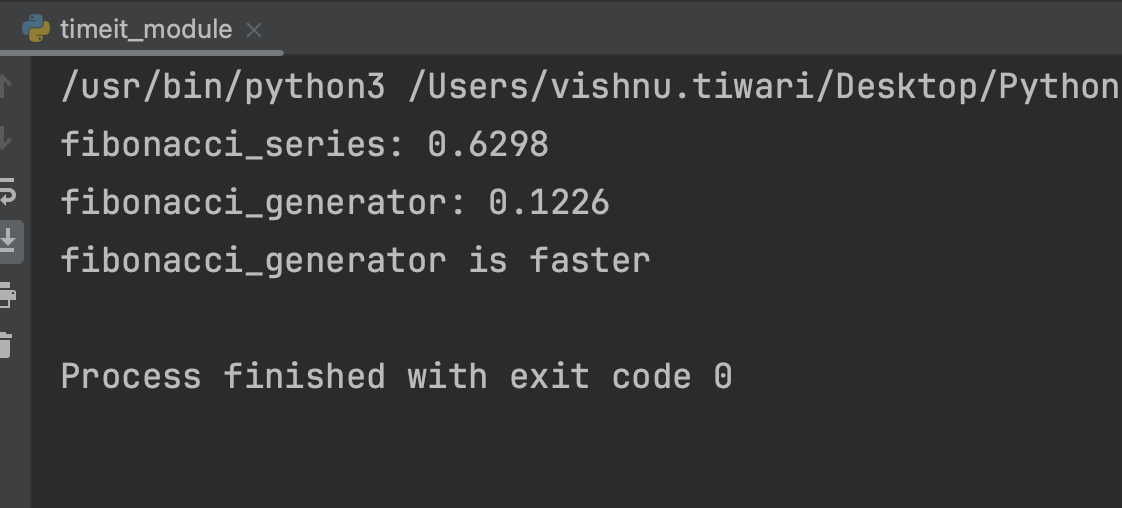
print(f'fibonacci_series: {round(checker_fs, 4)} '
      f'\nfibonacci_generator: {round(checker_fg, 4)}')
print(f'{"fibonacci series" if checker_fs<checker_fg else "fibonacci_generator"} '
      f'is faster')
if your code snippet relies on global variables and you want to include those global variables in the execution context, you can use the globals parameter of the timeit.timeit function
Output

timeit module also allows to repeat the test for specified times
repeat_fs = timeit.repeat(stmt='fibonacci_series(n = n)',
                          globals=globals(),
                          repeat=5)

repeat_fg = timeit.repeat(stmt='fibonacci_generator(n = n)',
                          globals=globals(),
                          repeat=5)


print(f'Fibonacci_series: {repeat_fs}')
print(f'Fibonacci_generator: {repeat_fg}')
Output

Cprofile - For the entire execution of a program
Purpose:
cProfileis used for profiling the entire execution of a program and provides detailed information about the time spent in each function call.Usage: It's suitable for identifying performance bottlenecks, understanding function call patterns, and getting a more in-depth analysis of where the program spends its time.
cProfile is a built-in module in Python that provides a set of functions for profiling the performance of a Python program. Profiling helps you understand how much time your program spends on different functions, which can be useful for identifying bottlenecks and optimizing your code.
Let's see this in practice.
We are going to make a fake website backend, so it's going to make API requests it's going to be able to refresh the page, and so on just, we can see where our program can be improved and we can get how long it took to execute certain parts of the code.
So first we go ahead and create an API call and we know API calls are very costly functions.
import cProfile
import time


def api_call():
    time.sleep(2)
    return None
Here, when we have some data, we want to process it, so we are going to create a function called process_data.
def process_data():
    for i in range(10 ** 7):
        pass
then sort the data and let's reload the data.
def sort_data():
    for i in range(10 ** 8):
        pass
    process_data()

def reload_page():
    process_data()
    sort_data()
    time.sleep(2)
let's execute in the main
def main():
    api_call()
    sort_data()
    reload_page()
The real benchmarking.
if __name__ == '__main__':
    cProfile.run('main()', sort='cumtime')
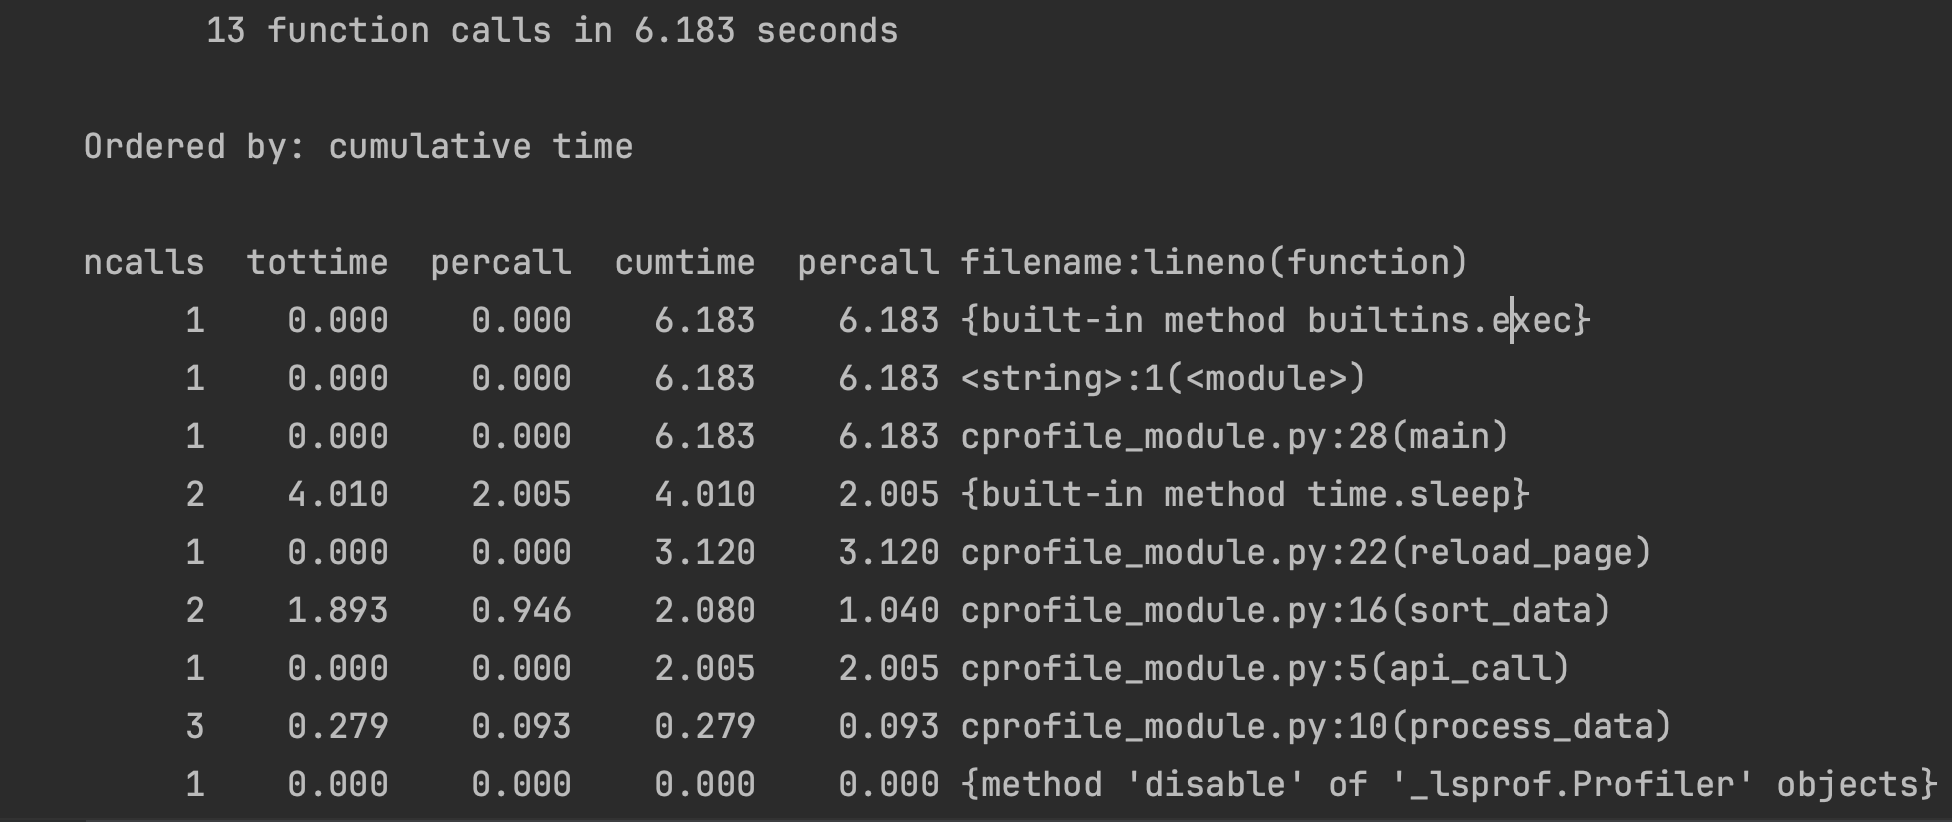
Output

Let me explain to you what's in the output.
General Information:
13 function calls in 6.183 seconds: This line indicates that there were 13 function calls in the entire program, and the program took 6.183 seconds to execute.
Ordered by Cumulative Time:
Ordered by: cumulative time: The output is sorted by cumulative time, i.e., the total time spent in a function and its sub-functions.
Columns Explanation:
ncalls: The number of calls made to the function.tottime: The total time spent in the function excluding time spent in sub-functions.percall: The average time per call (excluding sub-functions).cumtime: The cumulative time spent in the function and its sub-functions.percall: The average cumulative time per call.filename:lineno(function): Information about the function, including the filename, line number, and function name.
Specific Lines Explained:
{built-in method builtins.exec}and<string>:1(<module>): Overhead added by the Python interpreter for executing the code.cprofile_module.py:28(main): Time spent in themainfunction (the entry point of your script).{built-in method time.sleep}: Time spent in thetime.sleepfunction calls.cprofile_module.py:22(reload_page): Time spent in thereload_pagefunction, including time spent insort_dataandprocess_data.cprofile_module.py:16(sort_data): Time spent in thesort_datafunction, including time spent inprocess_data.cprofile_module.py:5(api_call): Time spent in theapi_callfunction.cprofile_module.py:10(process_data): Time spent in theprocess_datafunction.
Profiler Disable Line:
{method 'disable' of '_lsprof.Profiler' objects}: Indicates that the profiler was successfully disabled.
cProfile and profiling tools in general, the term "subfunction" refers to a function that is called from another function. When a function calls another function, the second function becomes a subfunction of the calling function.CProfile is not suitable for the function with a shorter execution time but effective if you want to know other details like the number of function calls and inbuilt functions.
Let me show, what I mean by that.
import cProfile


def fibonacci_series(n):
    fib_series = []
    a, b = 0, 1

    for _ in range(n):
        fib_series.append(a)
        a, b = b, a + b

    return fib_series


def fibonacci_generator(n):
    a, b = 0, 1
    count = 0

    while count < n:
        yield a
        a, b = b, a + b
        count += 1


n = 10

# Profile the execution of fibonacci_series and fibonacci_generator
profiler = cProfile.Profile()
profiler.enable()
result_series = fibonacci_series(n)
result_generator = list(fibonacci_generator(n))
profiler.disable()
profiler.print_stats(sort='cumtime')
Output

You can see it's showing zero seconds, but in timeit , it was showing the accurate execution time.
If the cProfile output is showing 0 seconds for all functions, it might indicate that the execution time of your code is extremely short, possibly below the resolution of the timer used by cProfile.
Conclusion
Choosing BetweentimeitandcProfile:
If you want a quick measurement of the execution time for a specific piece of code, use
timeit.If you need detailed information about function calls and where time is spent in your entire program, use
cProfile.
In practice, both tools can complement each other. You might use timeit for initial quick measurements and then use cProfile for more in-depth analysis if you identify potential performance issues.
By combining these tools, developers can adopt a two-tiered approach. Start with timeit for initial assessments, identifying potential areas of concern. Subsequently, use cProfile to delve deeper into the code, gaining insights into function-level performance and optimizing critical sections.
Ultimately, the judicious use of timeit and cProfile empowers developers to strike a balance between quick assessments and thorough profiling, leading to well-optimized and high-performance Python code.

Subscribe to my newsletter
Read articles from Vishnu Tiwari directly inside your inbox. Subscribe to the newsletter, and don't miss out.
Written by

Vishnu Tiwari
Vishnu Tiwari
🐍 Python Developer @hcl Technologies | Bits Pilani | Passionate about code, coffee, and collaboration 🚀 | Turning caffeine into code since 2021| Python Developer