Streamlining Data Flow: Utilizing Promtail for Application Data Collection, Loki for Centralized Log Aggregation, and Grafana for Comprehensive Visual
 pardeep kaur
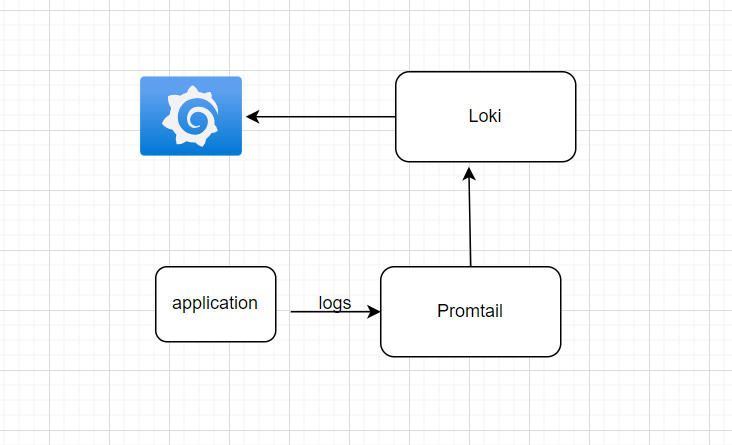
Grafana is an open-source analytics and monitoring platform used for creating customizable dashboards to visualize and analyze data from various sources. It supports integration with databases, cloud services, and monitoring tools, allowing users to build interactive dashboards with features like alerting, data source plugins, user authentication, and templating. Grafana is widely utilized in IT and DevOps for monitoring system performance and application metrics. Its active community contributes to its development and provides support through forums and documentation.
Install Grafana on Debian or Ubuntu sudo apt-get install -y apt-transport-https sudo apt-get install -y software-properties-common wget
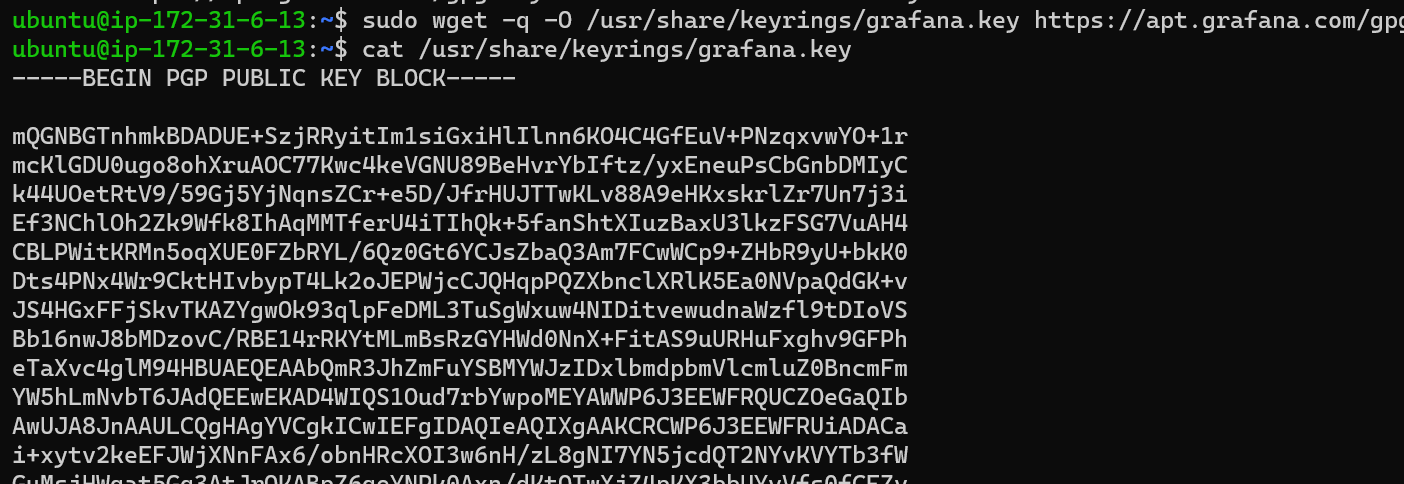
sudo wget -q -O /usr/share/keyrings/grafana.key https://apt.grafana.com/gpg.key
Stable release
echo "deb [signed-by=/usr/share/keyrings/grafana.key]
https://apt.grafana.com stable main" | sudo tee -a /etc/apt/sources.list.d/grafana.list
# Update the list of available packages
sudo apt-get update

# Install the latest OSS release:
sudo apt-get install grafana
you can use grafana labs as well instead of this configuration.
To start grafana server:
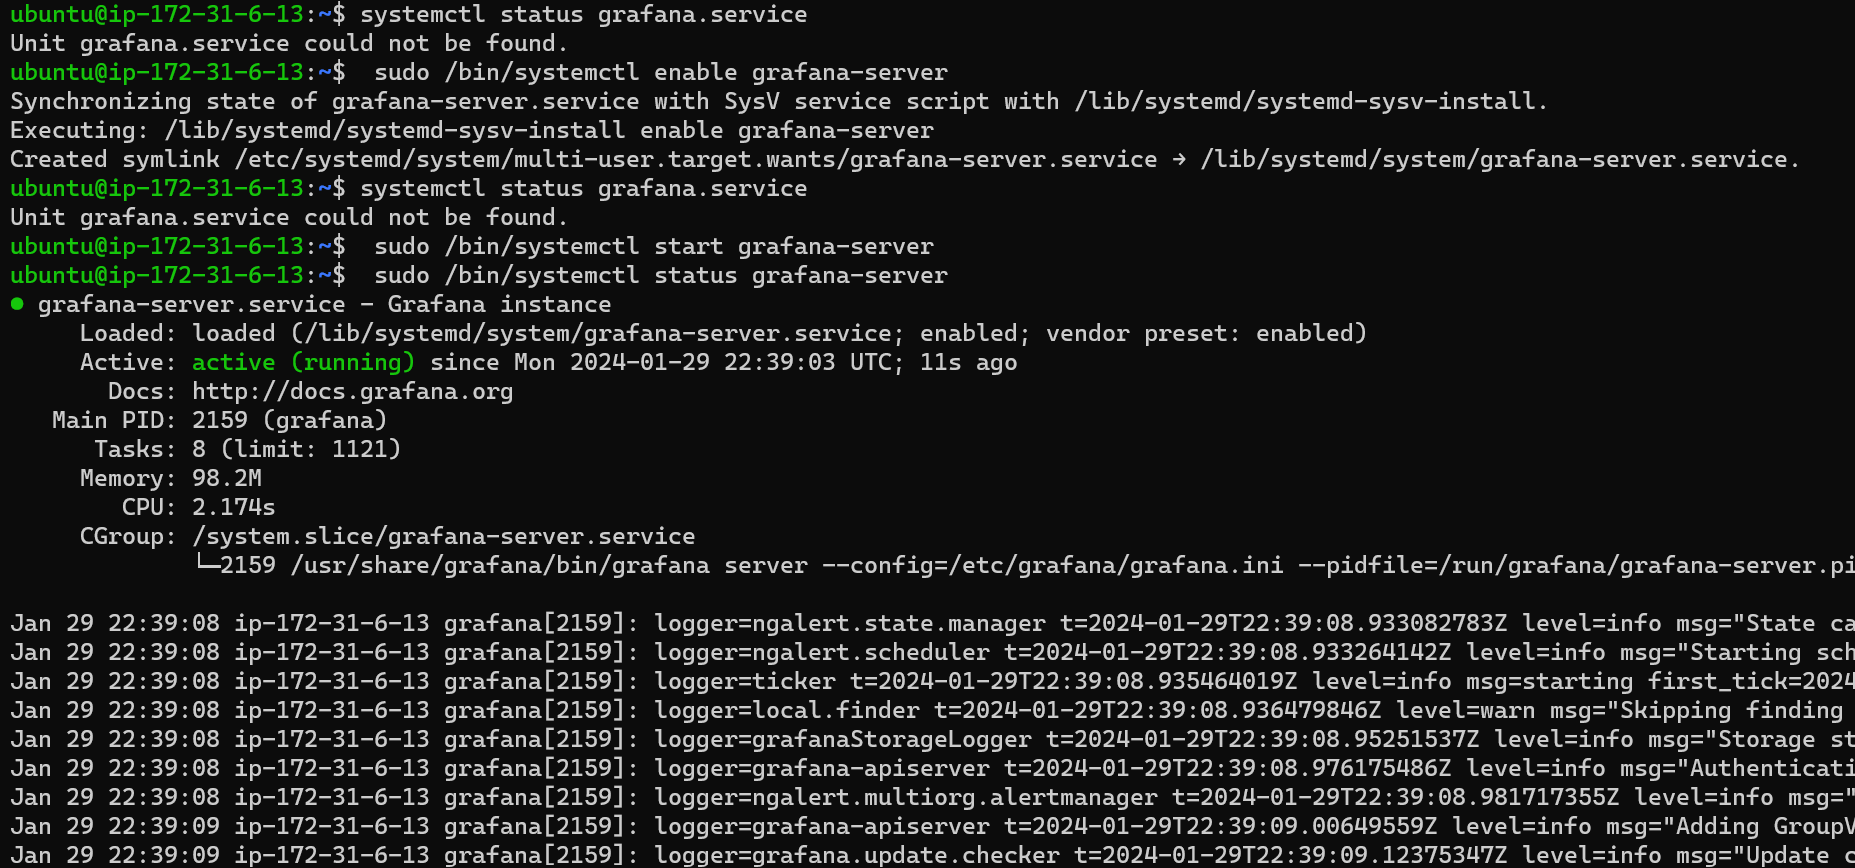
sudo /bin/systemctl enable grafana-server
sudo /bin/systemctl start grafana-server
sudo /bin/systemctl status grafana-server
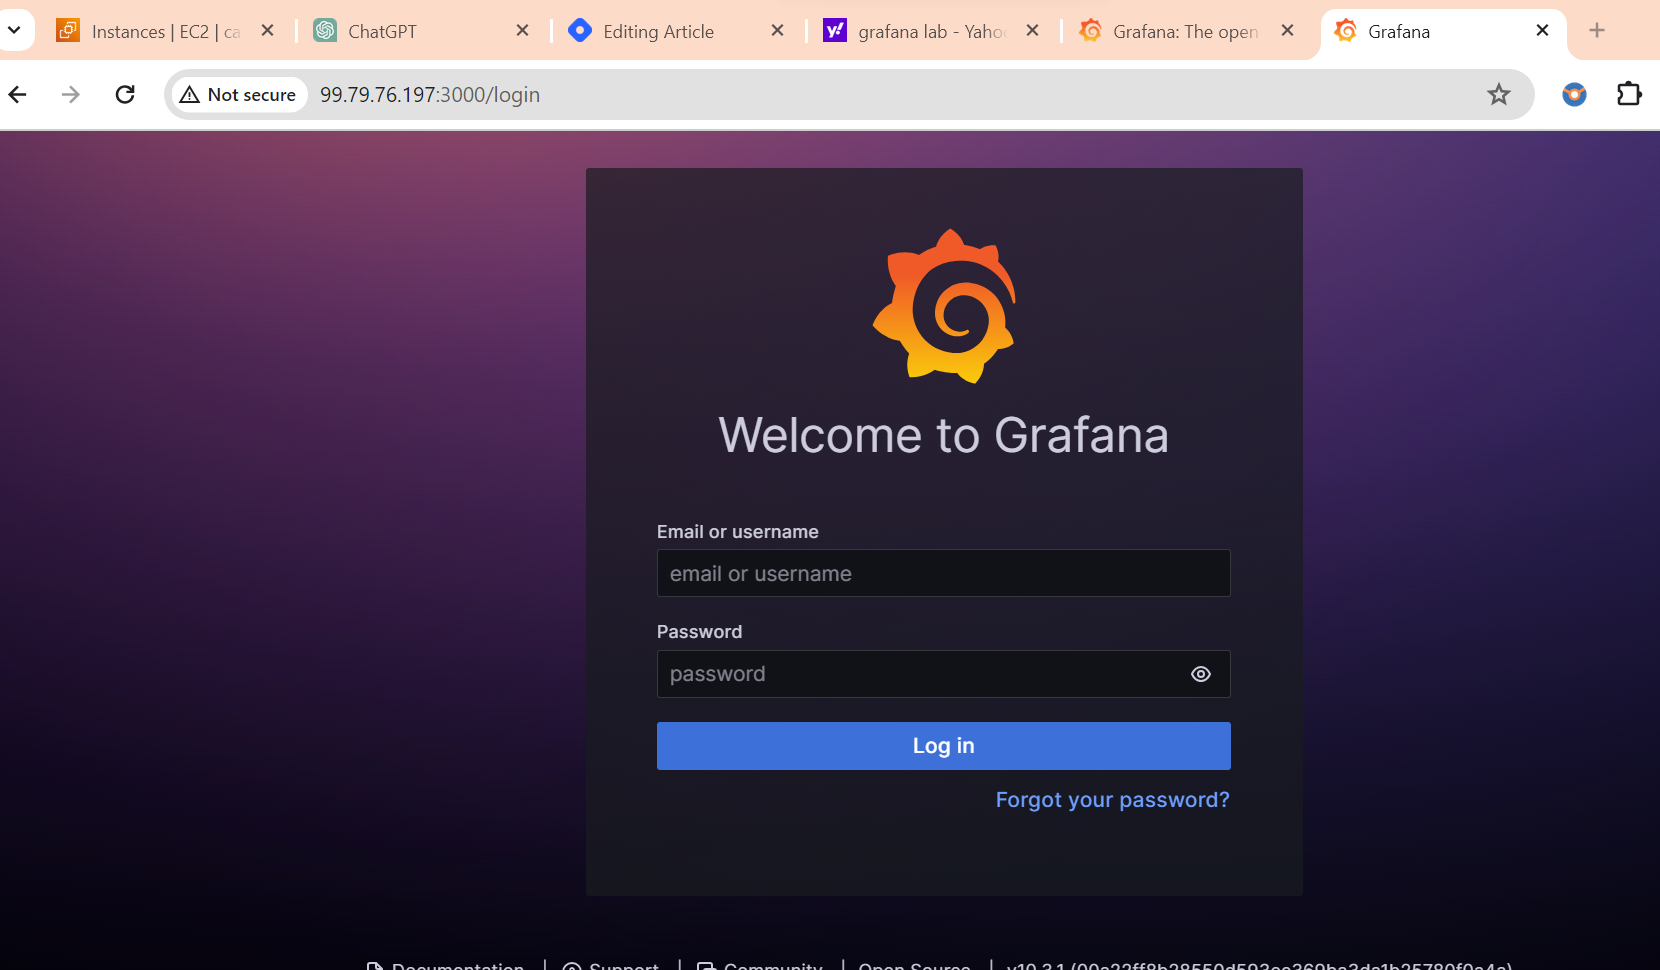
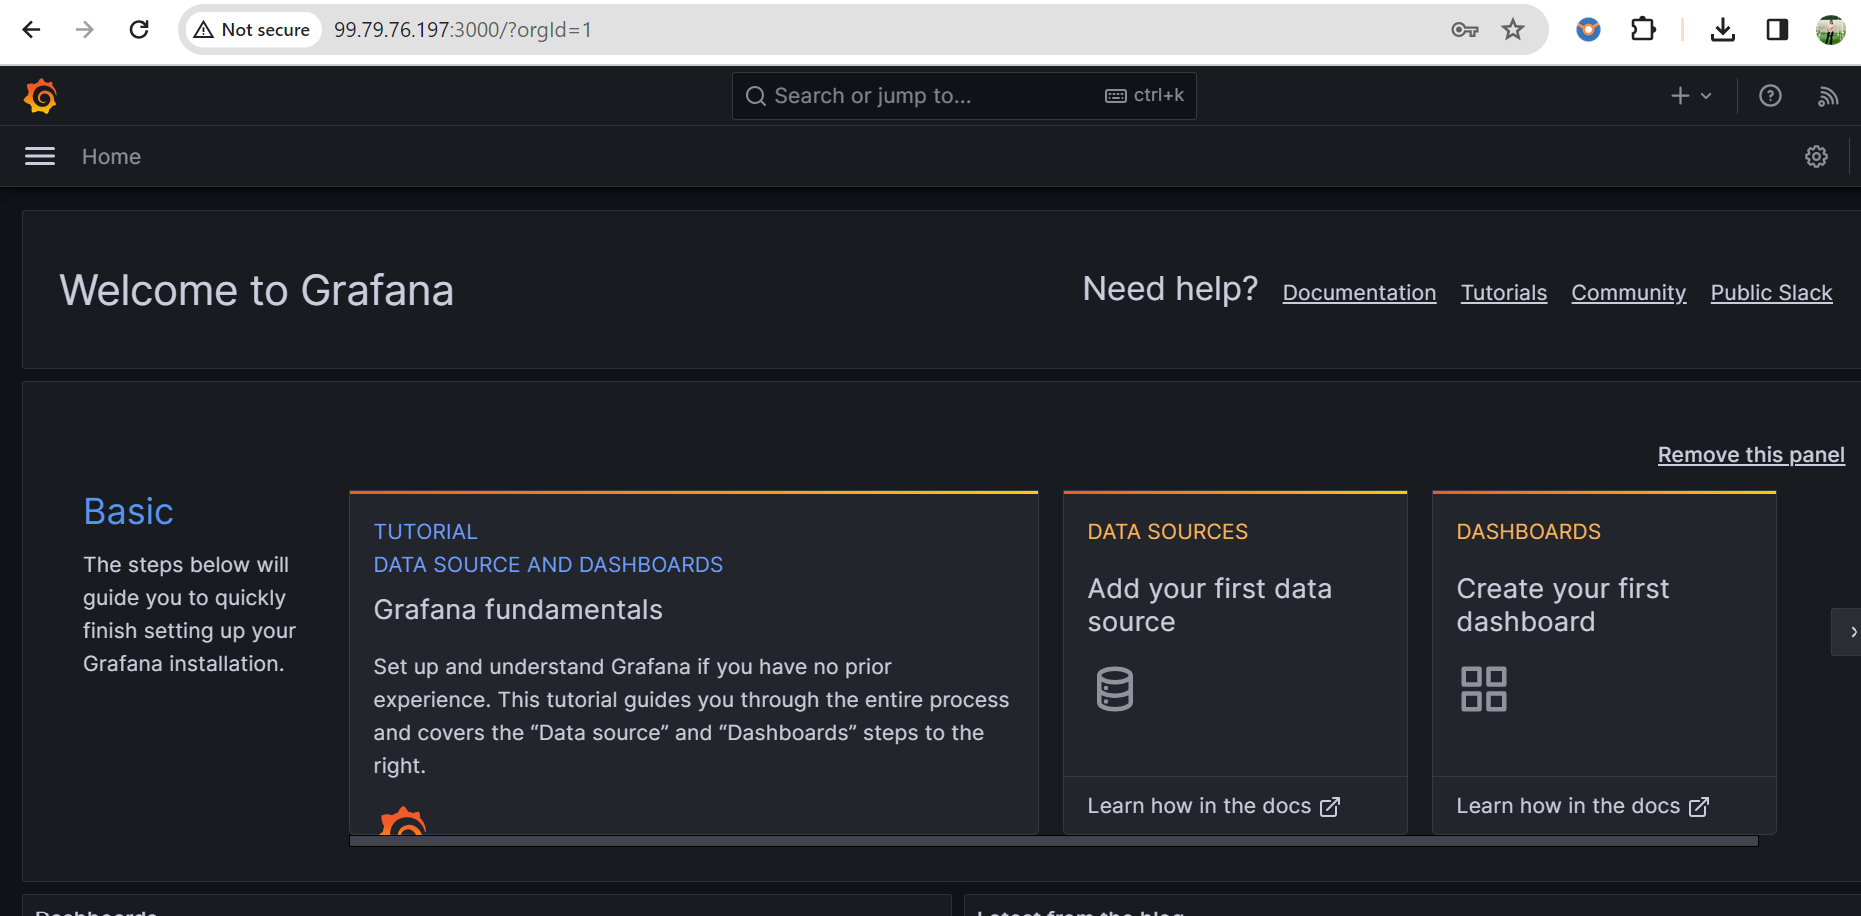
Add 3000 port in the security group of ec2 instance. publici_p _ec2:3000
Install Loki config
wget https://raw.githubusercontent.com/grafana/loki/v2.8.0/cmd/loki/loki-local-config.yaml -O loki-config.yaml

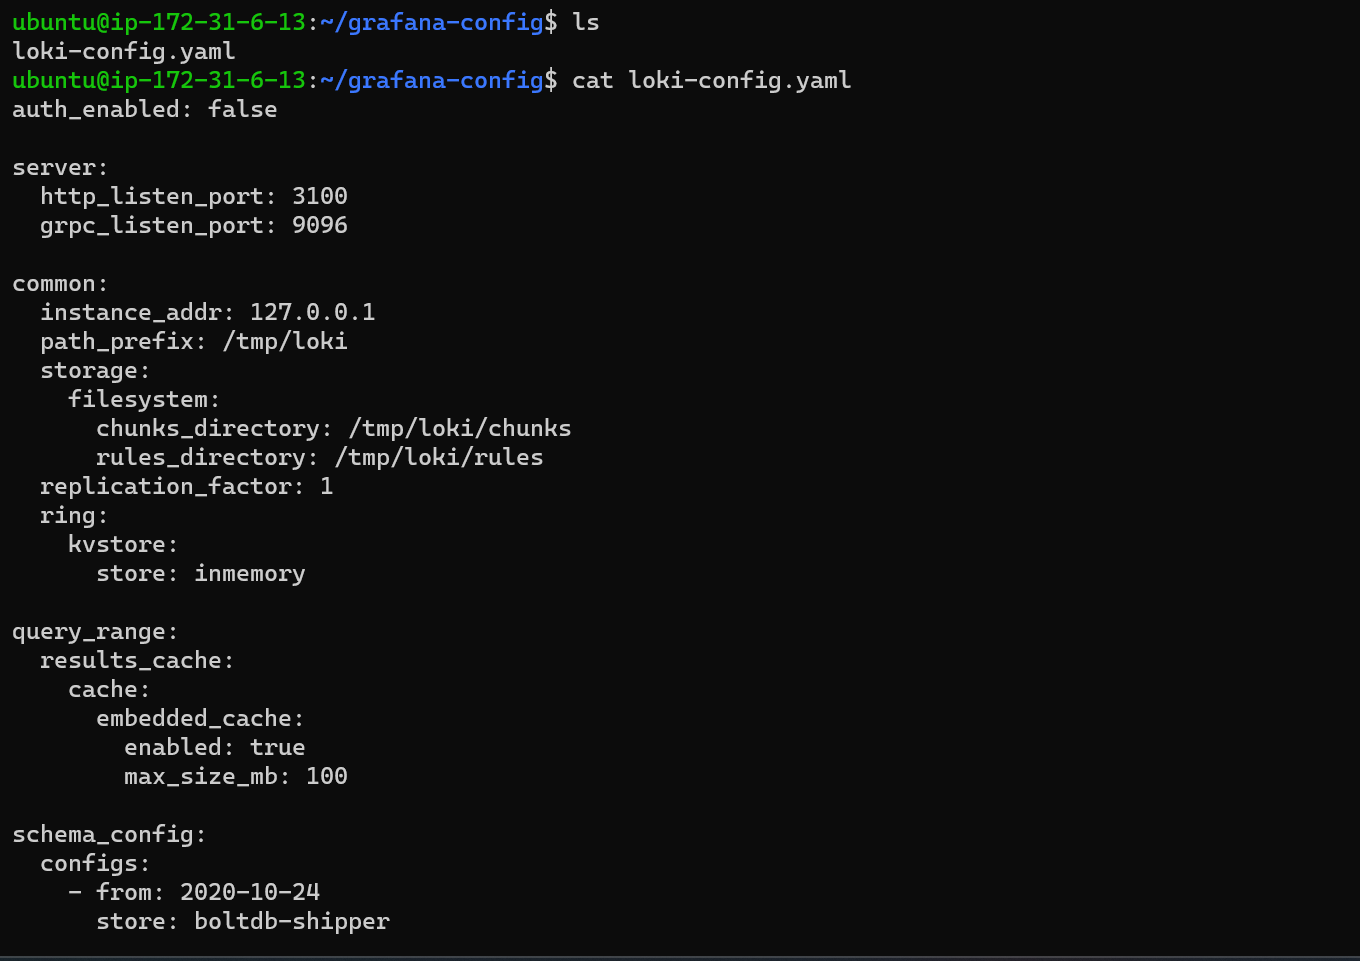
Execute the Loki server within a Docker container, ensuring that both the Loki Docker container and the Promtail Docker container can establish communication through Docker networking.
Run loki Docker conatiner:
docker run -d --name loki -v $(pwd):/mnt/config -p 3100:3100 grafana/loki:2.8.0 --config.file=/mnt/config/loki-config.yaml
install dokcer on server:
sudo apt install docker.io

change permissions of user and docker conatiner is up and running.

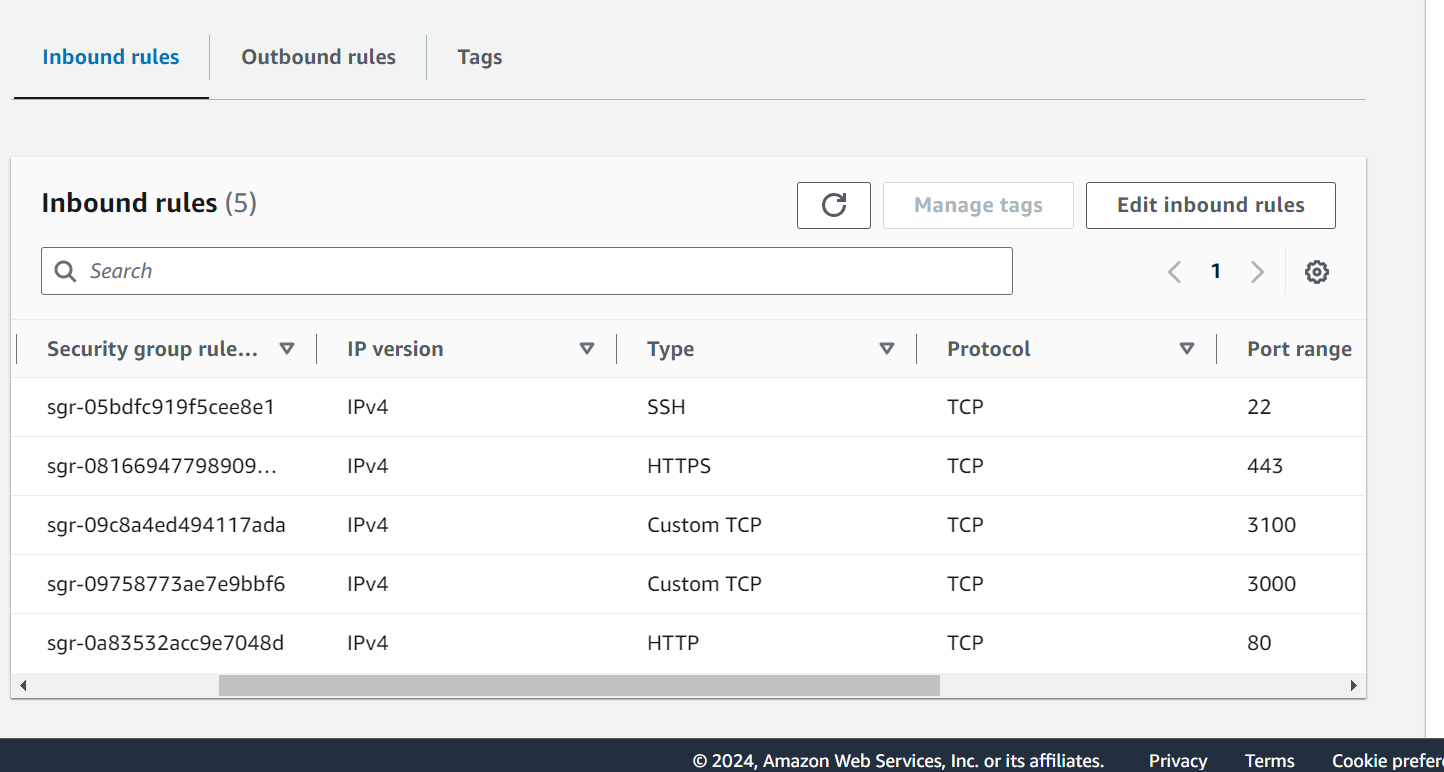
In ec2 instance add 3100 in inbound rule of sercurity group.
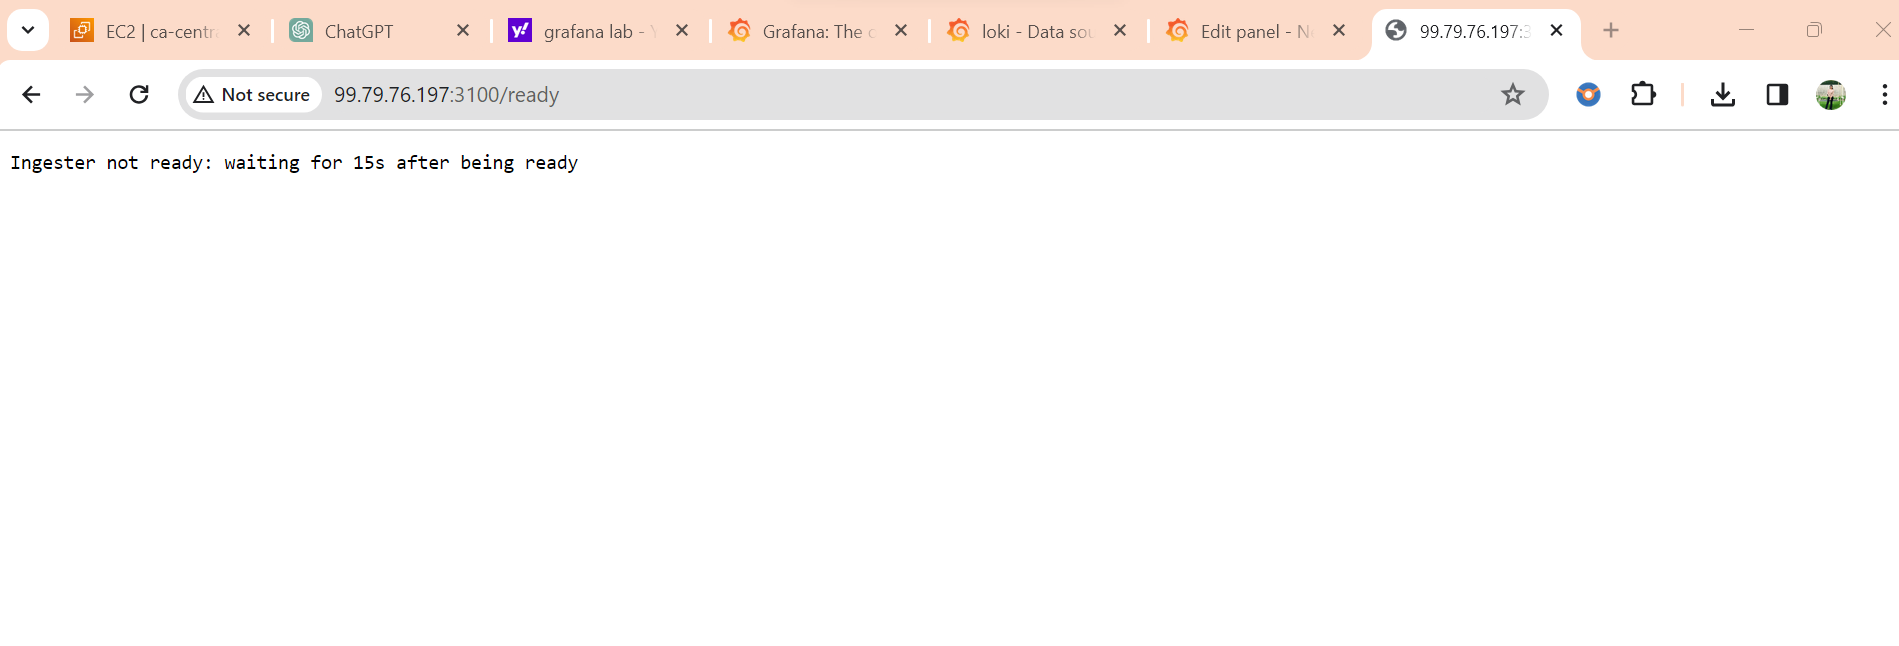
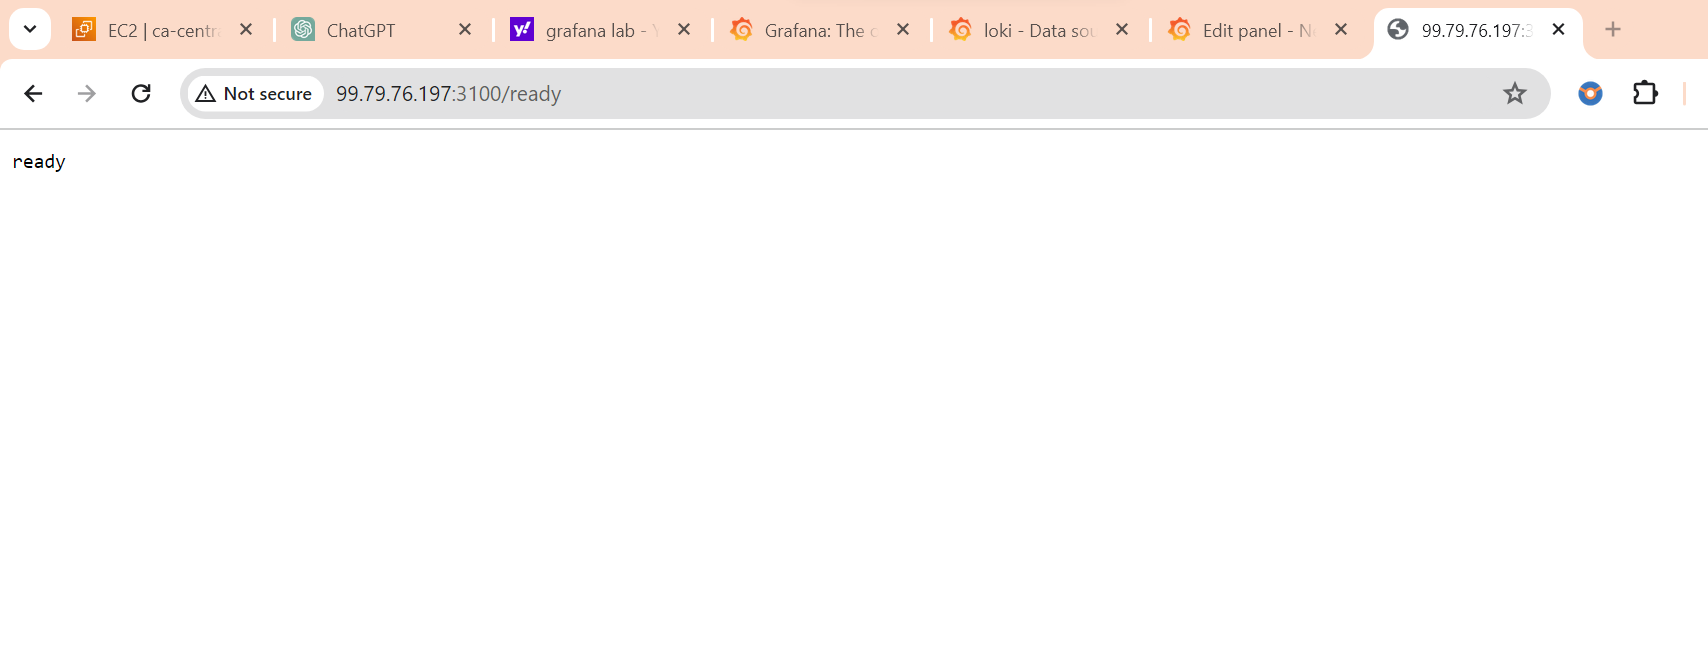
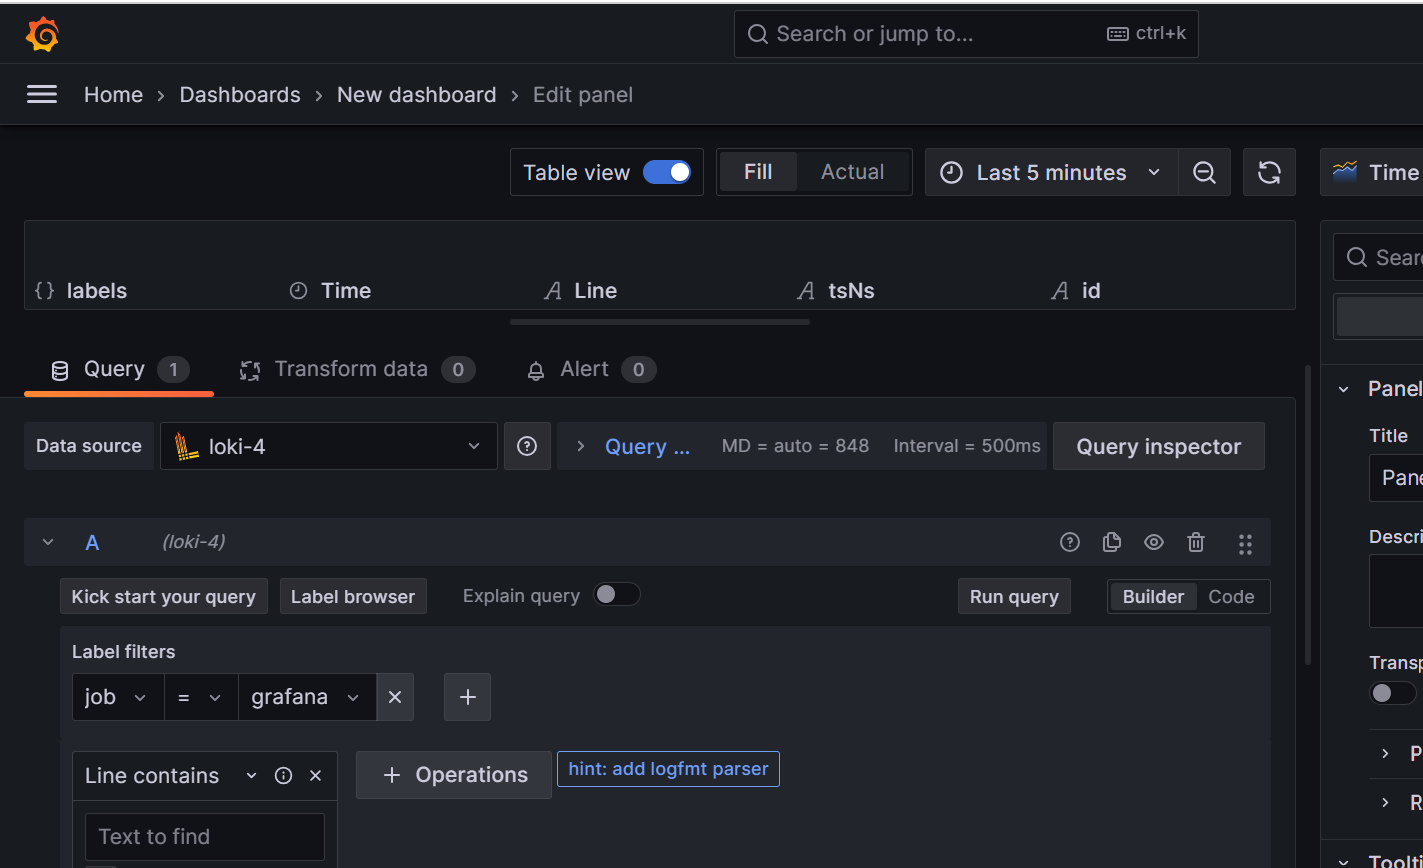
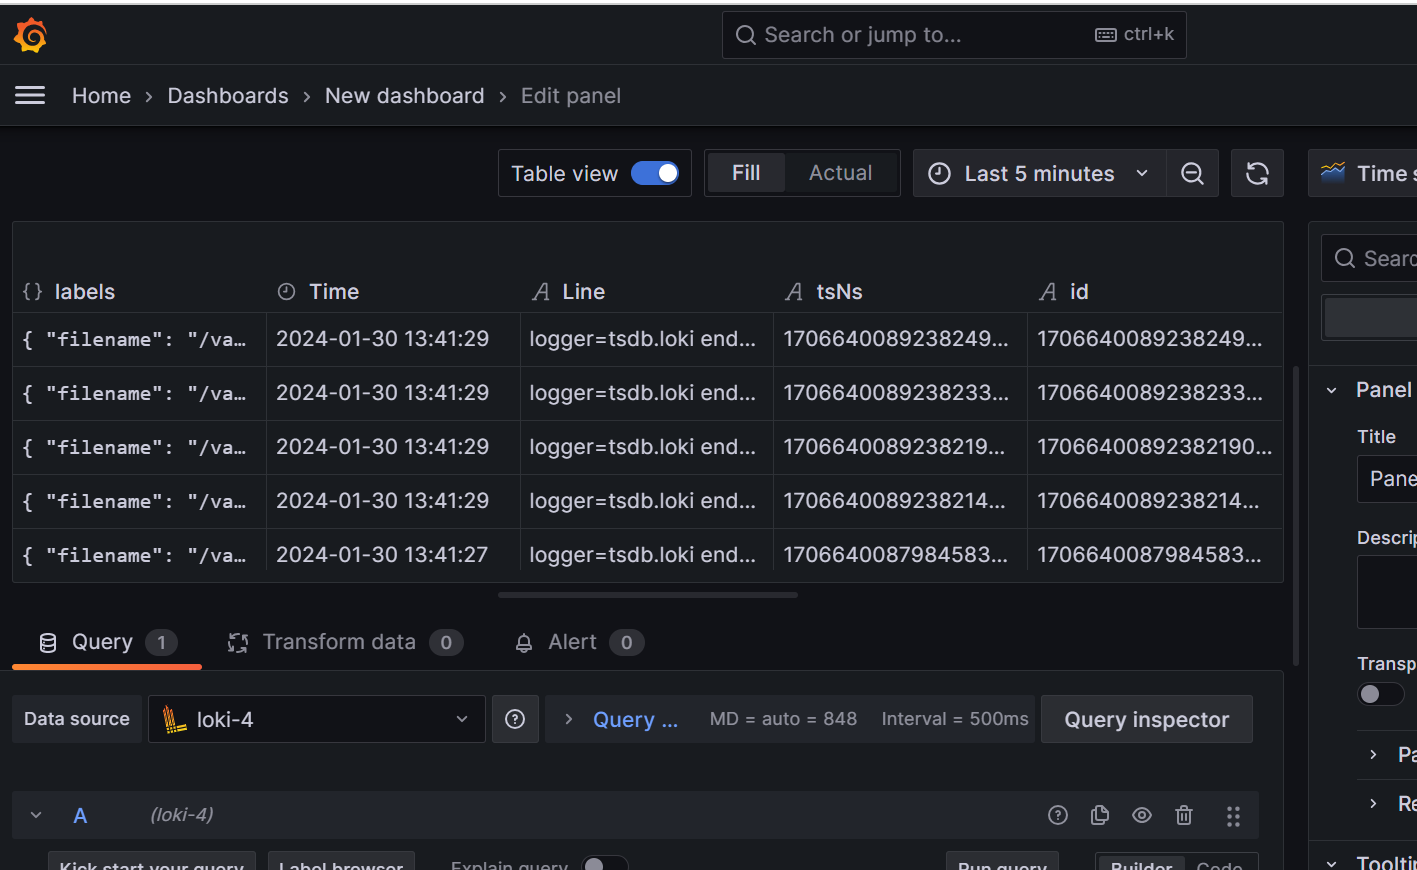
Now, Loki is awaiting incoming data from Promtail. As Promtail collects data, it will push it to Loki. Subsequently, Loki, acting as a data source, will provide that data to Grafana for visualization and analysis.
download promtail:
wgethttps://raw.githubusercontent.com/grafana/loki/v2.8.0/clients/cmd/promtail/promtail-docker-config.yaml -O promtail-config.yaml

Run Promtail Docker container
docker run -d --name promtail -v $(pwd):/mnt/config -v /var/log:/var/log --link loki grafana/promtail:2.8.0 --config.file=/mnt/config/promtail-config.yaml
docker run: This command is used to run a Docker container.-d: It runs the container in the background (detached mode).--name promtail: Assigns the name "promtail" to the running container.-v $(pwd):/mnt/config: Mounts the current working directory into the container at the path/mnt/config. This is typically done to provide the container with configuration files or other data.-v /var/log:/var/log: Mounts the host's/var/logdirectory into the container at the same location. This allows Promtail to access log files on the host.--link loki: Establishes a link to another container named "loki." This is an older way of connecting containers and is not necessary if you are using Docker networks (which you are in your previous setup).grafana/promtail:2.8.0: Specifies the Docker image and version to use for Promtail. In this case, it's the Grafana Promtail image version 2.8.0.--config.file=/mnt/config/promtail-config.yaml: Specifies the path to the Promtail configuration file inside the container. Adjust this path based on the actual location of yourpromtail-config.yamlfile.
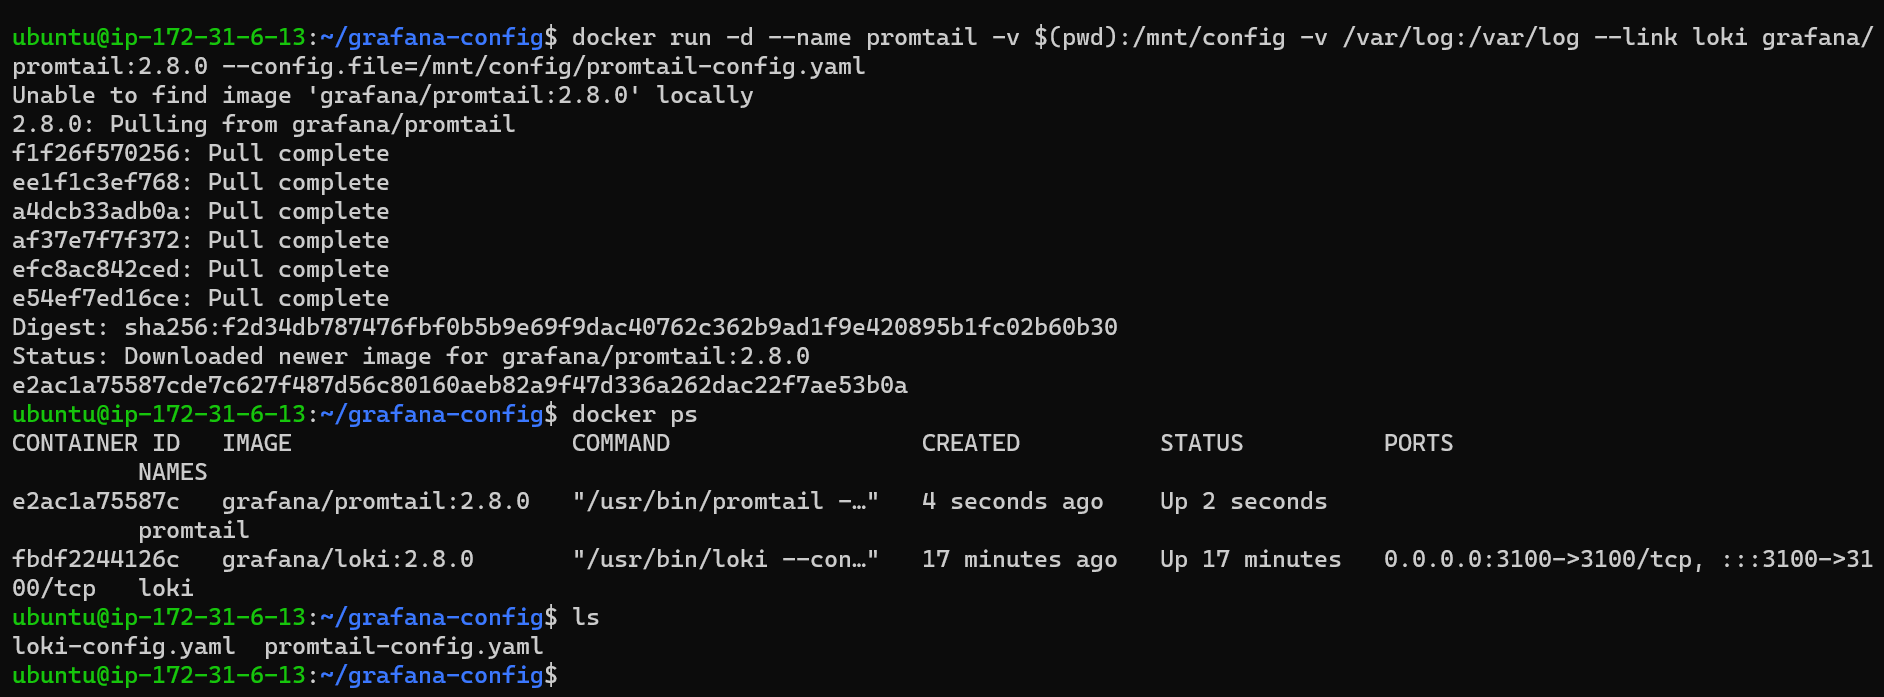
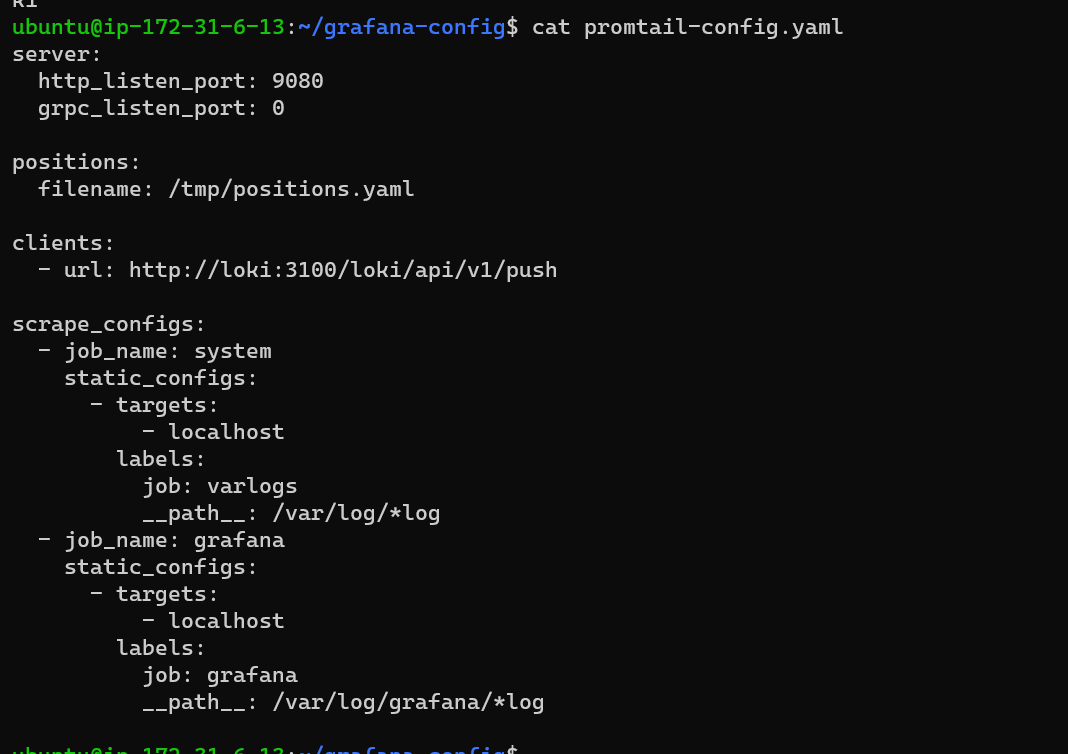
Promtail server is operational on port 9080 and accepts data via the path /var/log/*log without utilizing the API. The data collected by Promtail will be forwarded to Loki clients using the following URL: http://loki:3100/loki/api/v1/push. In this context, "loki" serves as the hostname within Docker, facilitating communication between containers through hostname references rather than port numbers.
start promtail
Now, Promtail will scrape logs from both the system (/var/log/*log) and your application logs, pushing them to Loki for further visualization in Grafana.

Adding Loki as a data source in Grafana involves a few steps. Below are the general steps to add Loki as a data source:
Access Grafana UI: Open your Grafana web interface. This is typically available at
http://localhost:3000unless you've configured it differently.Log In: Log in to your Grafana instance using your credentials.
Navigate to Data Sources: After logging in, click on the gear icon (⚙️) in the left sidebar to open the "Configuration" menu. Then, select "Data Sources."
Add a Data Source: Click on the "Add your first data source" or the "Add your first data source +" button.
Choose Loki Data Source: In the "Select data source" page, search for "Loki" in the "Available Plugins" section or find it in the "Log" section. Click on "Loki" to select it.
Configure Loki Data Source:
Set the
Namefield to a descriptive name for your Loki data source.In the
HTTPsection:- Set the
URLto the URL of your Loki instance http://99.79.76.197:3100/ready
- Set the
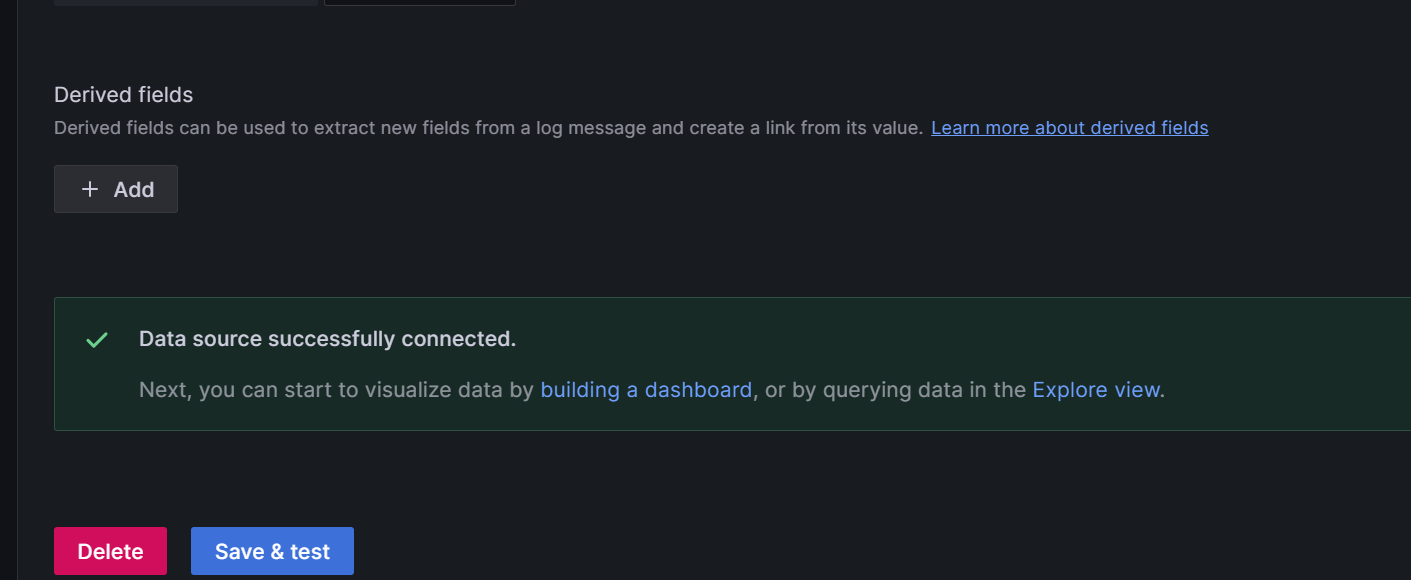
Save and Test: Scroll down to the bottom of the page and click the "Save & Test" button to save the data source configuration and test the connection to Loki.
Verify Connection: After saving, Grafana will test the connection to Loki. Ensure that the test is successful, and you see a green notification indicating that the data source was added successfully.
Set as Default (Optional): Optionally, you can set the data source as the default by checking the "Default" checkbox in the configuration.
Go Back to Home Dashboard: Click on the Grafana logo in the top left to go back to the home dashboard.

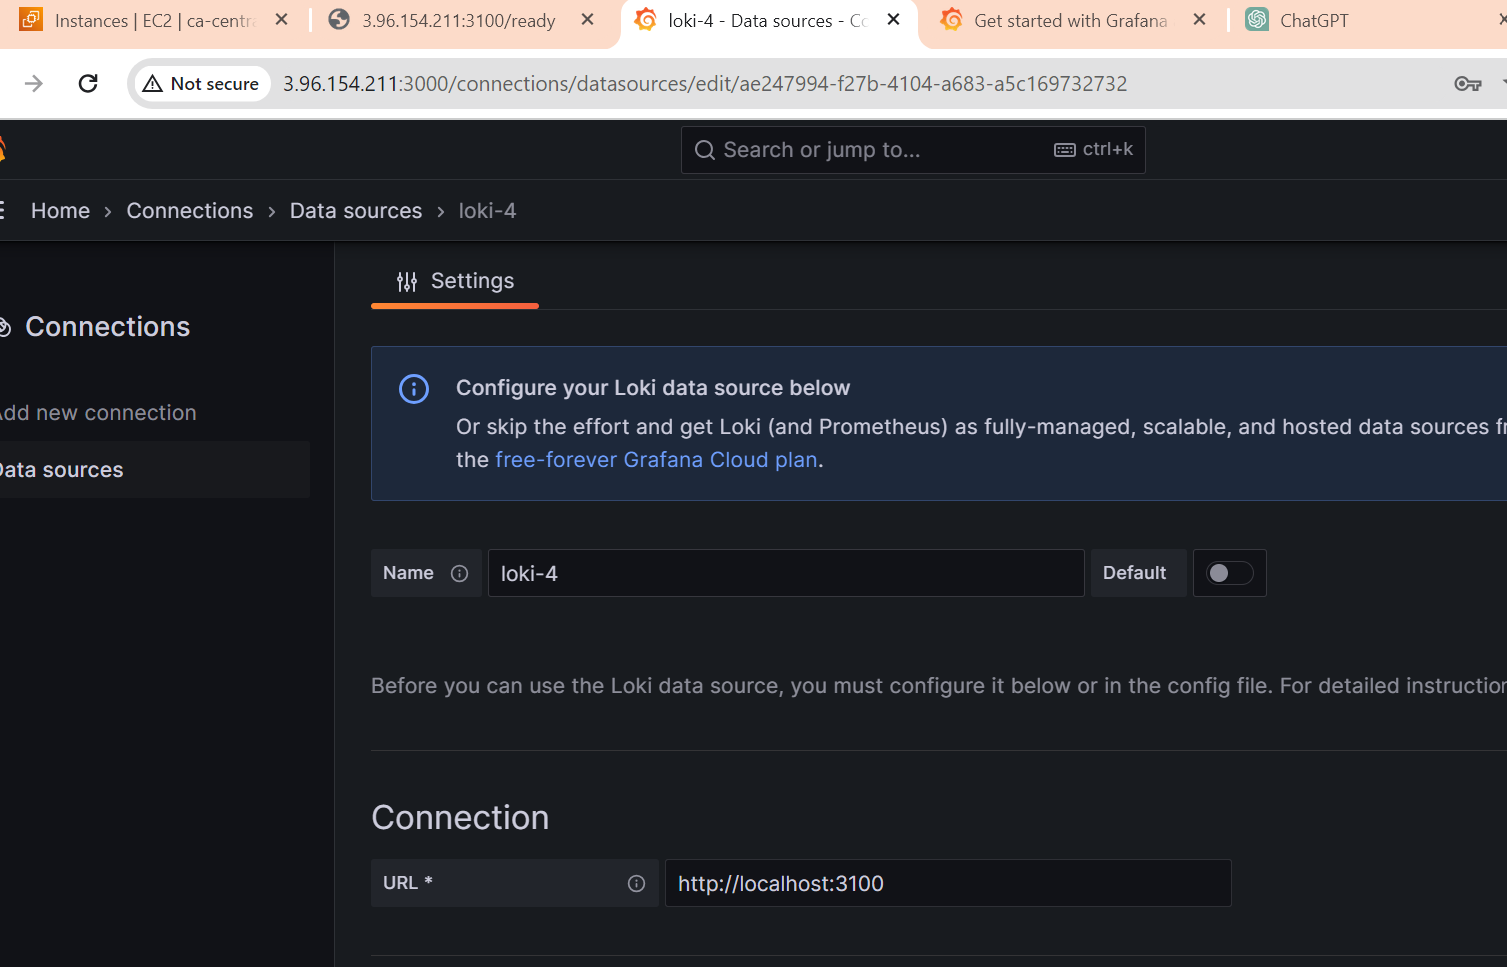
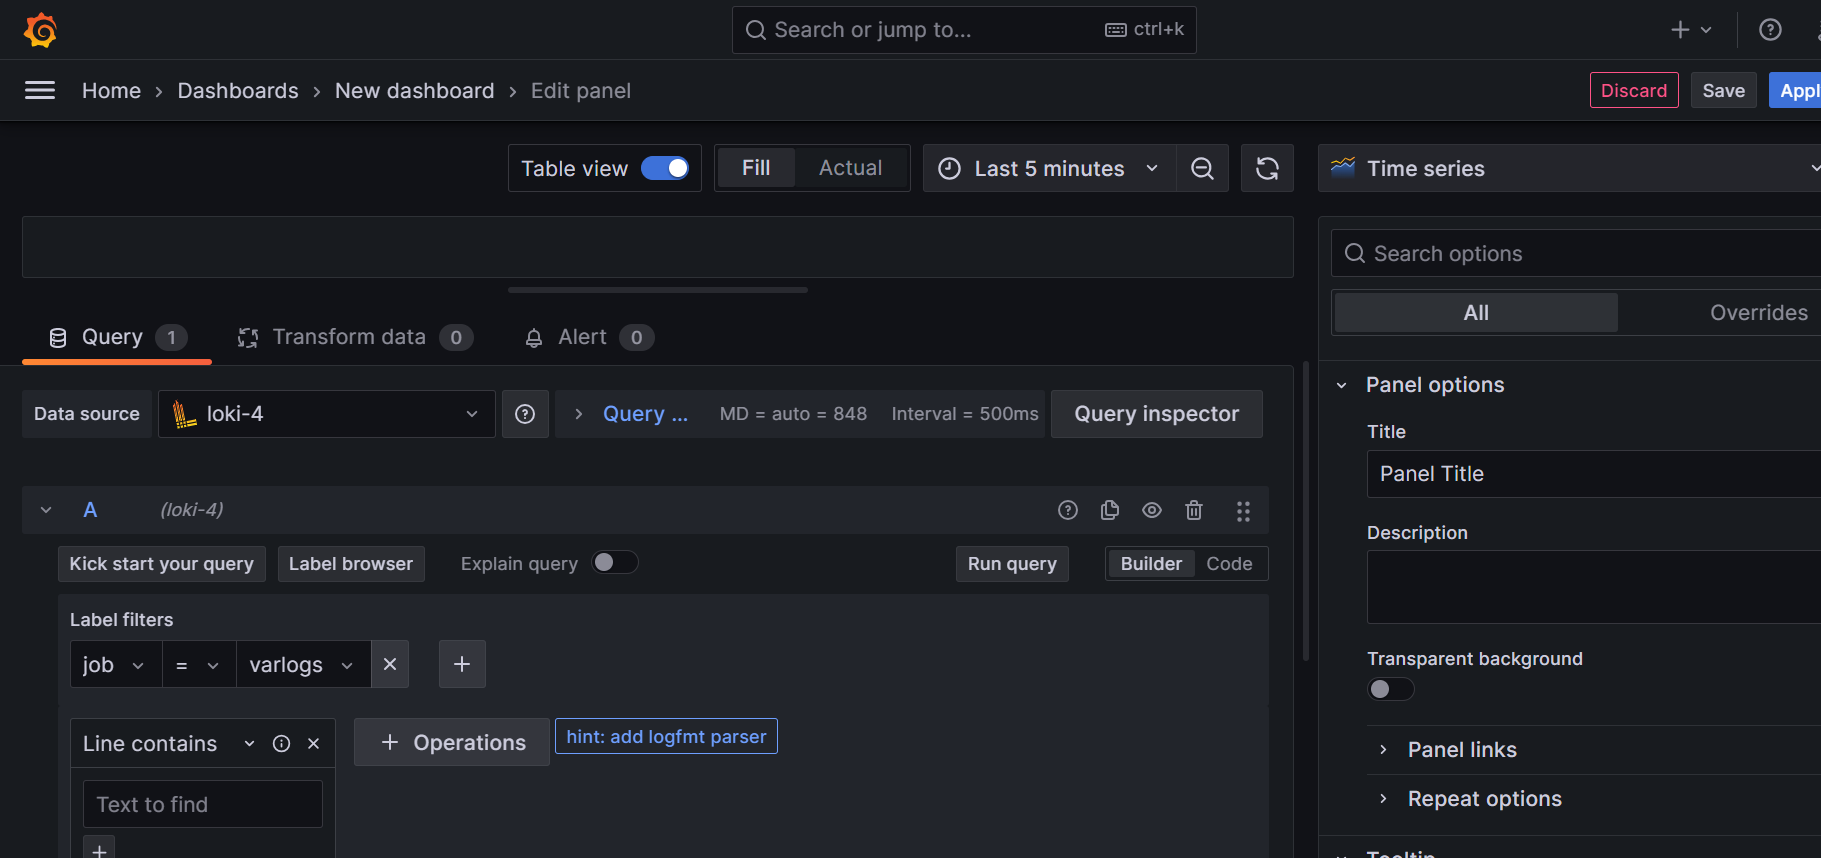
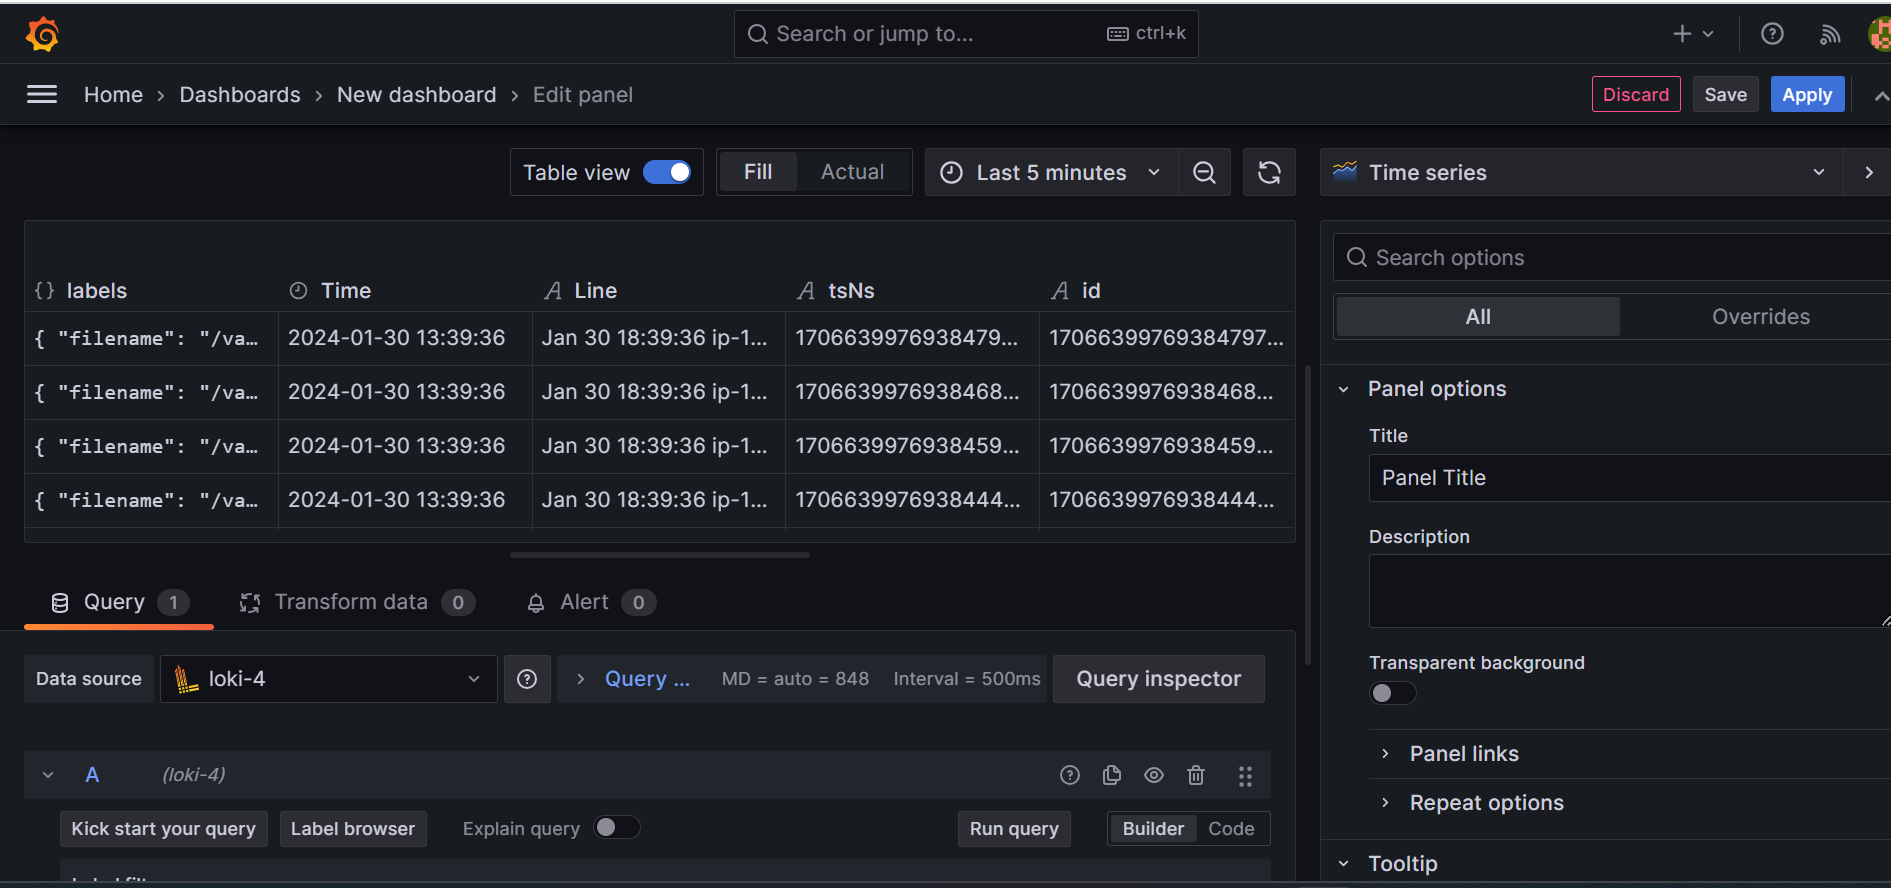
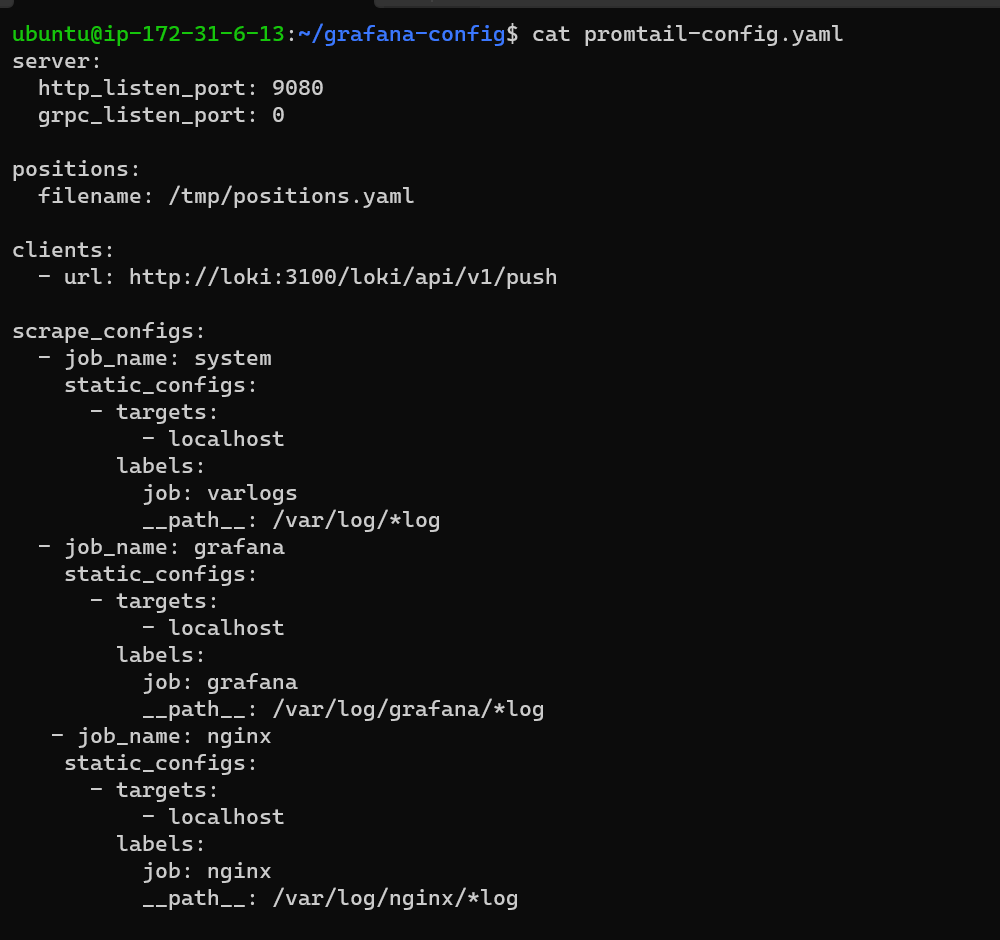
Certainly! To add logs from another application, you can modify the scrape_configs section in the promtail-config.yaml file. Here's an example:
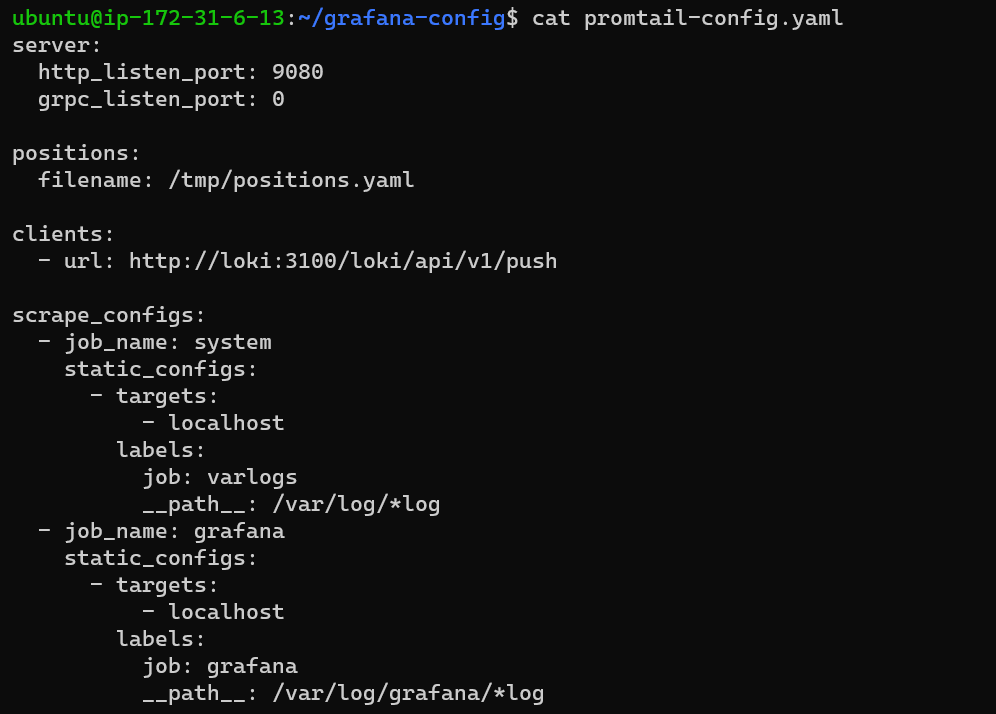
server:
  http_listen_port: 9080
  grpc_listen_port: 0

positions:
  filename: /tmp/positions.yaml

clients:
  - url: http://loki:3100/loki/api/v1/push

scrape_configs:
  - job_name: system
    static_configs:
      - targets:
          - localhost
        labels:
          job: varlogs
          __path__: /var/log/*log
  - job_name: grafana
    static_configs:
      - targets:
          - localhost
        labels:
          job: grafana
          __path__: /var/log/grafana/*log
Explanation:
- job_name: your_app: Add a new job section for your application.- targets: -localhost: Specify the targets. If your application and Promtail are on the same machine, "localhost" is appropriate. Adjust this if your application is on a different host.labels: job: your_app_logs: Define a label for your application logs. Modify "your_app_logs" to something descriptive.__path__: /path/to/your/app/logs/*log: Set the path to the logs of your application. Adjust the path accordingly.
After making these changes, restart Promtail for the new configuration to take effect.

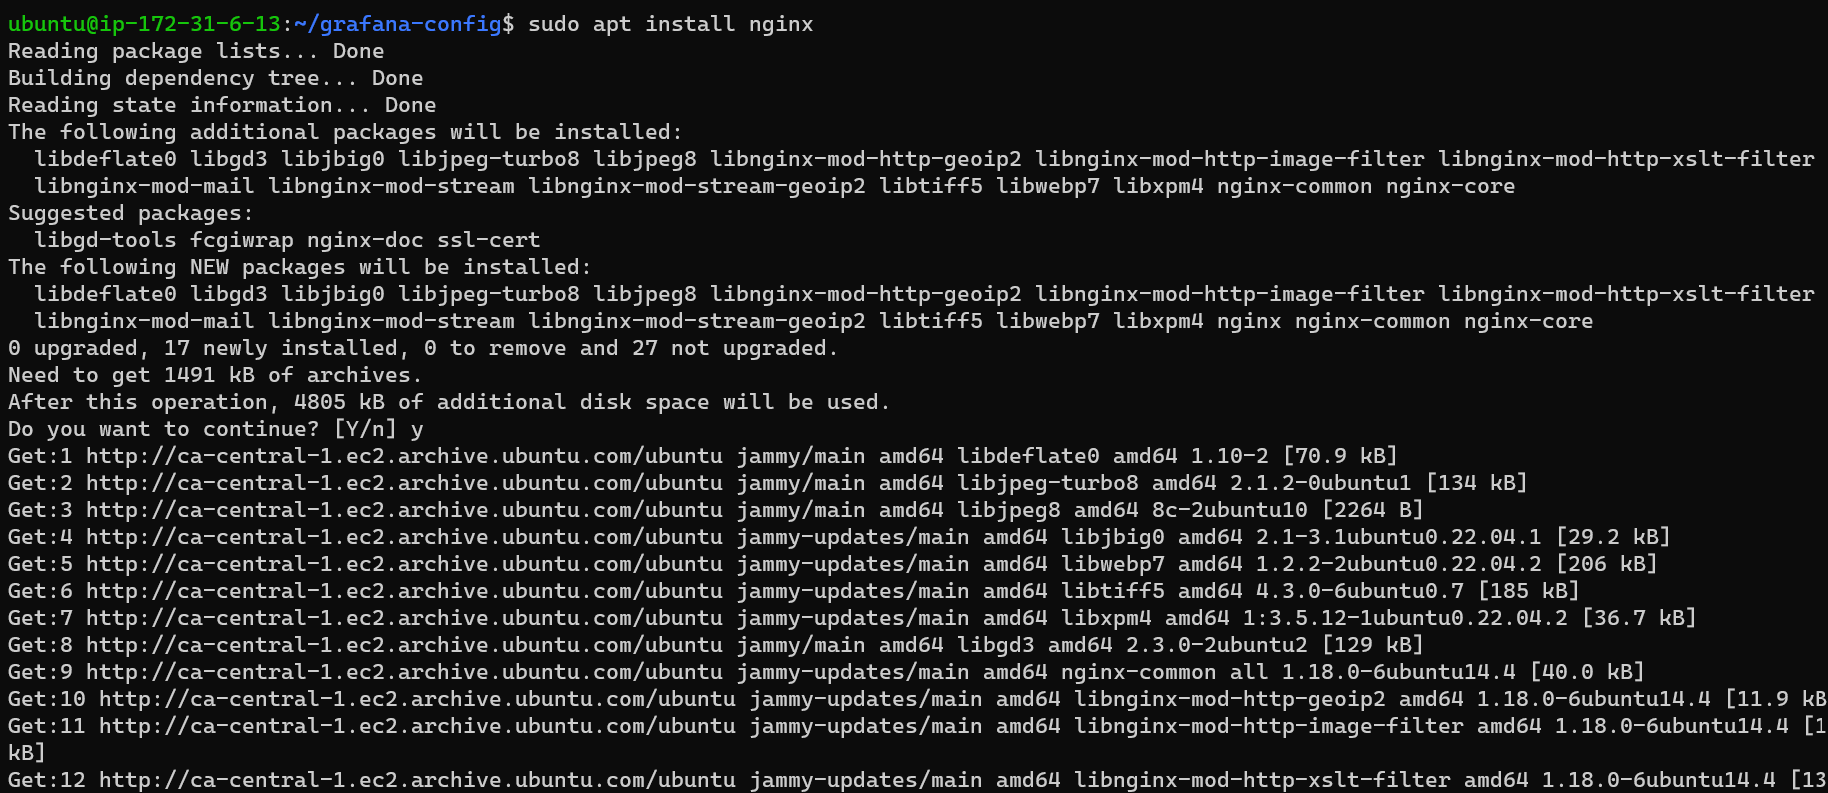
install nginx and create nginx logs:

vim promtail-config.yaml add logs path of nginx in job:
then restart docker promethus.

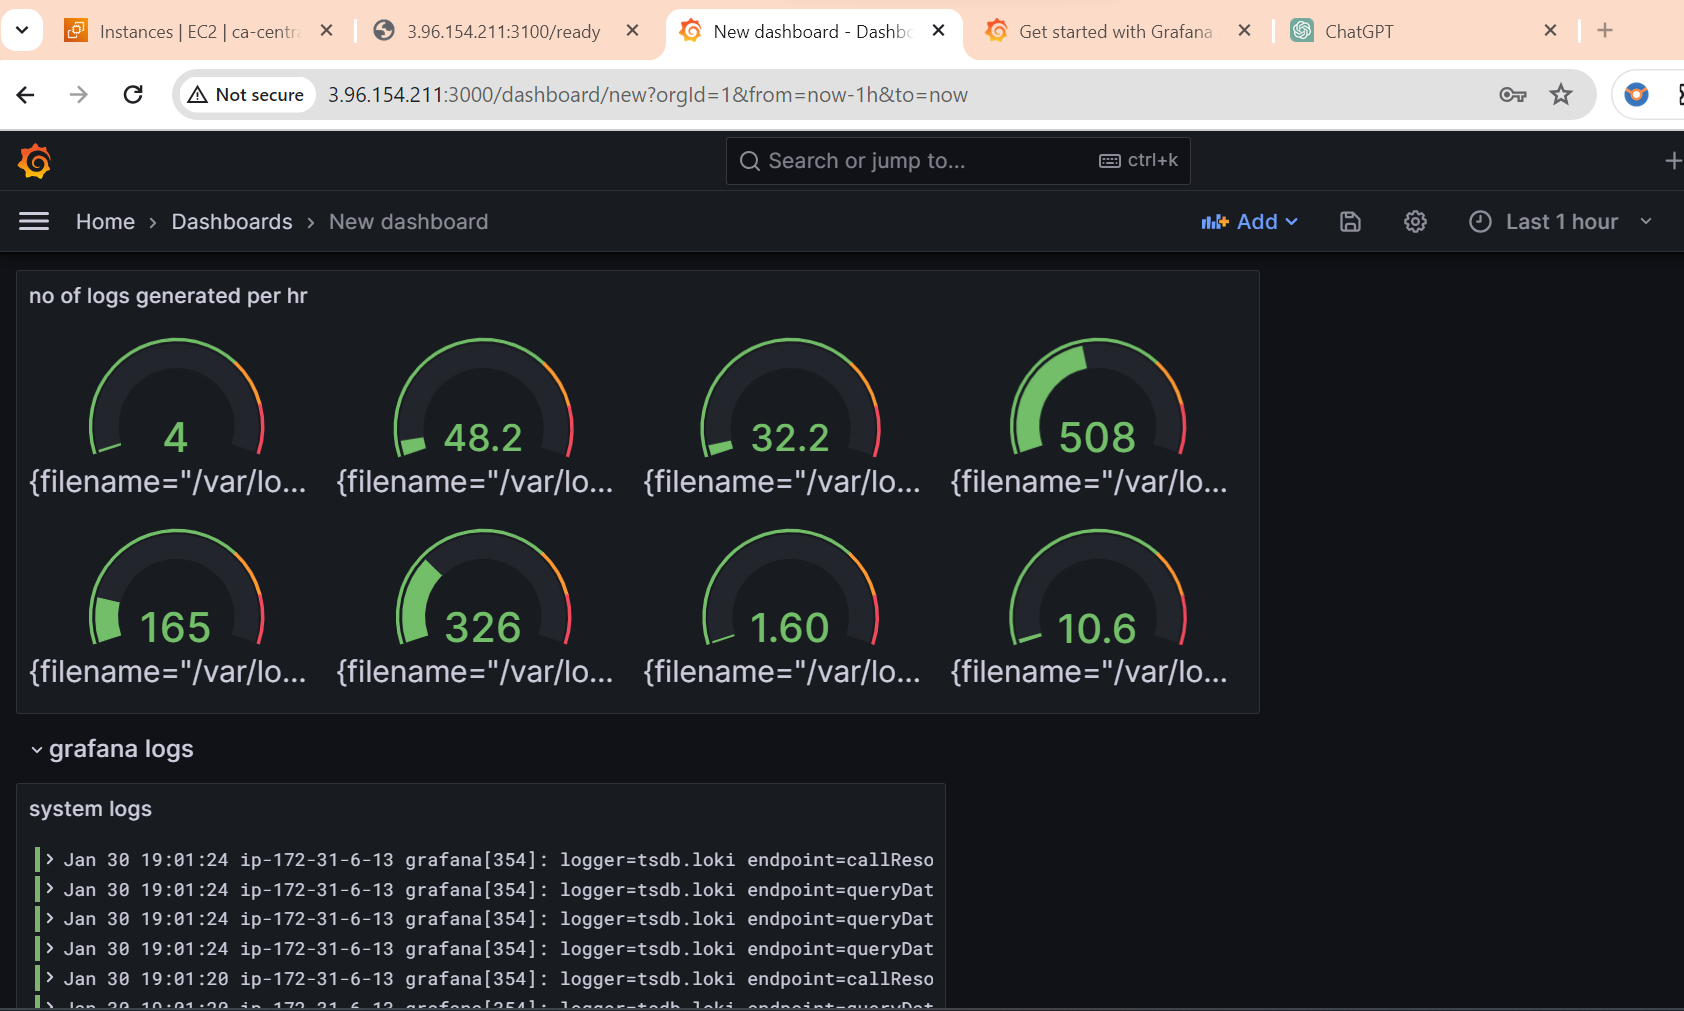
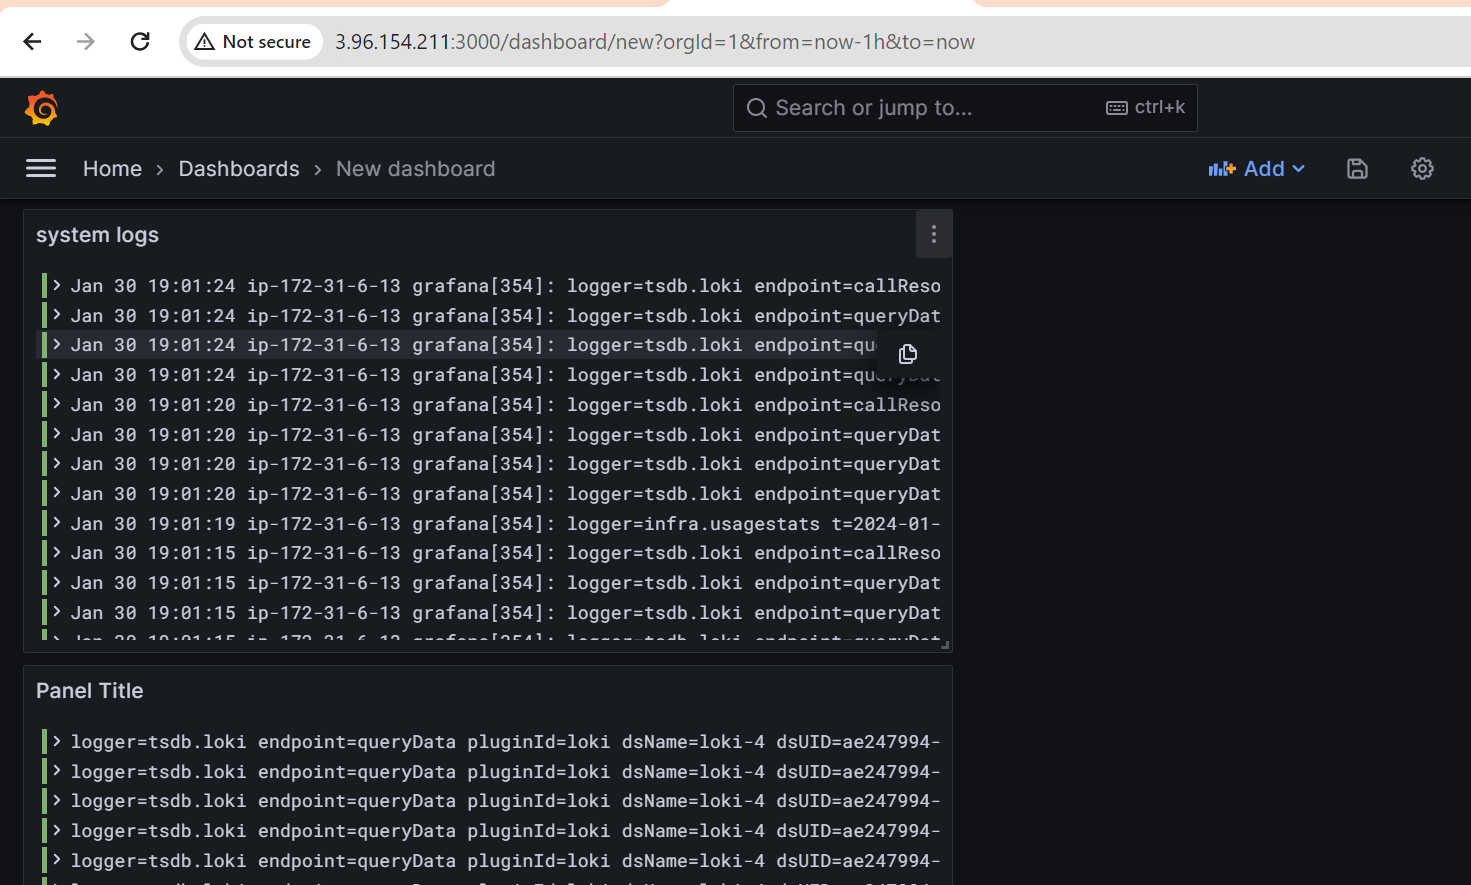
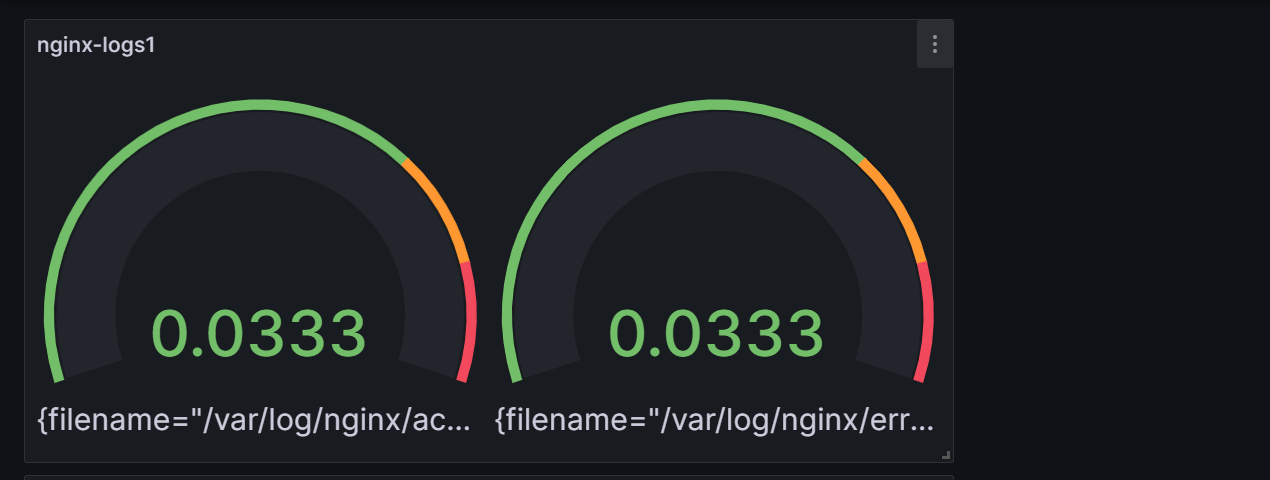
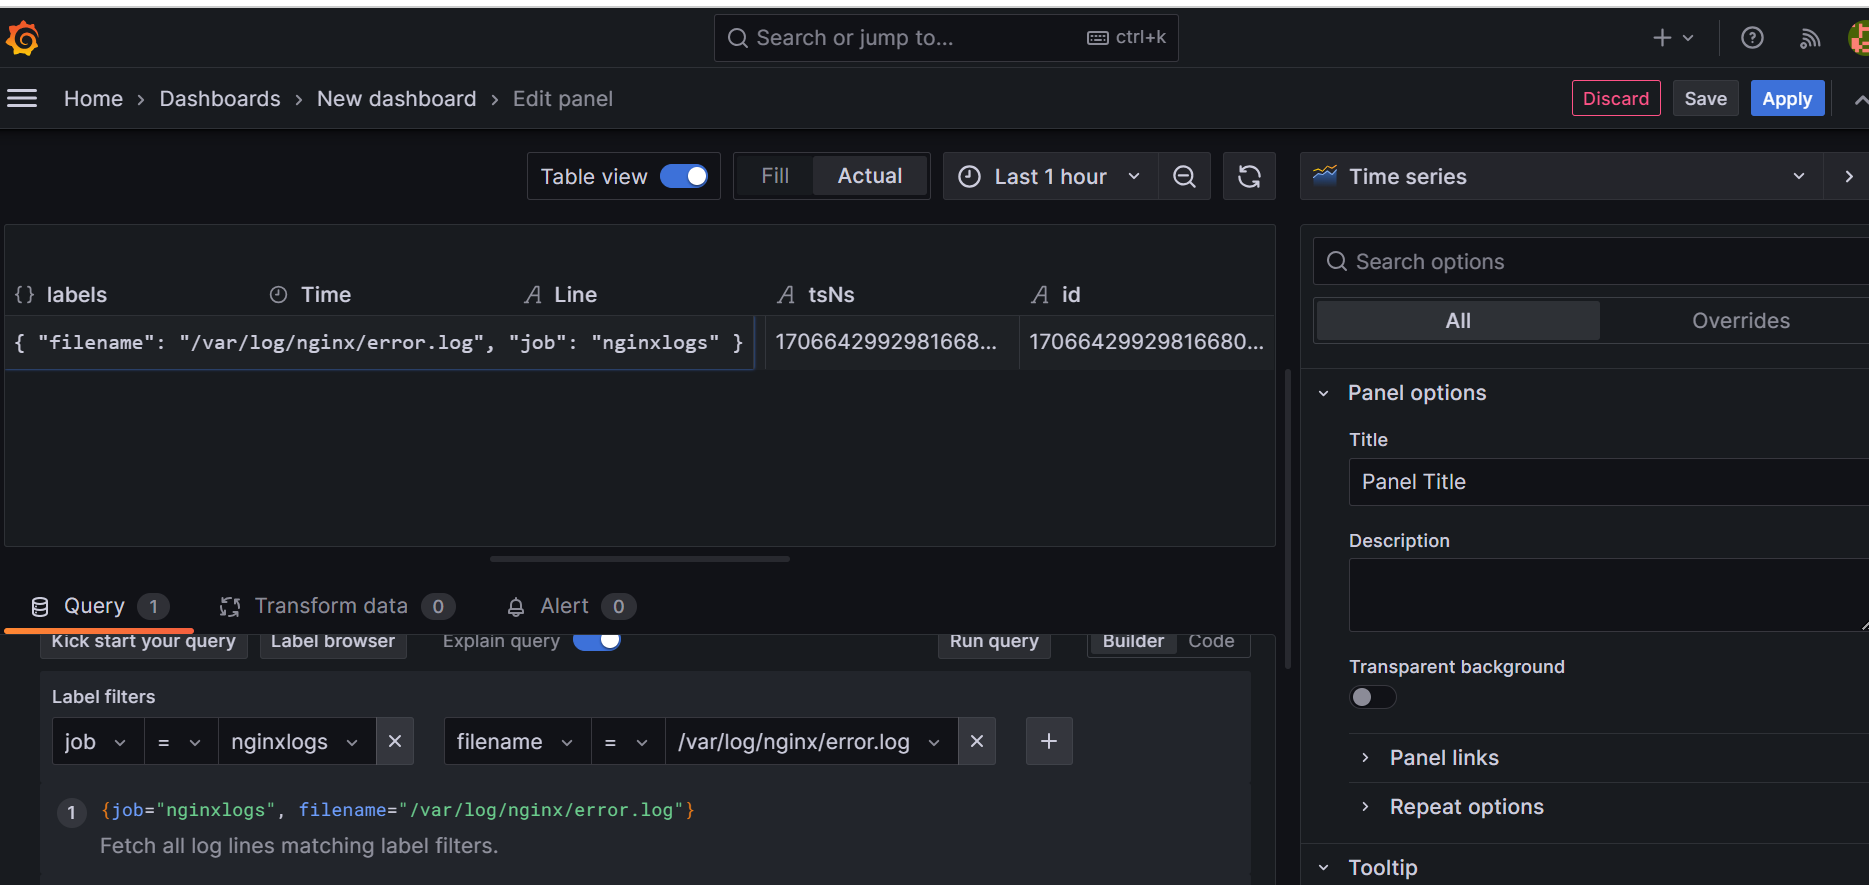
now go to grfana dashboard and add visualization of naginx logs:
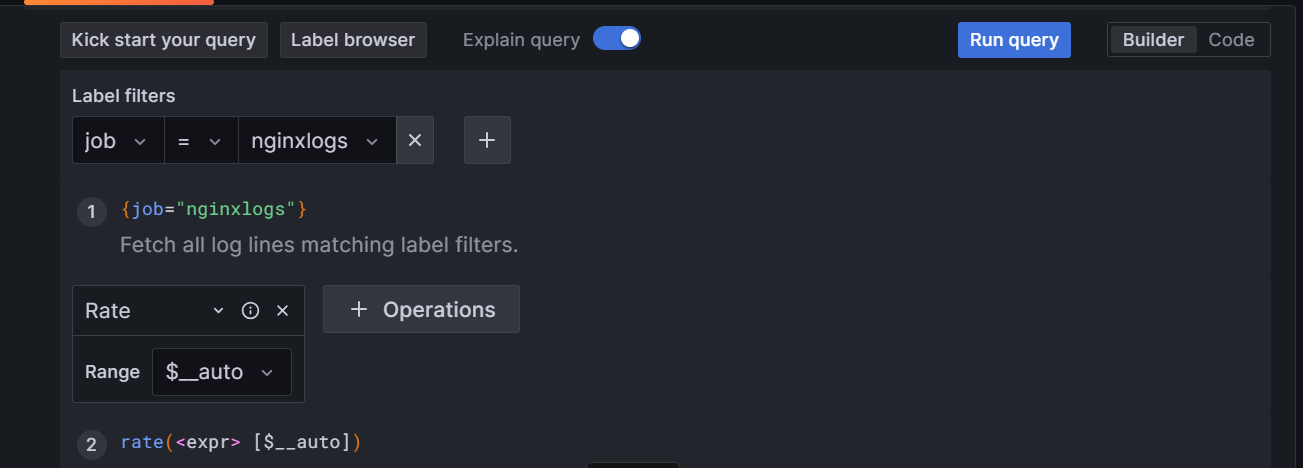
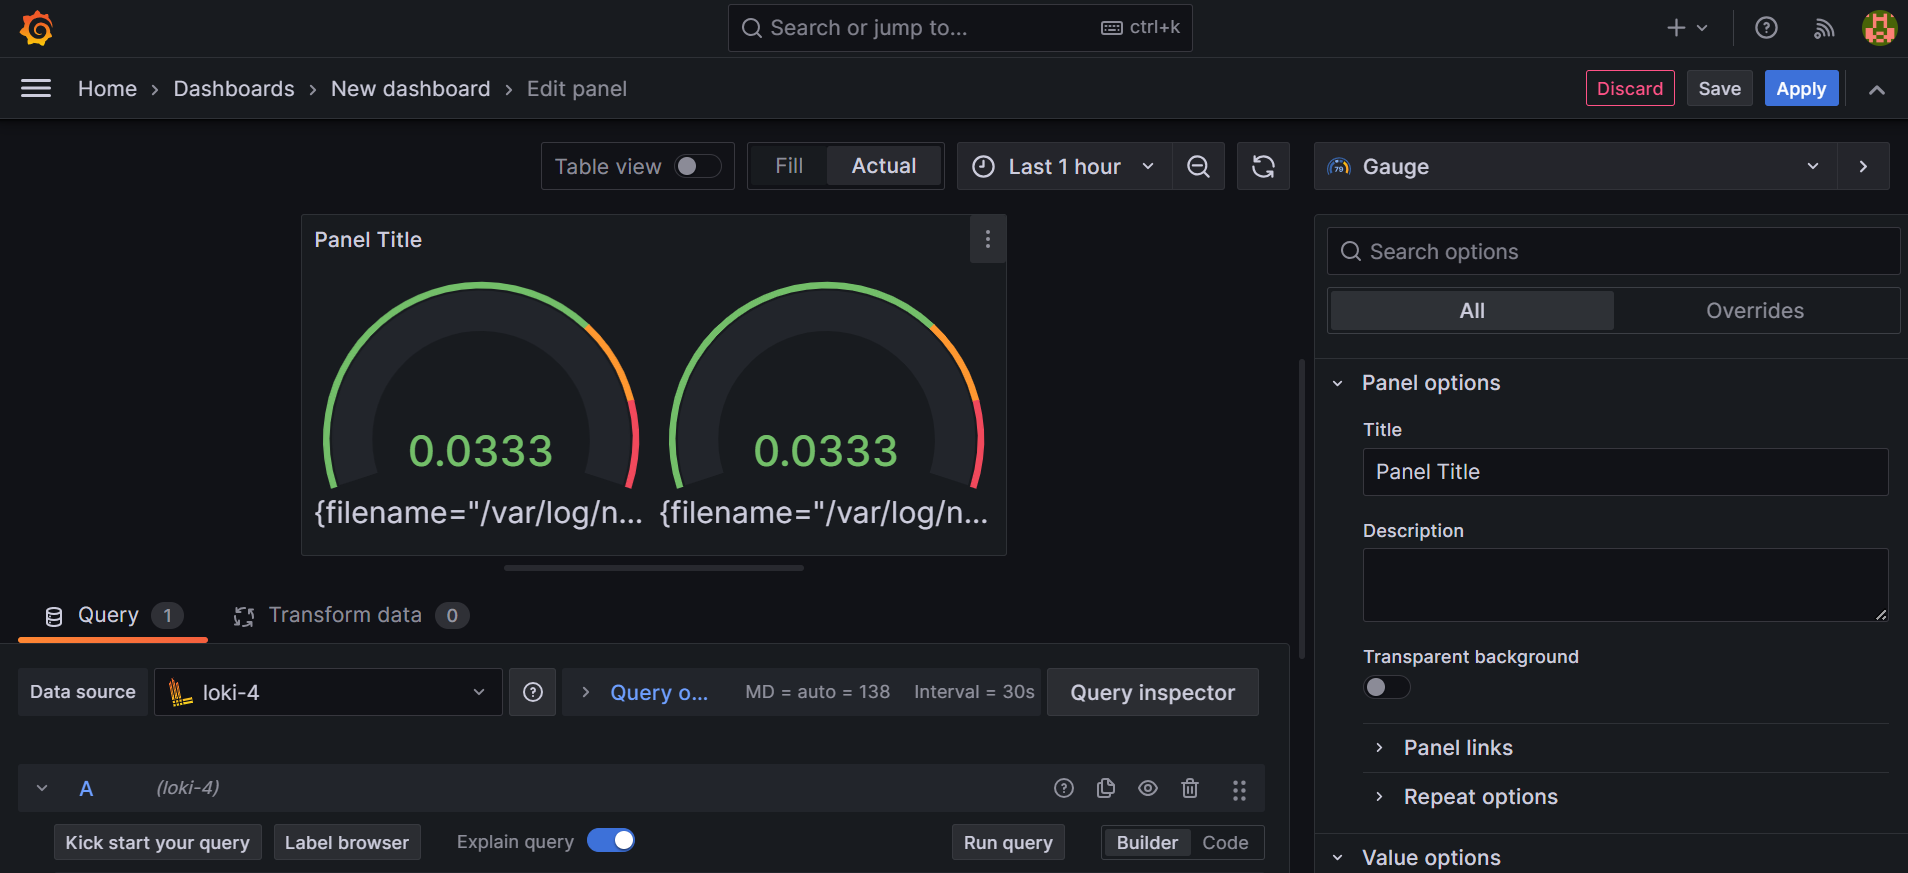
Select filename error.log
Thank you for joining us on this journey through the world of Grafana, a powerful and versatile platform for data visualization and monitoring. We hope this article has provided valuable insights into harnessing Grafana's capabilities to gain deeper insights into your data.
As you embark on your own projects and exploration of Grafana's features, may your dashboards be insightful, your alerts be timely, and your monitoring be robust. If you have any questions or feedback, feel free to reach out
Subscribe to my newsletter
Read articles from pardeep kaur directly inside your inbox. Subscribe to the newsletter, and don't miss out.
Written by

pardeep kaur
pardeep kaur
I am an experienced and dedicated professional with a background in Devops. I have obtained the AWS Solution Architect Associate certification, showcasing my proficiency in cloud computing technologies. Currently, I am pursuing my interest in DevOps, aiming to further expand my knowledge and contribute to the seamless integration of development and operations.