Day 72: Exploring Grafana-A Comprehensive Guide to Monitoring and Visualization🔥
 Vedant Thavkar
Welcome, DevOps enthusiasts! Today, we delve into the world of Grafana – an indispensable tool for smart resource monitoring and visualization. Let's unravel the essence of Grafana, its features, advantages, supported monitoring types, compatible databases, metrics, visualizations, and differentiate it from Prometheus.
What is Grafana?
Grafana is an open-source analytics and visualization platform designed to facilitate monitoring and observability in various systems. It offers rich features for creating, exploring, and sharing dynamic dashboards, making it a preferred choice for monitoring solutions across industries.
Features of Grafana:
Versatile Data Source Support: Grafana seamlessly integrates with numerous data sources, including Prometheus, Graphite, Elasticsearch, InfluxDB, and more, enabling users to aggregate data from disparate sources.
Flexible Dashboard Creation: It provides a user-friendly interface for building interactive dashboards with customizable panels, allowing users to monitor diverse metrics and data points.
Advanced Query Editor: Grafana offers a robust query editor that supports various query languages, empowering users to query and visualize complex data sets effortlessly.
Alerting and Notification: With built-in alerting capabilities, Grafana enables users to set up threshold-based alerts and receive notifications via email, Slack, PagerDuty, etc., ensuring proactive monitoring and timely response to anomalies.
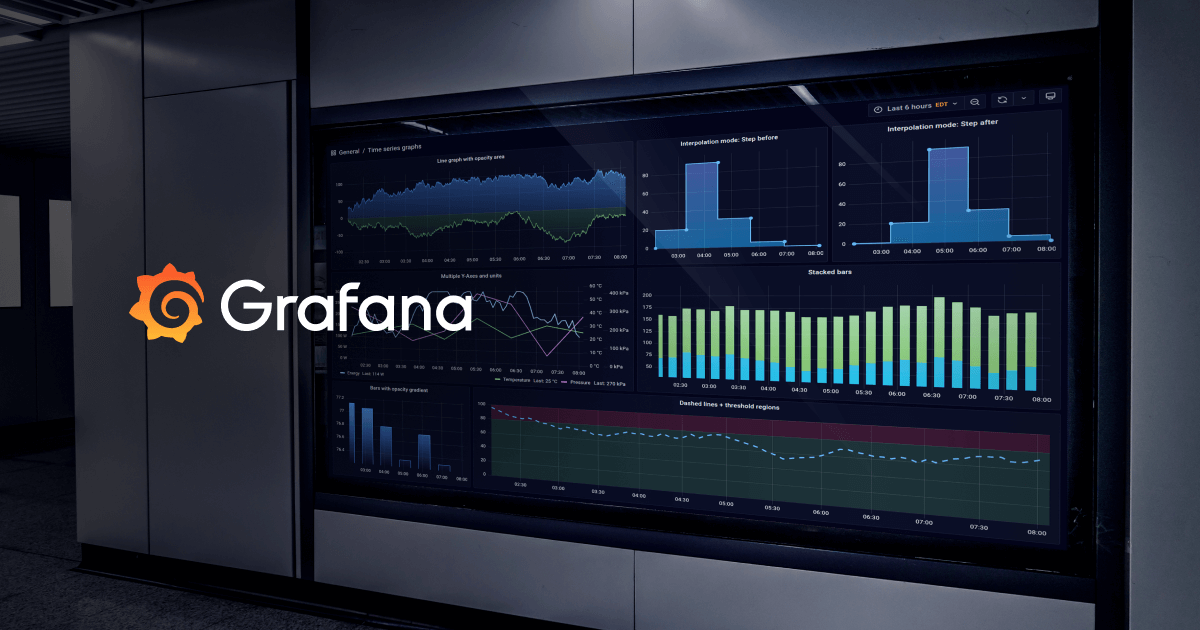
Rich Visualization Options: Grafana offers a plethora of visualization options, including graphs, gauges, heatmaps, histograms, and more, enabling users to represent data in a visually appealing and meaningful manner.
Templating and Annotations: It supports template variables and annotations, facilitating dynamic dashboards and contextualizing metrics with events or changes.
User Authentication and Authorization: Grafana provides robust authentication and authorization mechanisms, allowing organizations to manage user access and permissions effectively.
Why Grafana?
Grafana stands out for its intuitive interface, extensive plugin ecosystem, and comprehensive features, making it an ideal choice for:
Real-time monitoring of infrastructure, applications, and services.
Analyzing historical data trends and identifying performance bottlenecks.
Creating executive-level dashboards for business stakeholders.
Collaborating and sharing insights across teams.
Monitoring Capabilities with Grafana:
Grafana supports various monitoring types, including:
Infrastructure Monitoring: Monitor system metrics such as CPU usage, memory utilization, disk I/O, and network traffic across servers and virtual machines.
Application Monitoring: Track application performance metrics, database queries, API response times, and error rates to ensure optimal application health and reliability.
Container Monitoring: Monitor containerized environments using metrics from Docker, Kubernetes, or other container orchestration platforms, facilitating efficient resource utilization and scalability.
Cloud Monitoring: Grafana integrates with cloud provider APIs to fetch metrics related to compute instances, storage, databases, and networking services in cloud environments.
Supported Databases:
Grafana is database-agnostic, meaning it can work with a wide range of databases, including:
Time-Series Databases: Prometheus, InfluxDB, Graphite
Logging Databases: Elasticsearch, Loki
Relational Databases: MySQL, PostgreSQL, Microsoft SQL Server
Metrics and Visualizations in Grafana:
Metrics in Grafana refer to the quantitative data points collected from various sources, representing the performance, health, and behavior of systems or applications. These metrics are visualized using different types of visualizations such as line charts, bar graphs, pie charts, heatmaps, and tables, providing insights into data trends, patterns, and anomalies.
Grafana vs. Prometheus:
While Grafana and Prometheus are often used together in monitoring stacks, they serve different purposes:
Grafana: Primarily a visualization tool, Grafana excels in creating dynamic dashboards and exploring data from multiple sources. It provides a centralized platform for monitoring, visualization, and collaboration.
Prometheus: A time-series database and monitoring system, Prometheus specializes in collecting and storing metrics from various targets, performing alerting, and querying metric data. It focuses on metrics collection, scraping, and alerting.
In summary, Grafana complements Prometheus by offering advanced visualization and dashboarding capabilities, enhancing the overall monitoring experience.
In conclusion, Grafana emerges as a powerful ally in the realm of DevOps, enabling organizations to gain actionable insights, optimize performance, and ensure reliability across their infrastructure and applications. With its rich features, extensive integrations, and user-friendly interface, Grafana continues to be a cornerstone in modern monitoring and observability solutions.
Happy monitoring! 🚀
Subscribe to my newsletter
Read articles from Vedant Thavkar directly inside your inbox. Subscribe to the newsletter, and don't miss out.
Written by

Vedant Thavkar
Vedant Thavkar
"DevOps enthusiast and aspiring engineer. Currently honing skills in streamlining development workflows and automating infrastructure. Learning AWS, Docker, Kubernetes, Python, and Ansible. Eager to contribute and grow within the DevOps community."