Day 74: Monitoring Linux and Windows EC2 Instances with Grafana, Loki, and Promtail
 Vedant Thavkar
Introduction
In this article, we will explore how to set up a monitoring system for Linux and Windows EC2 instances using Grafana, Loki, and Promtail. We'll walk through the practical steps of installing and configuring these tools, and then demonstrate how to monitor logs from an NGINX server running on an EC2 instance.
Prerequisites
Before we begin, make sure you have the following:
Access to Linux and Windows EC2 instances on AWS.
Basic knowledge of Linux system administration.
A running instance of Grafana, Loki, and Promtail.
Setting Up Grafana on Linux EC2 Instance
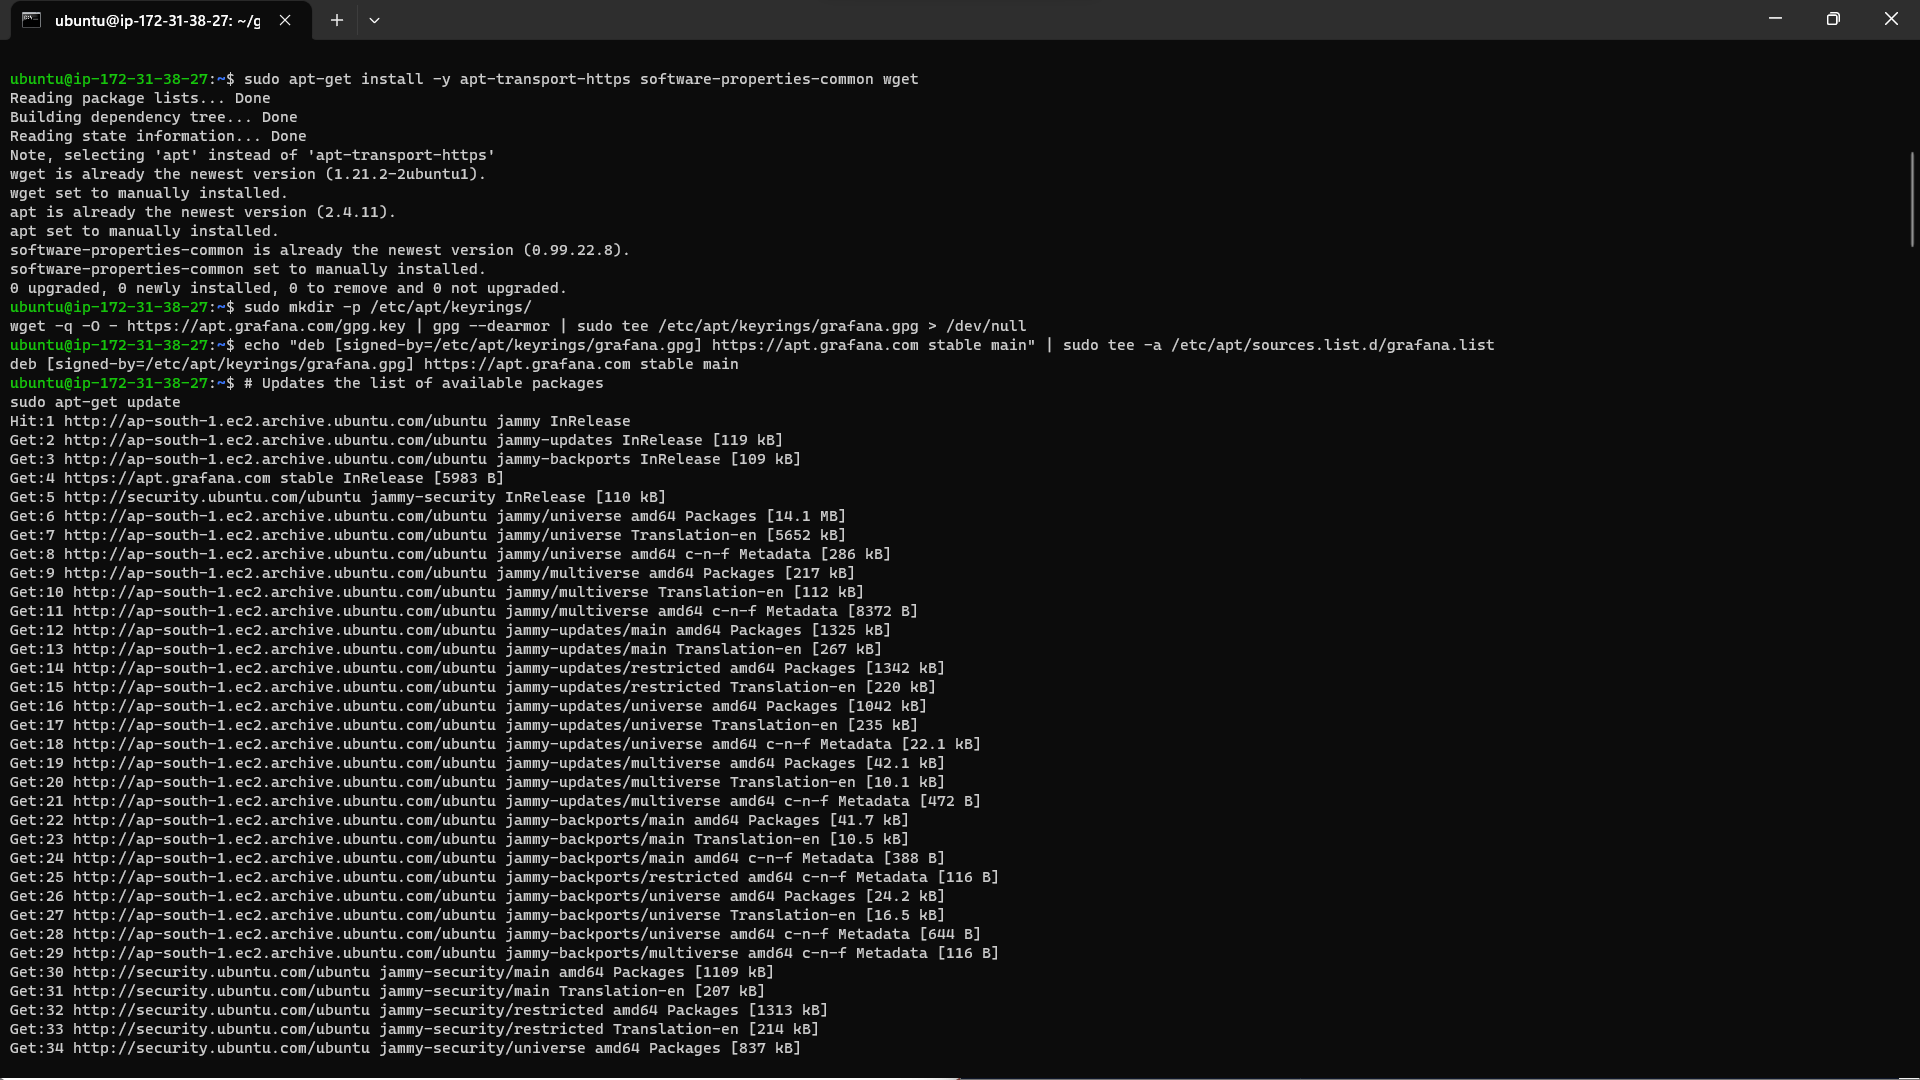
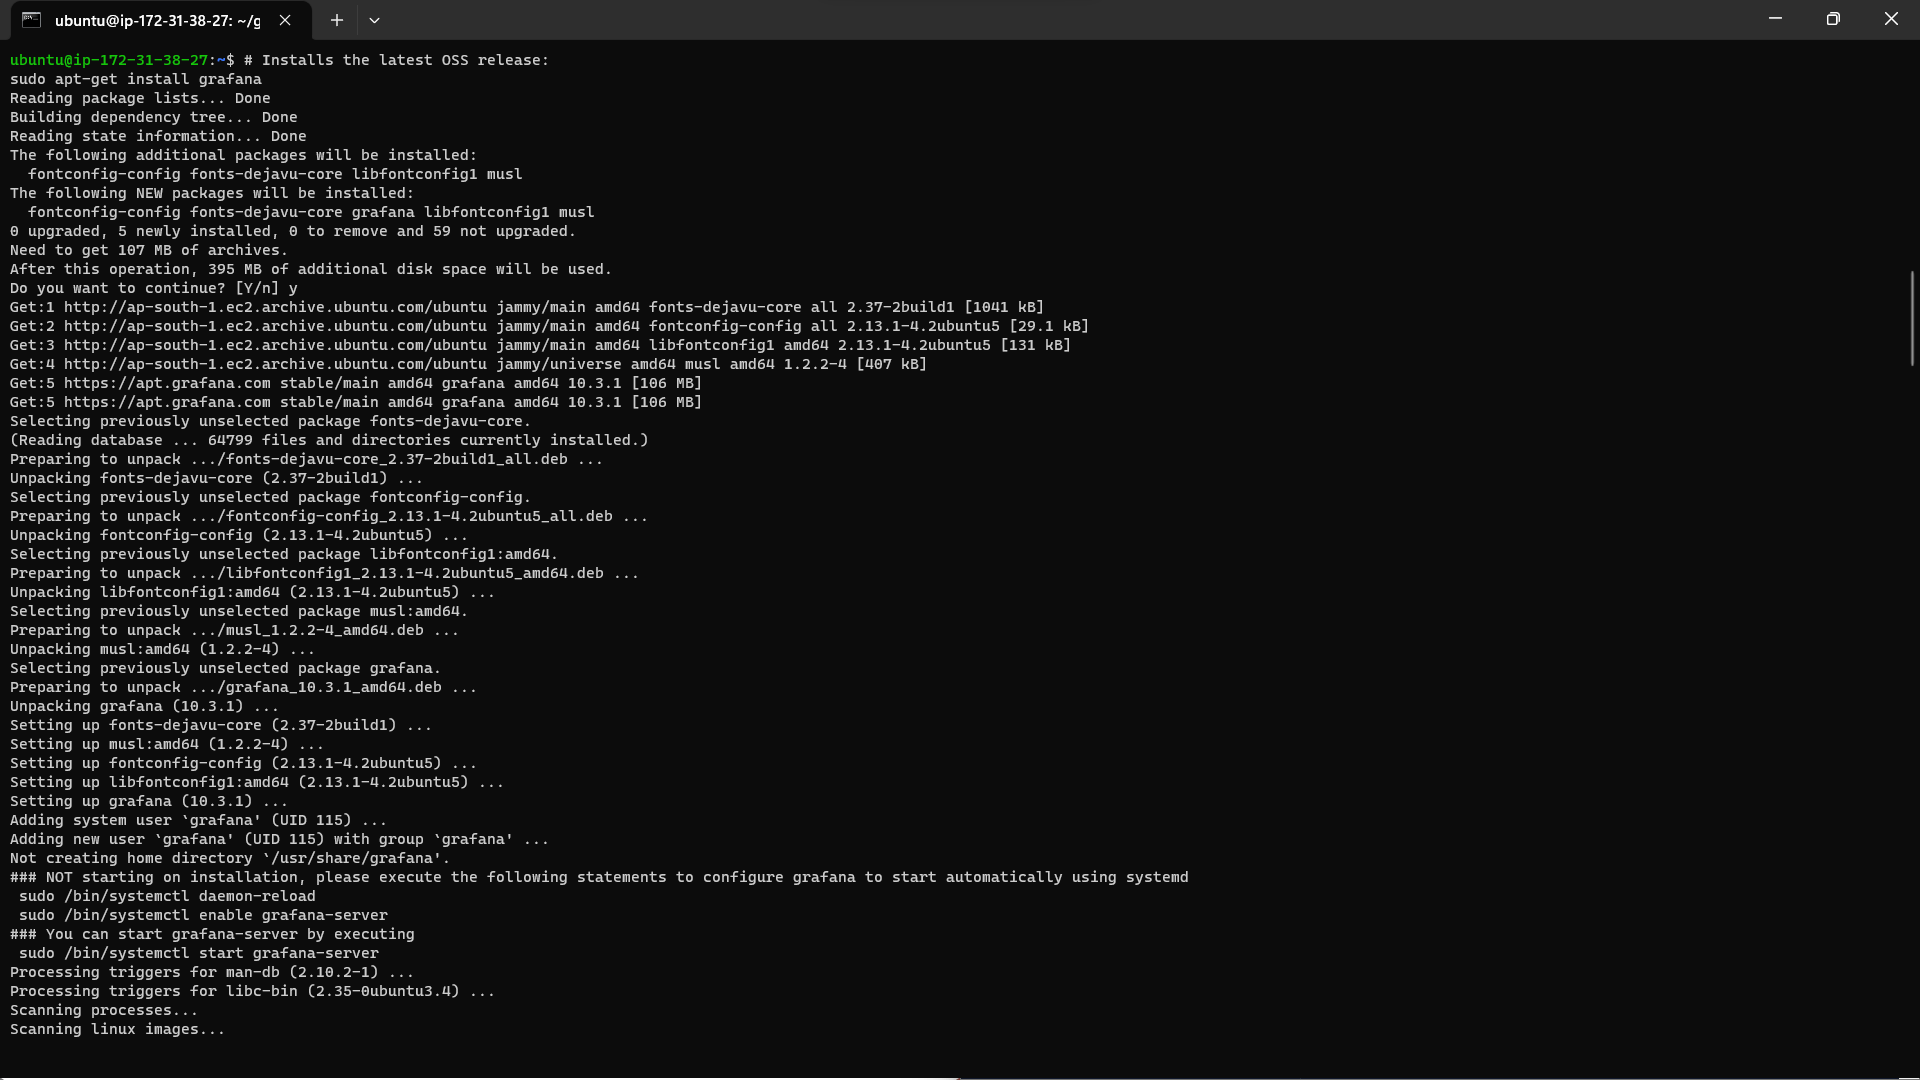
Install Grafana: SSH into your Linux EC2 instance and install Grafana using the appropriate package manager or by downloading the binary from the official website.
Access Grafana: Once installed, access Grafana via the web interface using your EC2 instance's public IP address and port 3000.
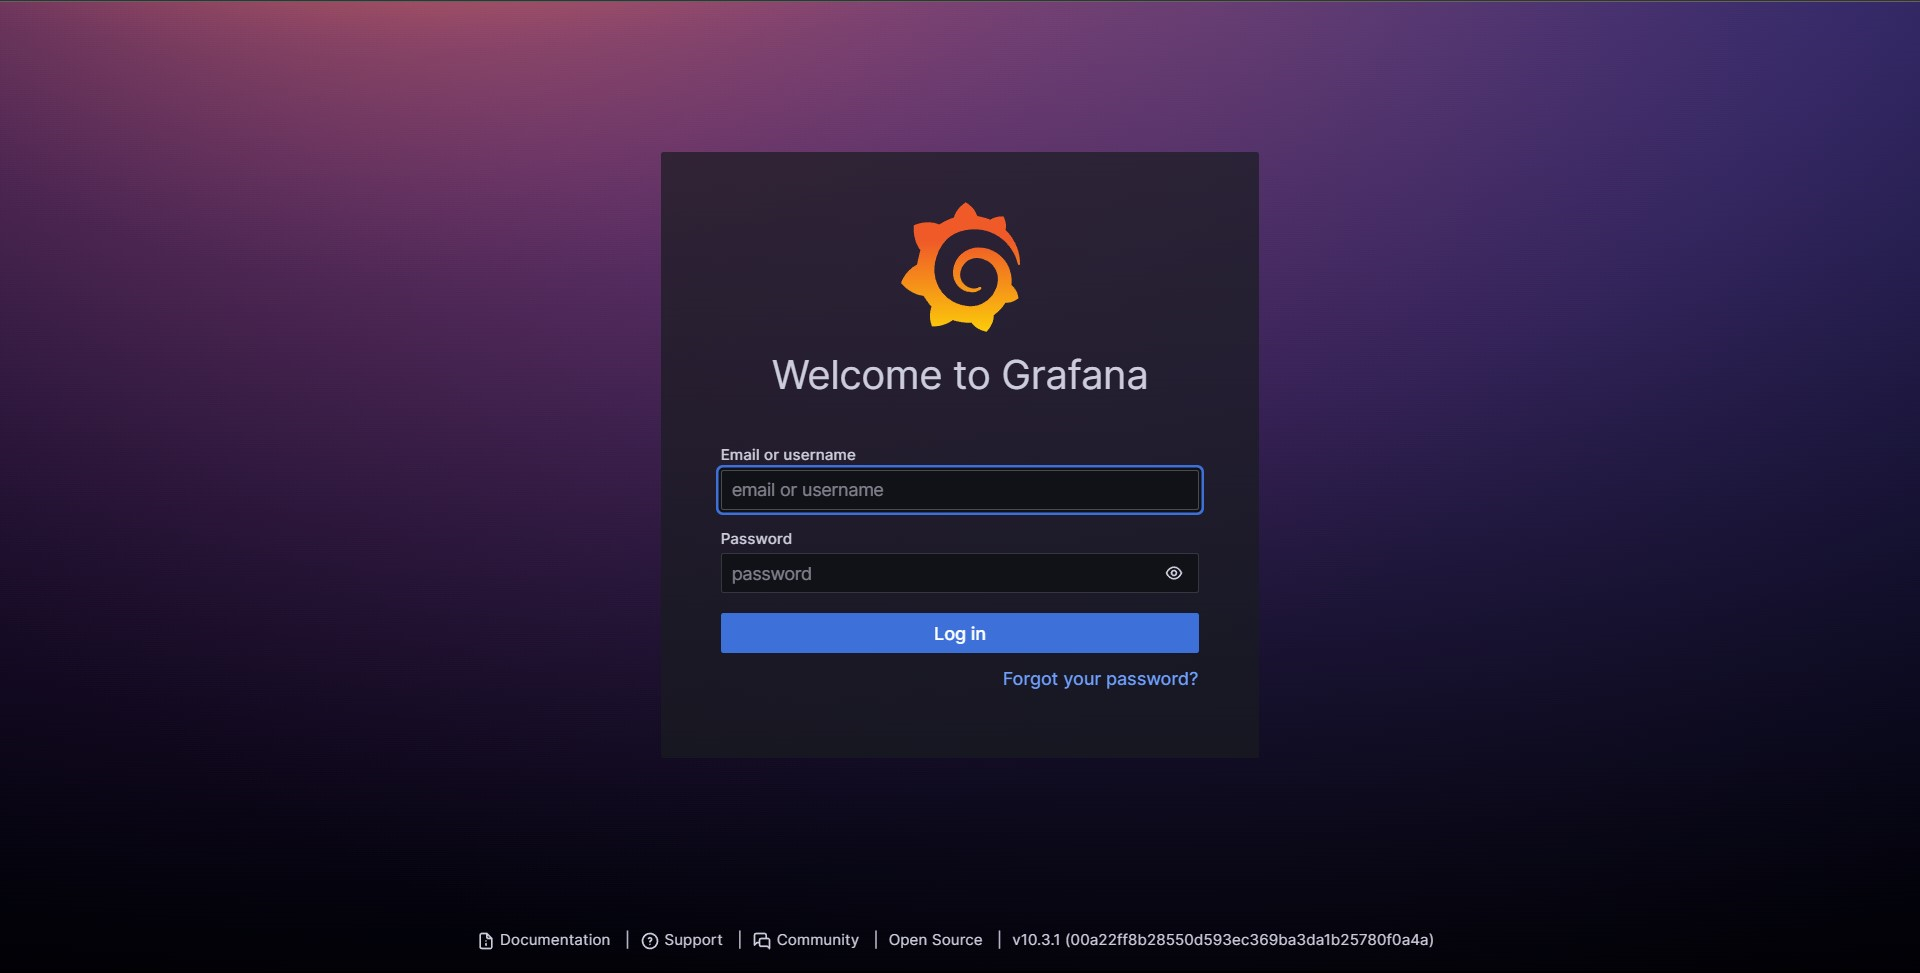
Secure Grafana: Log in with the default credentials (admin/admin) and change the password for security.
Setting Up Loki and Promtail on Linux EC2 Instance
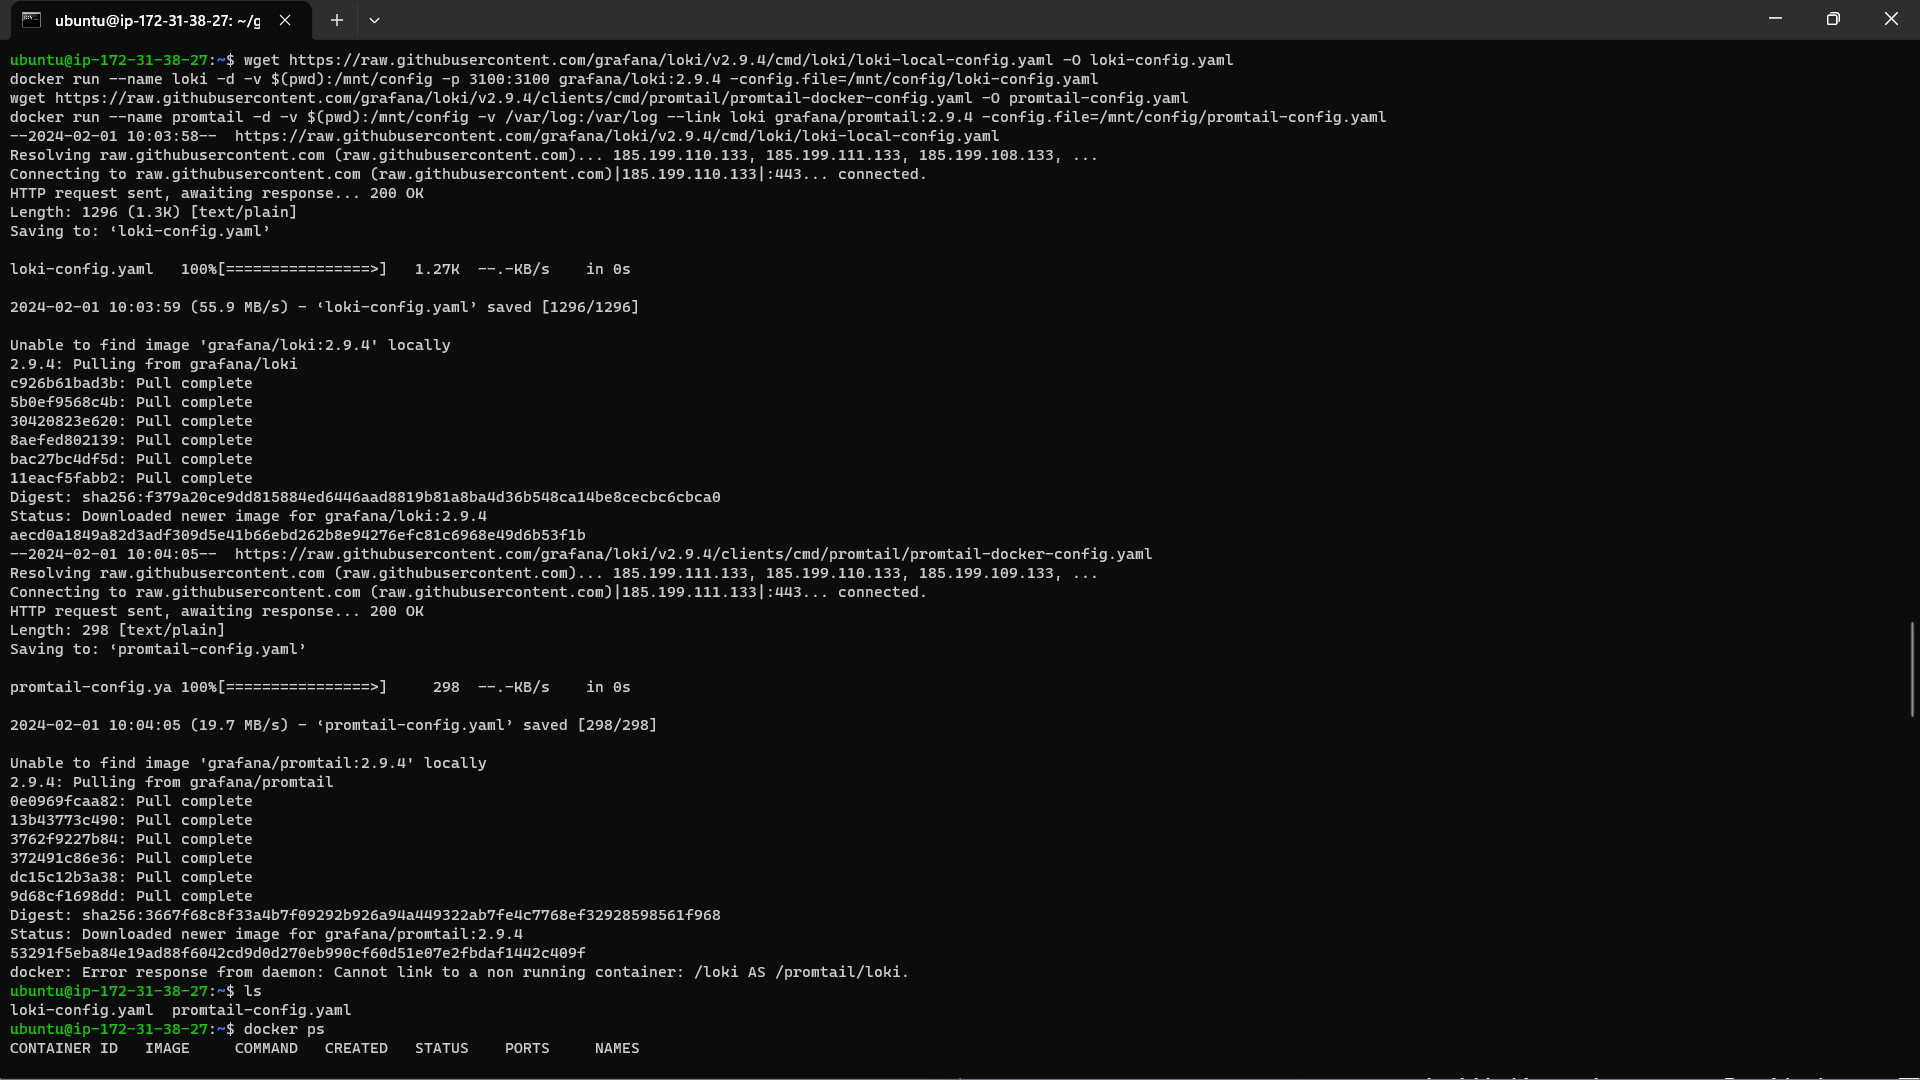
Install Loki: Install Loki on your Linux EC2 instance following the official installation instructions.
Configure Loki: Configure Loki to store logs from different sources and specify the storage backend.
Install Promtail: Install Promtail on the Linux EC2 instance to collect and forward logs to Loki.
Configure Promtail: Configure Promtail to scrape logs from relevant log files on the Linux EC2 instance and send them to Loki.
Configuring Data Source in Grafana
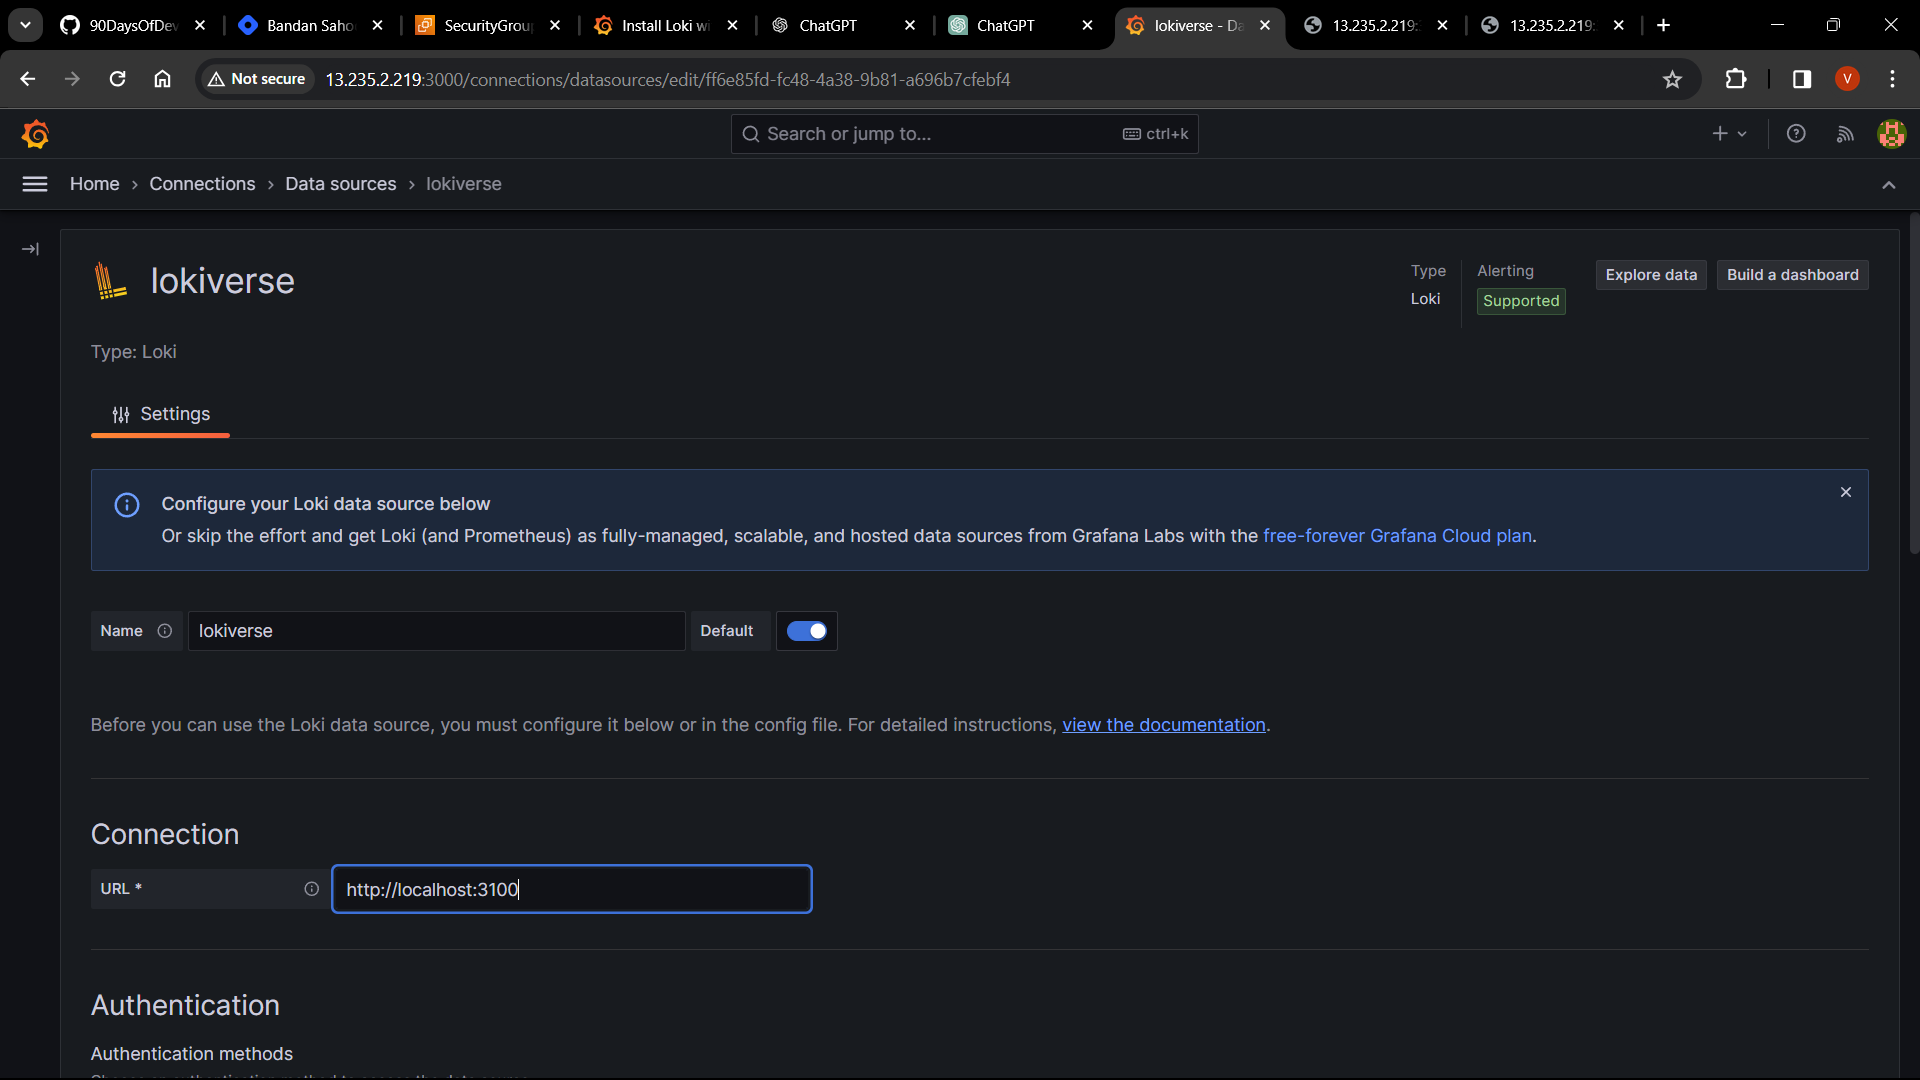
Add Loki Data Source: In Grafana, navigate to Configuration > Data Sources and add Loki as a data source. Provide the URL of the Loki server (typically
http://localhost:3100).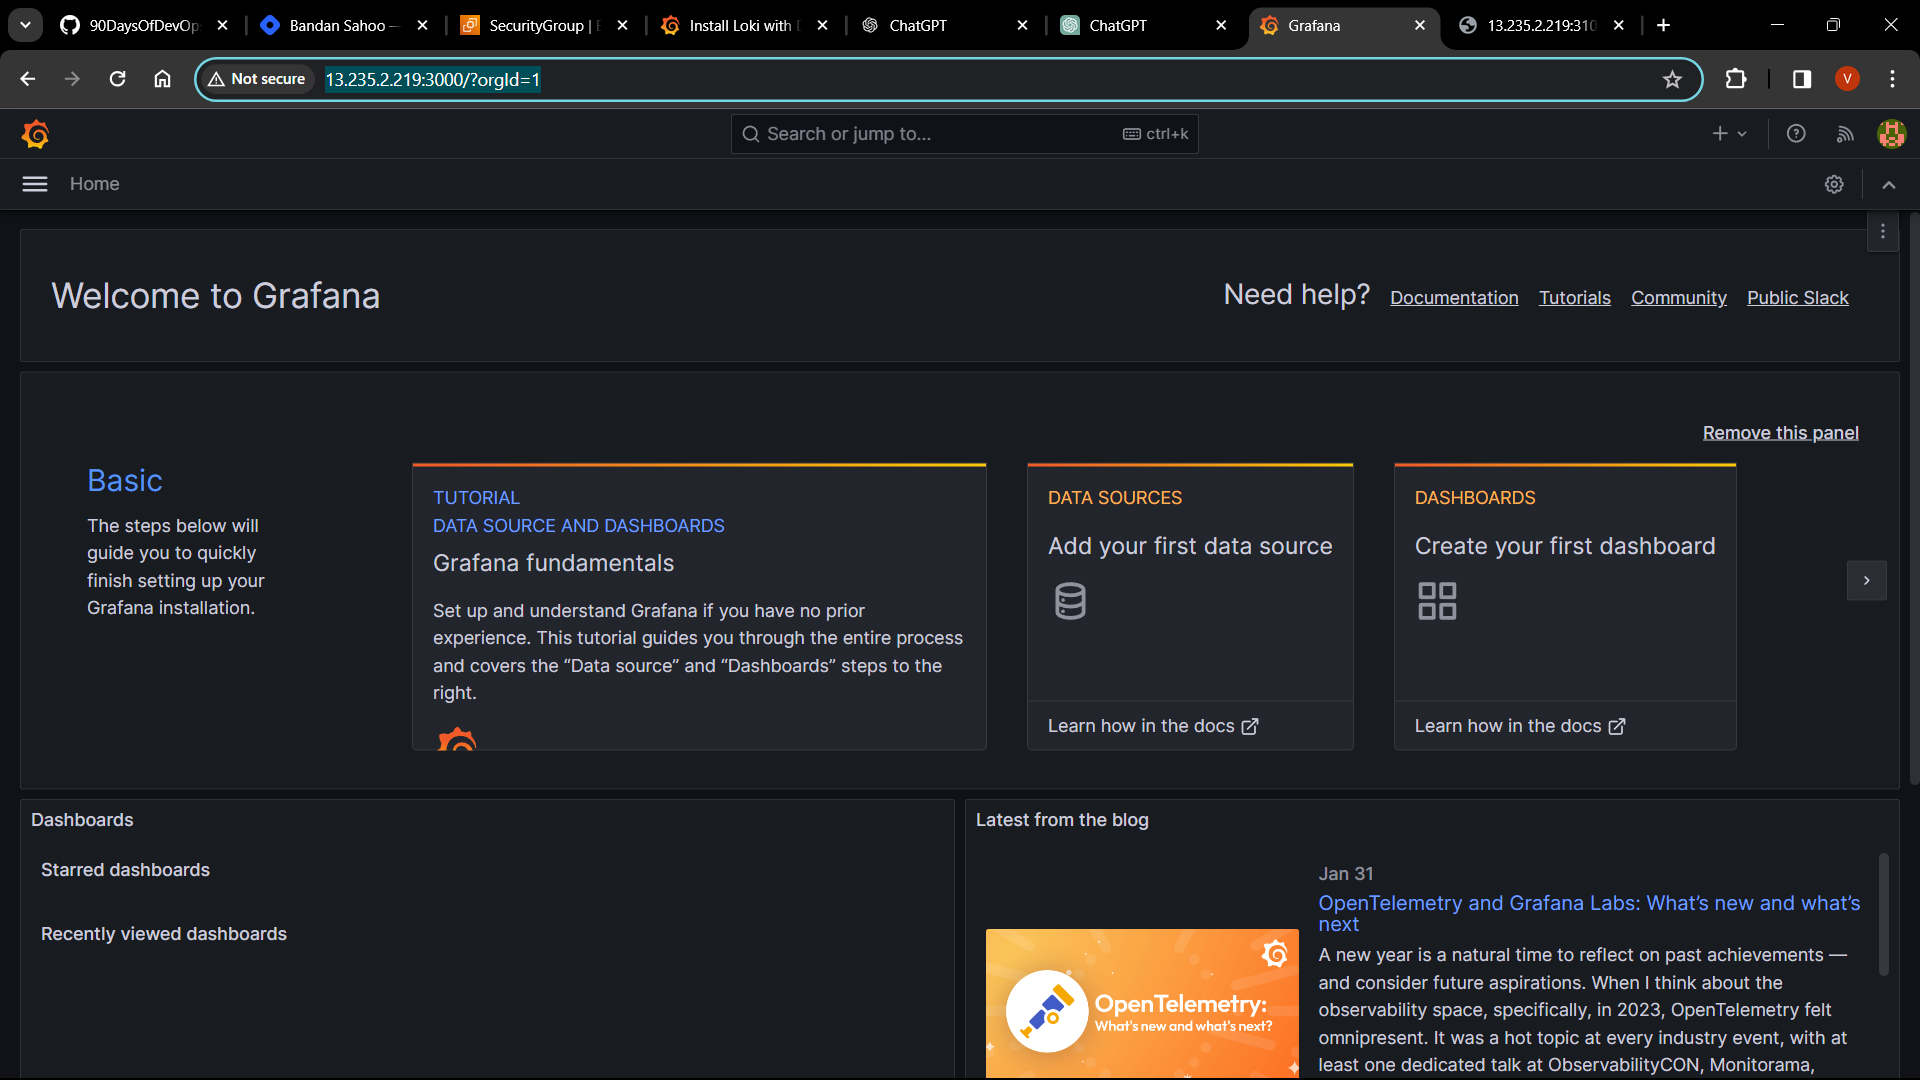
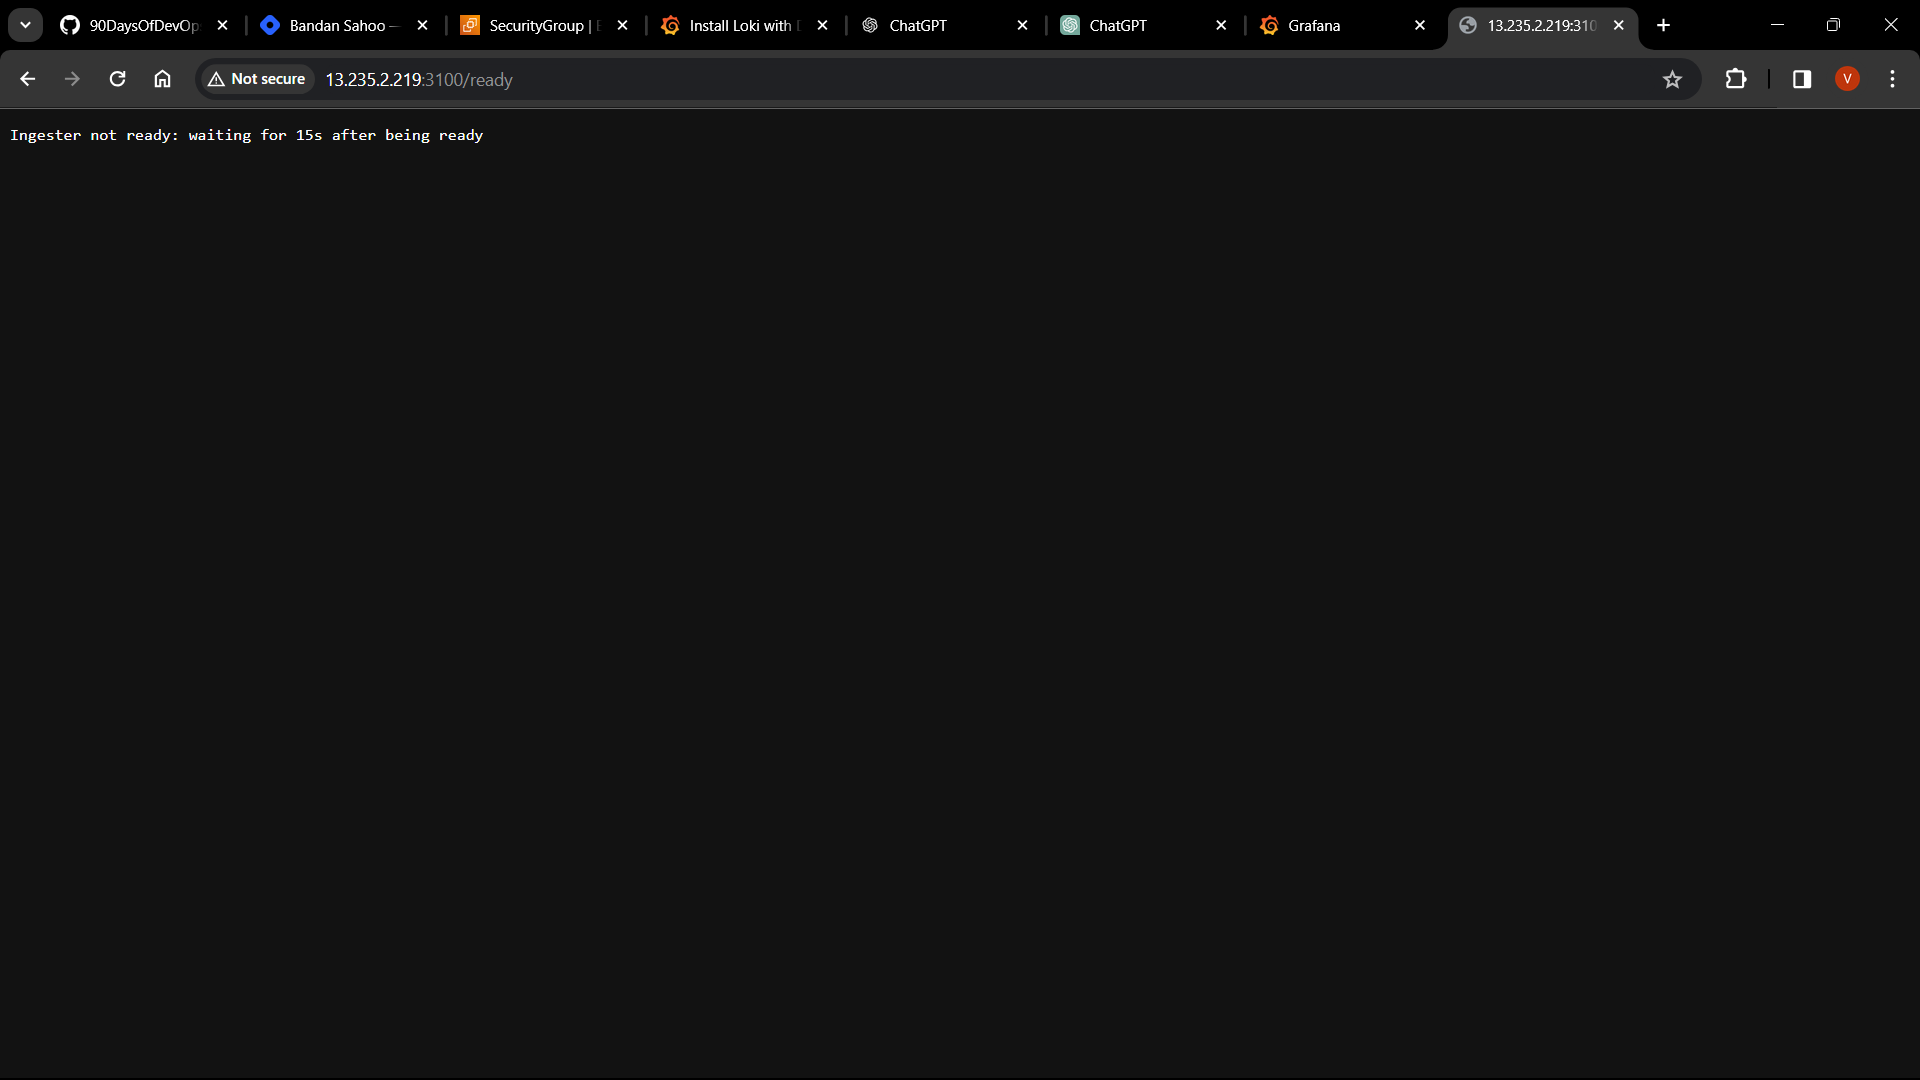
Refresh it After 15 Sec.
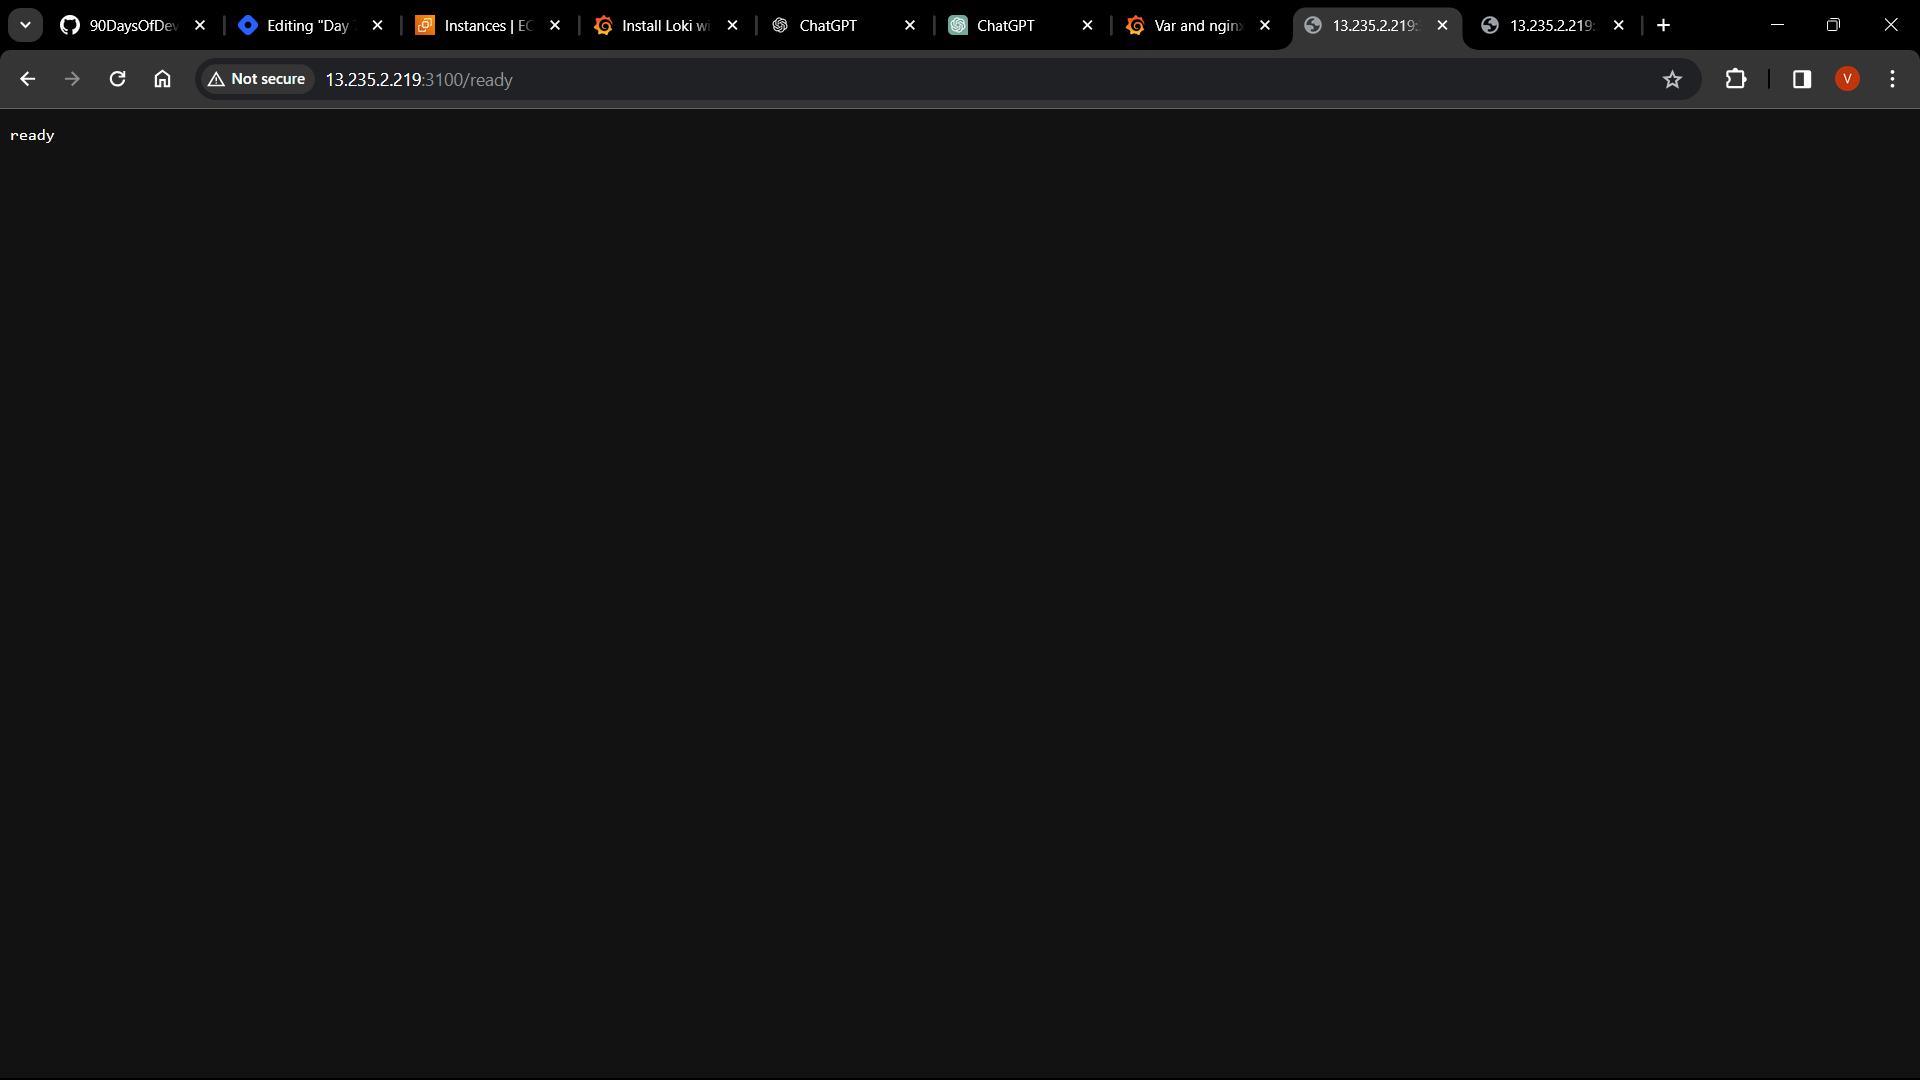
Save Configuration: Save the data source configuration in Grafana.
Setting Up NGINX Server on Linux EC2 Instance
Install NGINX: SSH into your Linux EC2 instance and install NGINX using the appropriate package manager (
aptfor Ubuntu).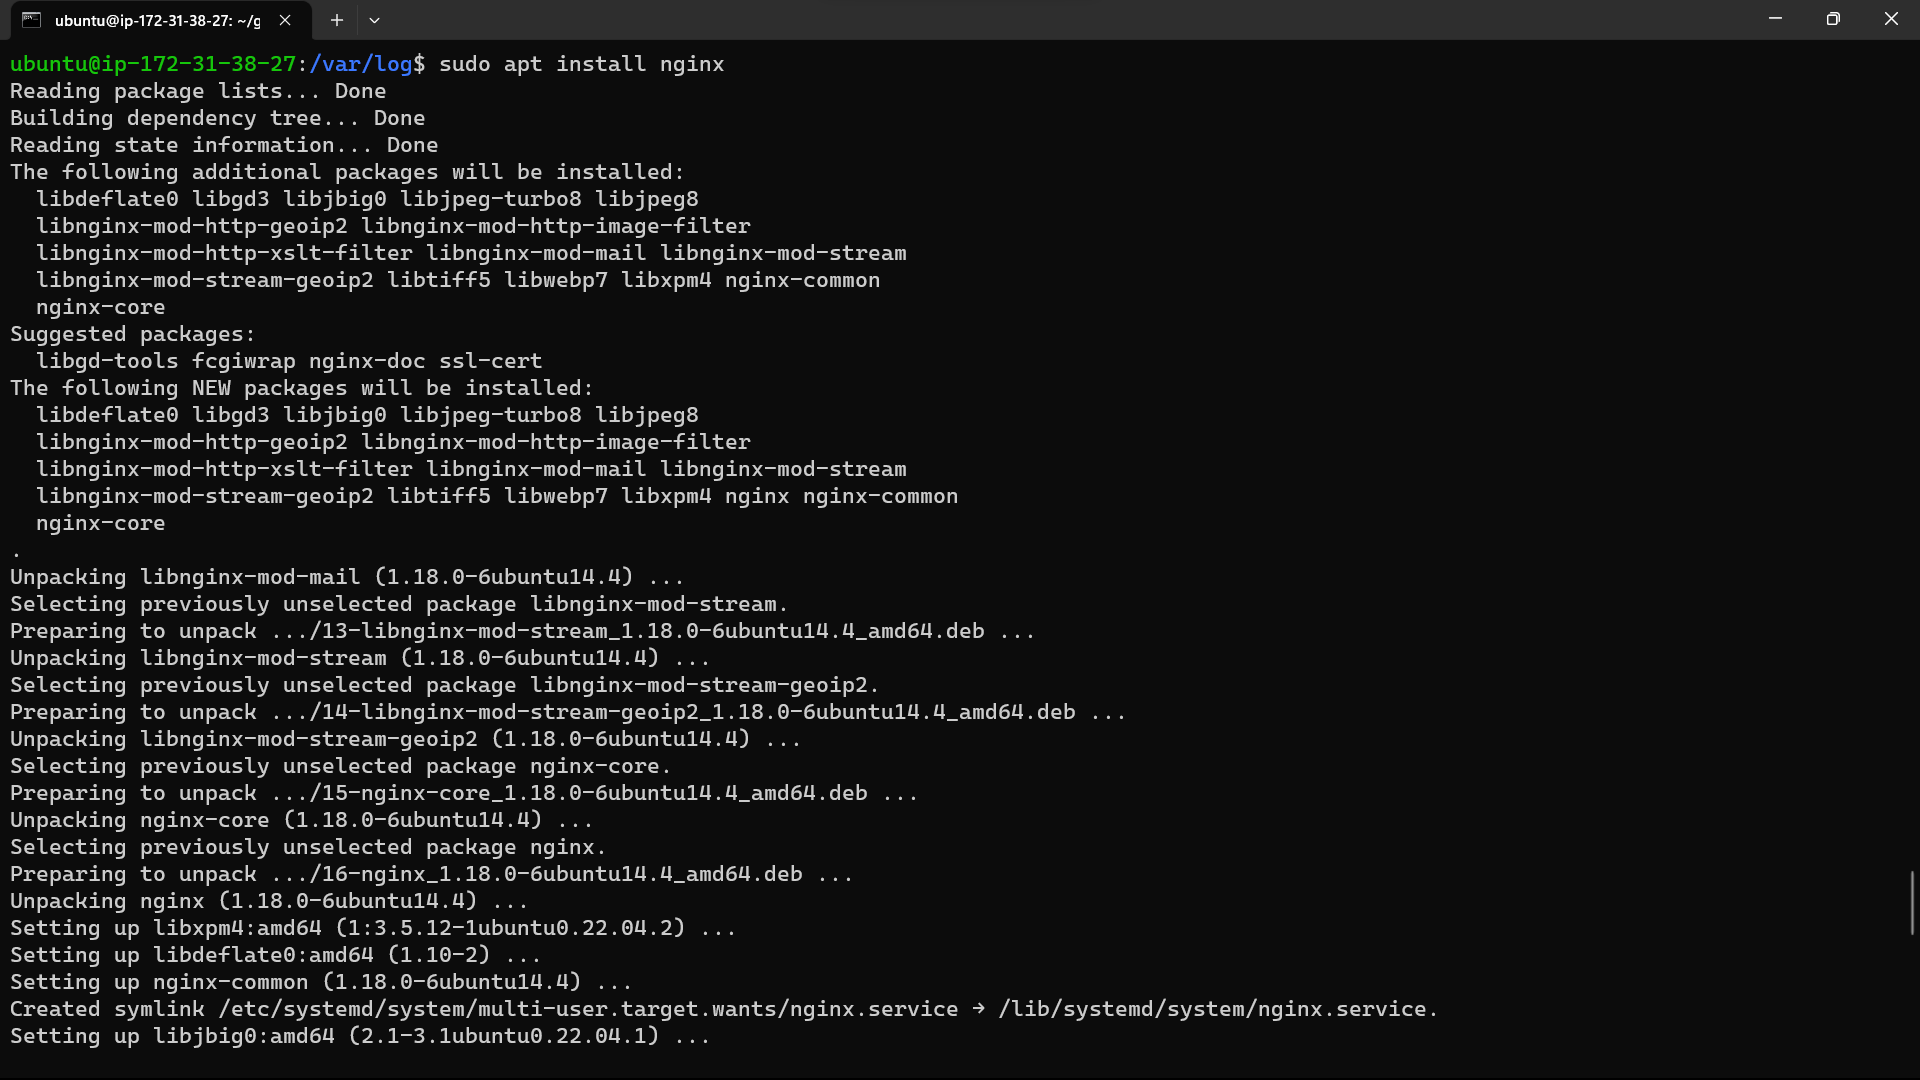
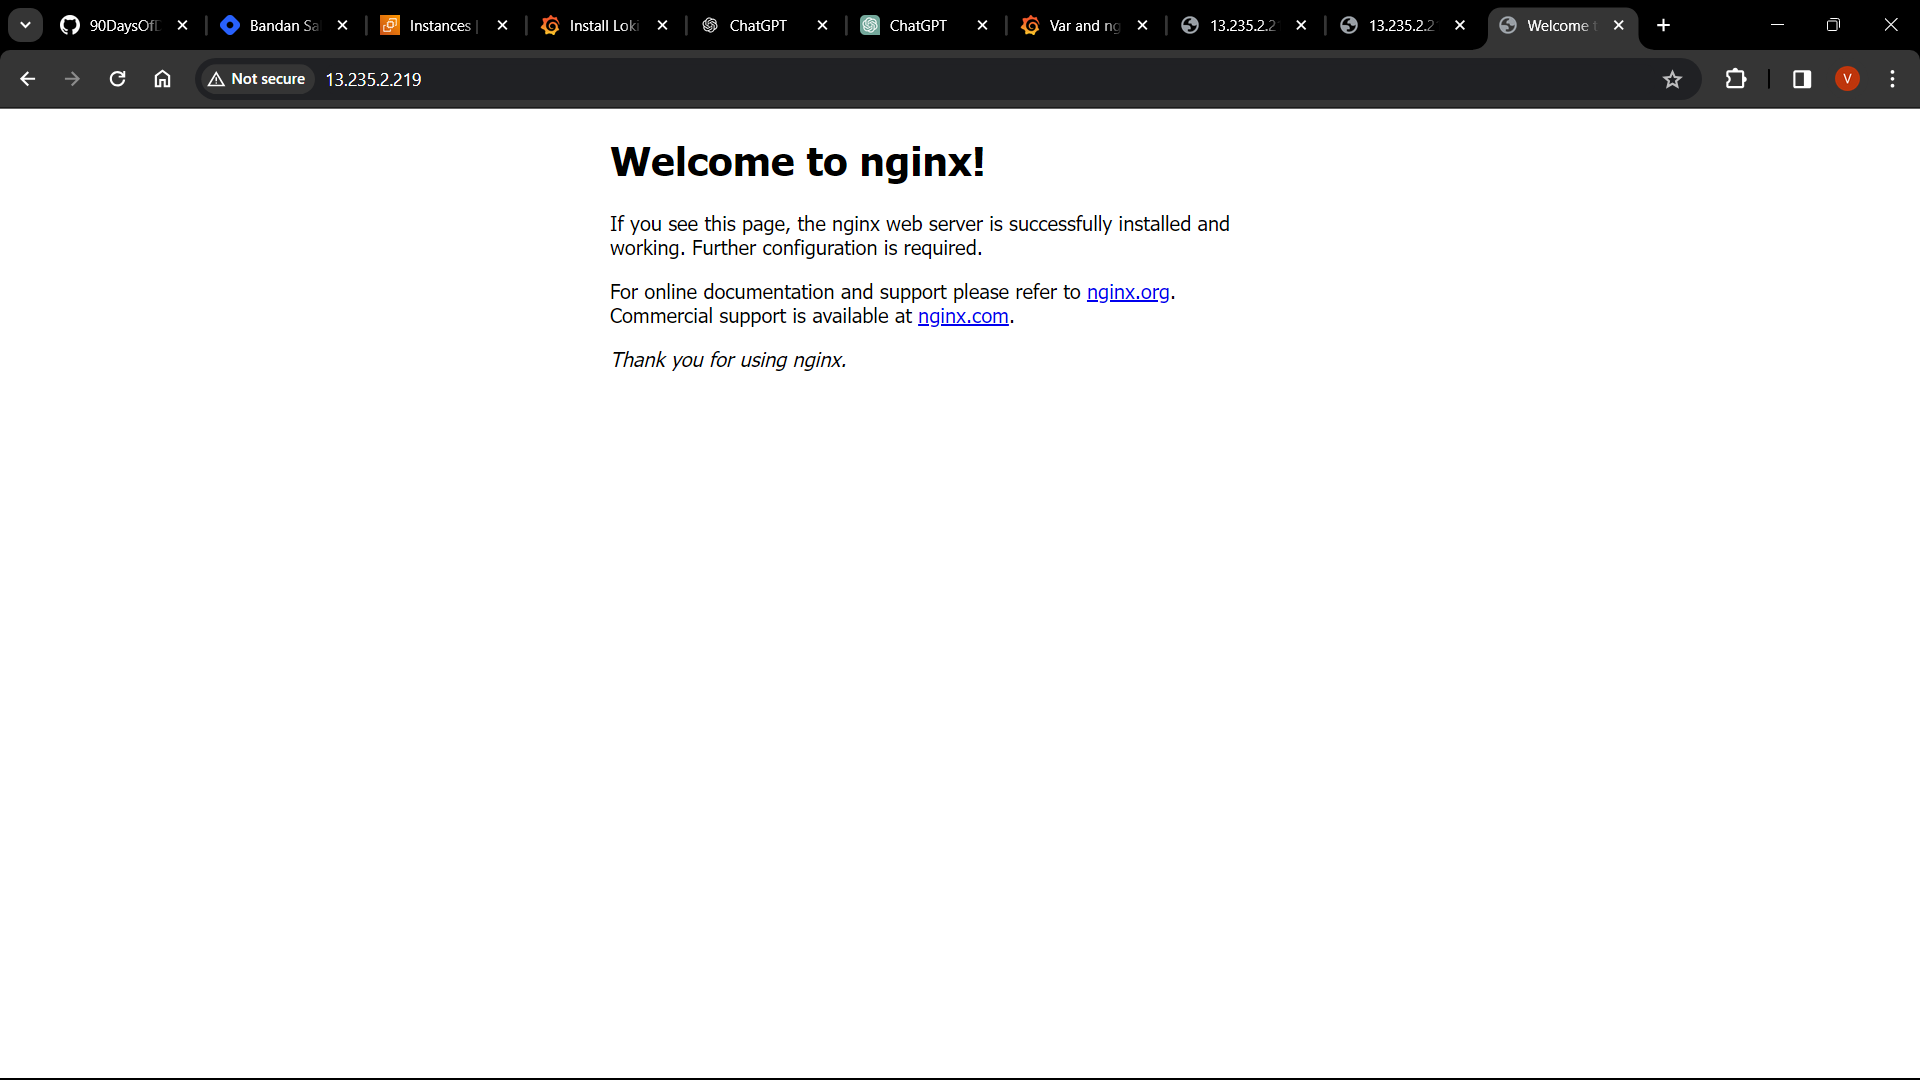
Configure NGINX: Configure NGINX and log access and error information to files.
Creating Dashboards in Grafana
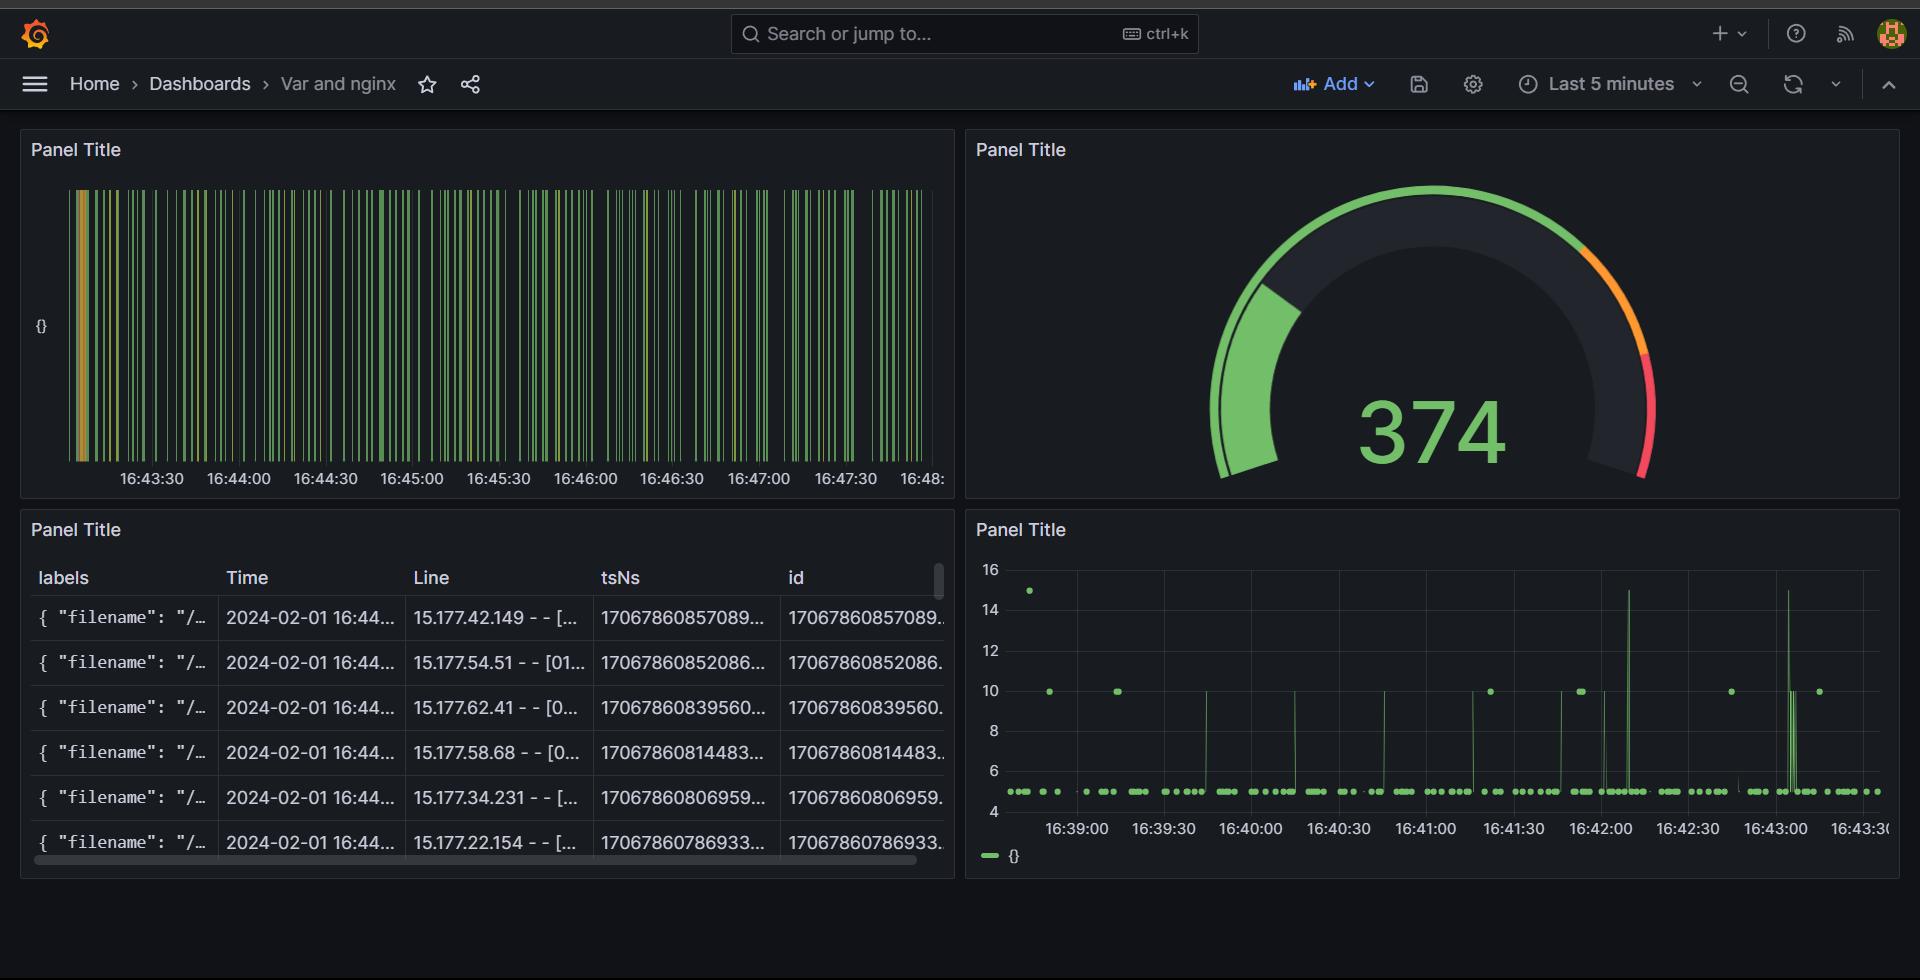
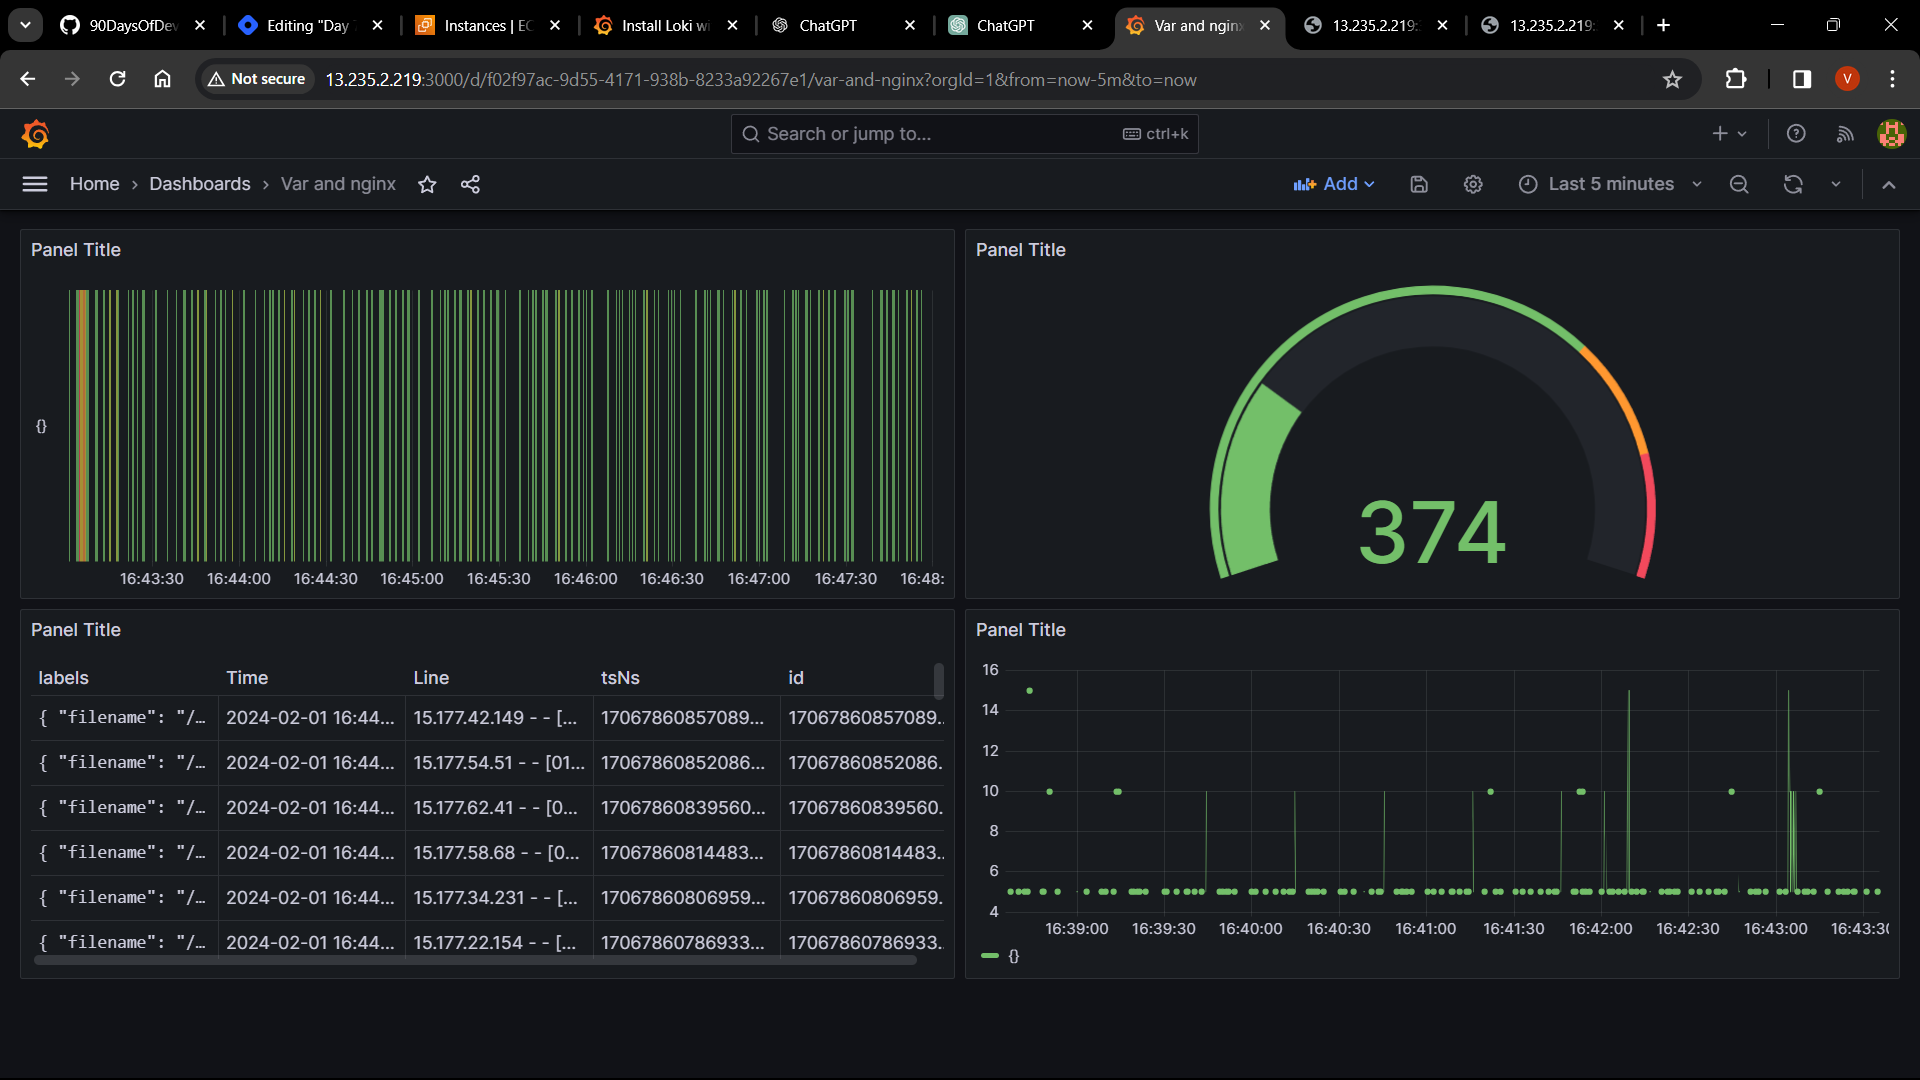
Visualize NGINX Logs: Create dashboards in Grafana to visualize logs collected from the NGINX server running on the Linux EC2 instance.
Design Dashboards: Use Grafana's query language to create queries that retrieve data from Loki data sources.
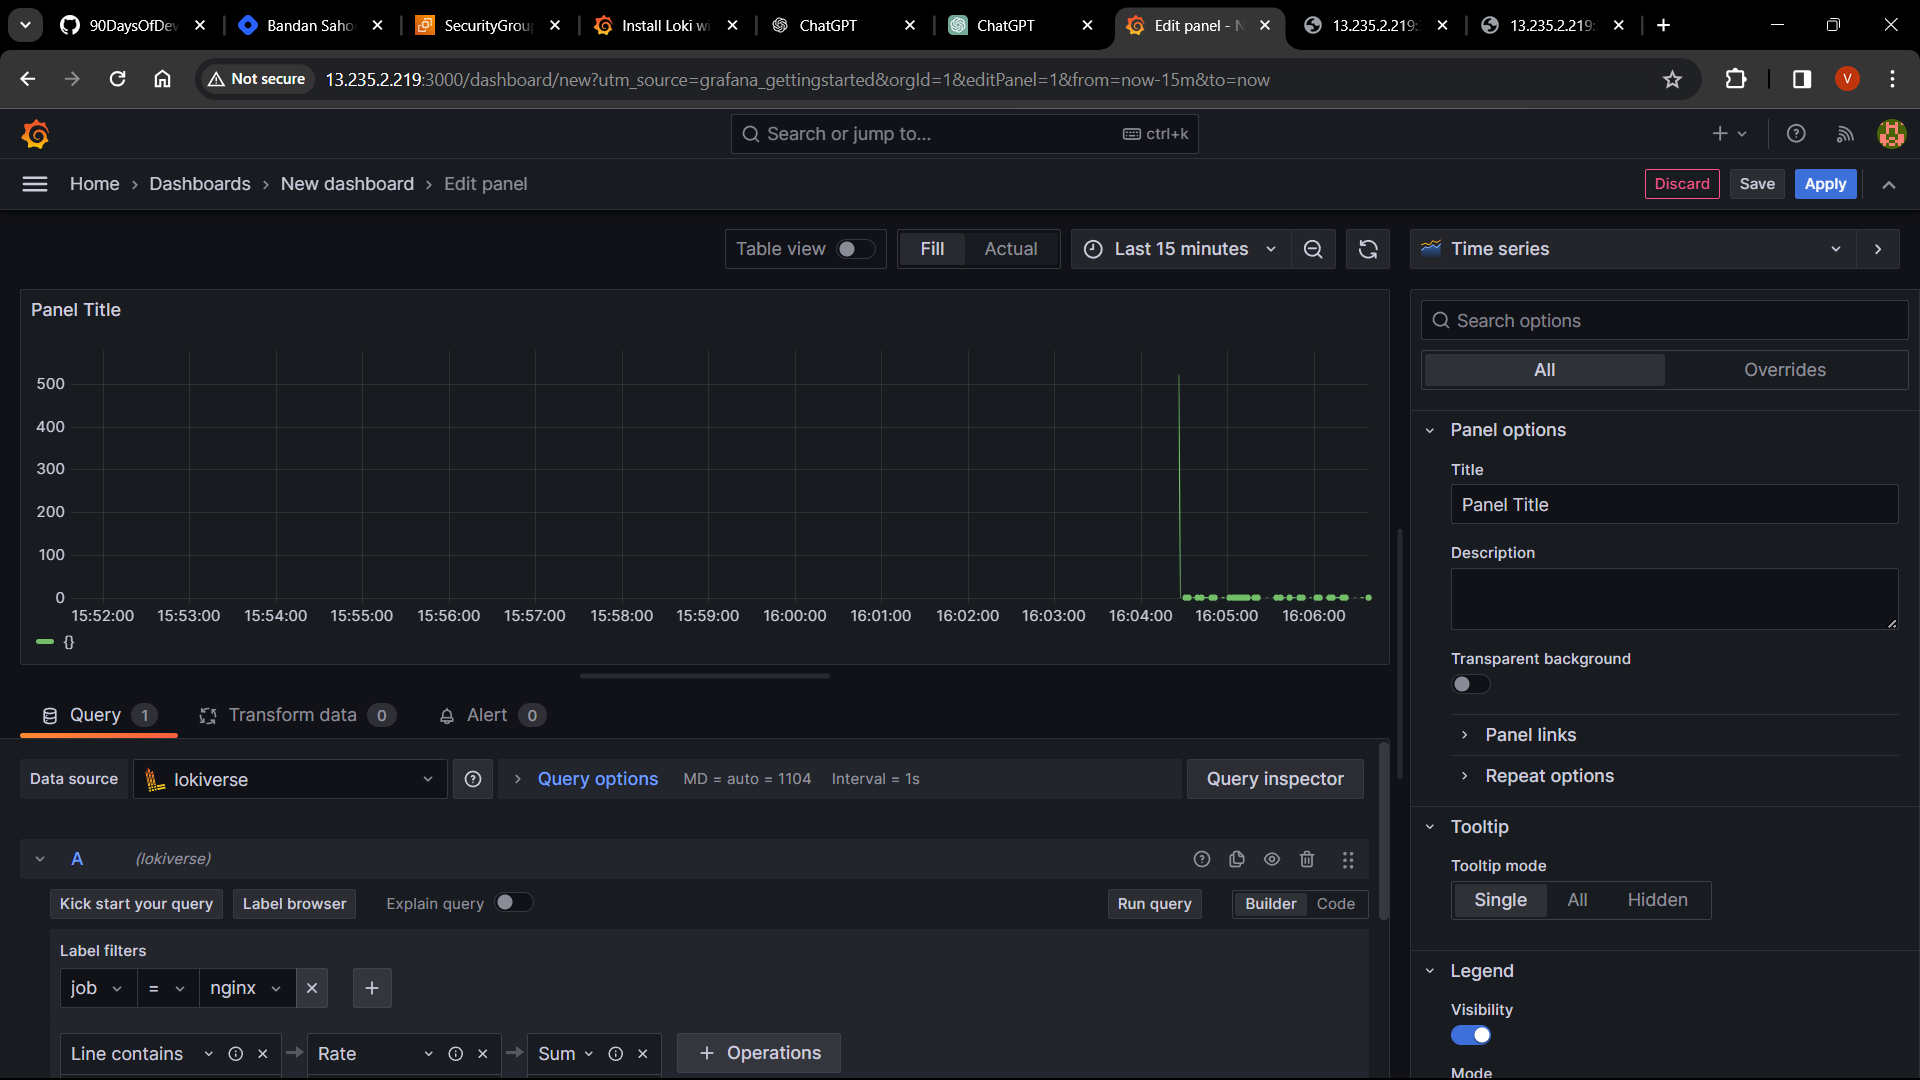
Monitor Components: Design dashboards to display relevant information and metrics about the NGINX server, such as request rates, response times, and error counts.
Conclusion
By following the steps outlined in this guide and implementing the practical example, you can set up a robust monitoring system for your Linux and Windows EC2 instances using Grafana, Loki, and Promtail. With these tools in place, you'll have real-time visibility into the performance and health of your servers, enabling you to make informed decisions and troubleshoot issues effectively.
Subscribe to my newsletter
Read articles from Vedant Thavkar directly inside your inbox. Subscribe to the newsletter, and don't miss out.
Written by

Vedant Thavkar
Vedant Thavkar
"DevOps enthusiast and aspiring engineer. Currently honing skills in streamlining development workflows and automating infrastructure. Learning AWS, Docker, Kubernetes, Python, and Ansible. Eager to contribute and grow within the DevOps community."