Easy Guide to Prometheus: Installation and Configuration
 Rakesh Kumar Jangid
Step 1 (Pre-Setup requirements)
Before You Begin:
Make sure you have the
‘sudo’access on your Linux server. You’ll need it because this guide uses commands that needAdministrativepermissions.Your server needs to be able to connect to the internet. This is necessary to download the Prometheus software. So ping
8.8.8.8to check connectivity.Don’t forget to adjust your firewall settings. You need to allow access to port
9090on your server to use Prometheus.Yum client repository should be configured properly.
Step 2 (Setup Prometheus)
Step 2.1: Update the yum package repositories.
$ sudo yum update -y
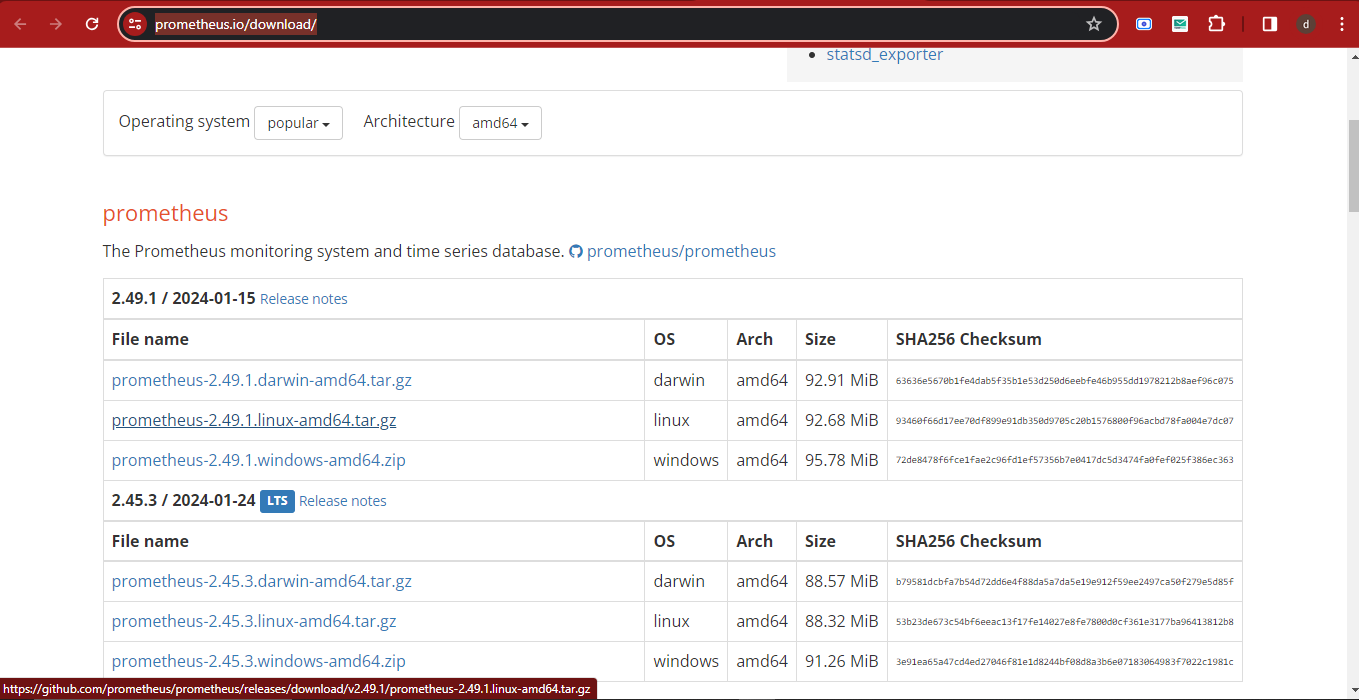
Step 2.2: Go to the official Prometheus downloads page and get the latest download link for the Linux binary.

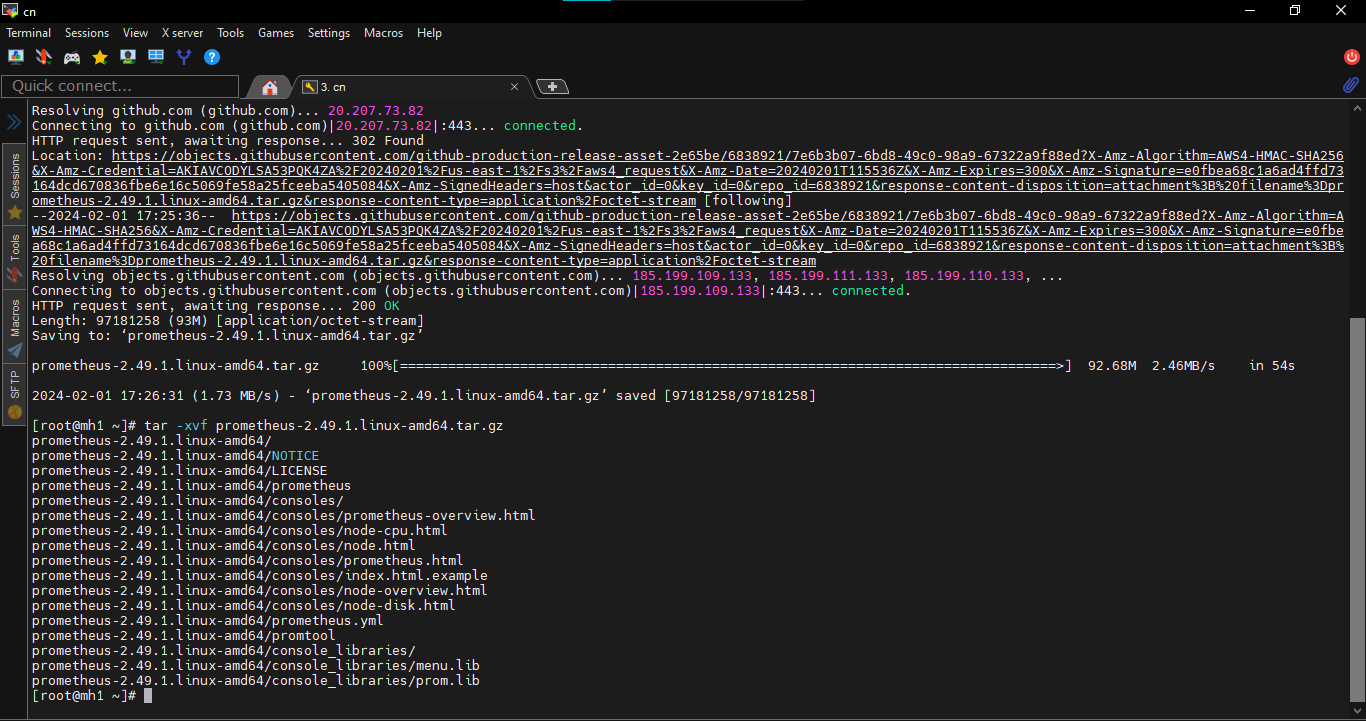
Step 2.3: Retrieve the source code using wget, decompress the tar file, and rename the resulting directory to ‘prometheus-files’. For this create a new directory ‘prometheus-files’
$ sudo  wget https://github.com/prometheus/prometheus/releases/download/v2.49.1/prometheus-2.49.1.linux-amd64.tar.gz
$ sudo tar -xvf prometheus-2.49.1.linux-amd64.tar.gz
$ sudo mkdir prometheus-files
$ sudo mv prometheus-2.49.1.linux-amd64  prometheus-files/


Step 3 (User Creation And Ownership Change)
Step 3.1: Create a Prometheus user, establish the necessary directories, and assign ownership of these directories to the Prometheus user.
$ sudo useradd prometheus --no-create-home -s /bin/false
$ sudo mkdir /etc/prometheus
$ sudo mkdir /var/lib/prometheus
$ sudo chown prometheus:prometheus /etc/prometheus
$ sudo chown prometheus:prometheus /var/lib/prometheus
Step 3.2: Take the ‘prometheus’ and ‘promtool’ files from the ‘prometheus-files’ folder. Put them in the ‘/usr/local/bin’ folder. Then, make sure they belong to the ‘prometheus’ user. so change the ownership to prometheus user
$ sudo cp prometheus-files/prometheus /usr/local/bin/
$ sudo cp prometheus-files/promtool /usr/local/bin/
$ sudo chown prometheus:prometheus /usr/local/bin/prometheus
$ sudo chown prometheus:prometheus /usr/local/bin/promtool
Step 3.3: Move the consoles and console_libraries directories from prometheus-files to /etc/prometheus folder and change the ownership to prometheus user.
$ sudo cp -r prometheus-files/consoles /etc/prometheus
$ sudo cp -r prometheus-files/console_libraries /etc/prometheus
$ sudo chown -R prometheus:prometheus /etc/prometheus/consoles
$ sudo chown -R prometheus:prometheus /etc/prometheus/console_libraries
Step 4 (Prometheus Configuration Process)
All the prometheus configurations should be present in /etc/prometheus/ prometheus.yml file.
Step 4.1: Create the prometheus.yml file & Copy the following contents to the prometheus.yml file.
$ sudo vi /etc/prometheus/prometheus.yml
global:
  scrape_interval: 10s

scrape_configs:
  - job_name: 'prometheus'
    scrape_interval: 5s
    static_configs:
      - targets: ['localhost:9090']
9090 port in firewall.$ sudo firewall-cmd --permanent-port=9090/tcp
$ sudo firewall-cmd --reload
$ sudo firewall-cmd --list-all
Step 4.2: Change the ownership of the file to prometheus user.
$ sudo chown prometheus:prometheus /etc/prometheus/prometheus.yml
Step 4.3: Create a prometheus service file & Copy the following content to the file, for Setup Prometheus Service File.
$ sudo vi /etc/systemd/system/prometheus.service
[Unit]
Description=Prometheus
Wants=network-online.target
After=network-online.target

[Service]
User=prometheus
Group=prometheus
Type=simple
ExecStart=/usr/local/bin/prometheus \
    --config.file /etc/prometheus/prometheus.yml \
    --storage.tsdb.path /var/lib/prometheus/ \
    --web.console.templates=/etc/prometheus/consoles \
    --web.console.libraries=/etc/prometheus/console_libraries

[Install]
WantedBy=multi-user.target
Step 4.4: Reload the systemd service to register the prometheus service and start the prometheus service.
$ sudo systemctl daemon-reload
$ sudo systemctl start prometheus
Check the prometheus service status using the following command.
$ sudo systemctl status prometheus
The status should show the active state as shown below.

Step 5 (Access Prometheus Web UI)
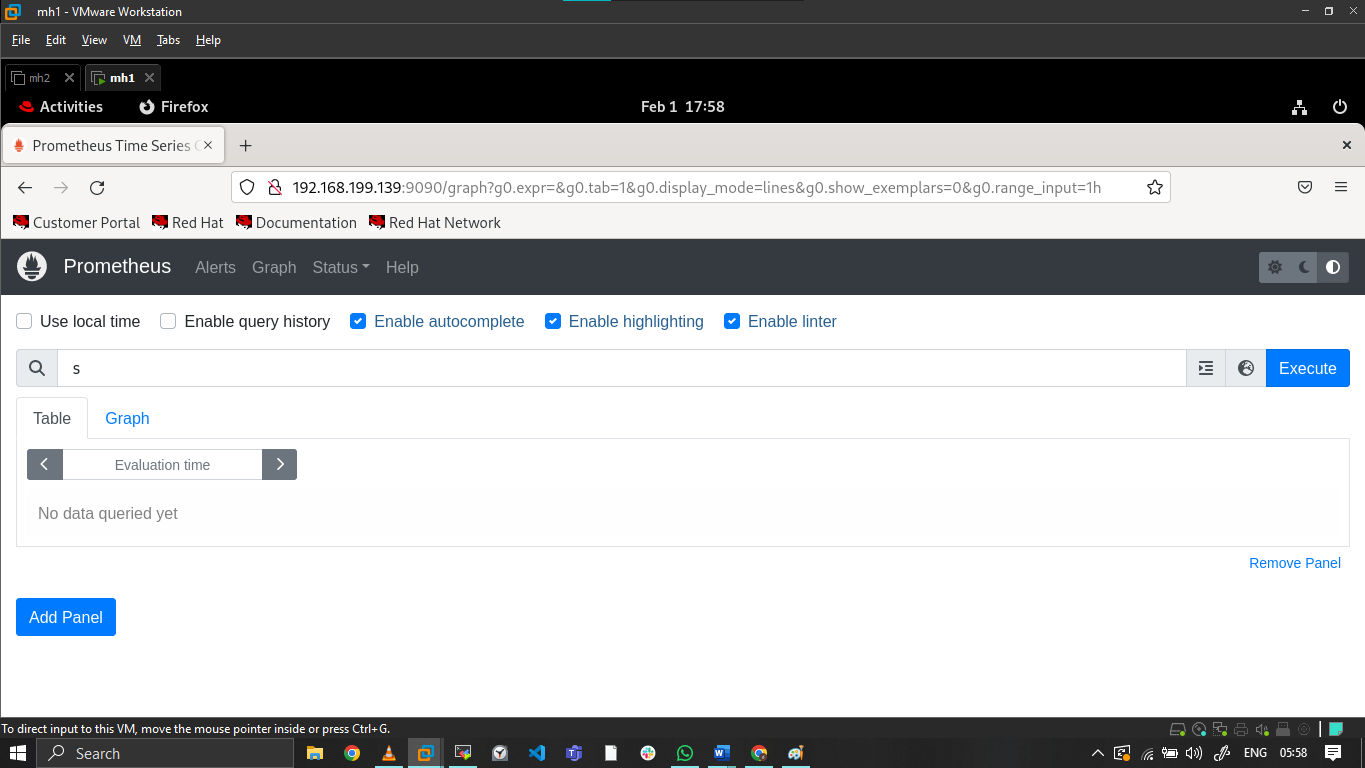
Now you will be able to access the prometheus UI on 9090 port of the prometheus server.
http://<Instance-IP>:9090/graph
You can see the following UI as shown below. Lots of Congratulations !!!!

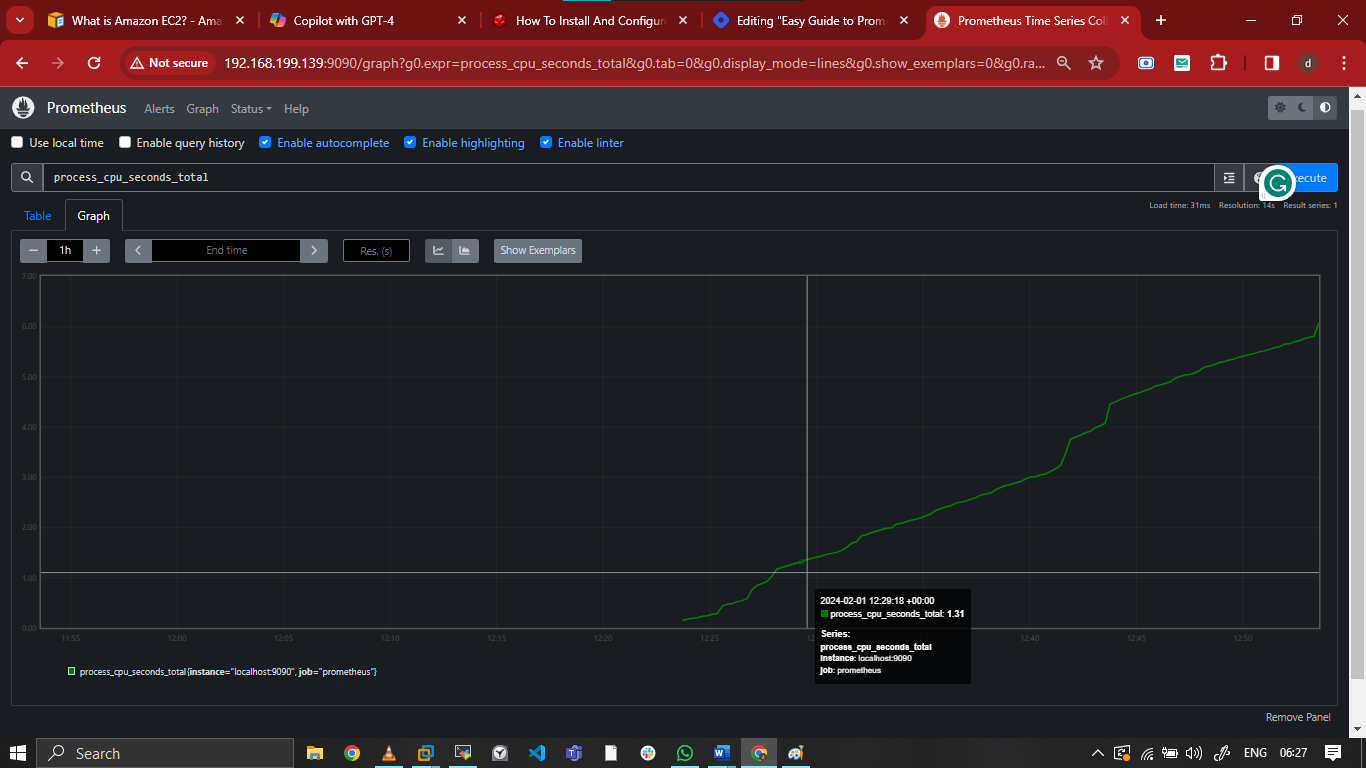
Now search "process_cpu_seconds_total" in search bar, choose option Graph and press Execute .

This is graphical representation for "process_cpu_seconds_total" of your instance.

Step 6 (What Next.....?)
Step 6.1: Well At this point, we’ve set up the Prometheus server. But to start collecting data, we need to specify where to get it from. This is done by registering a ‘target’ in the prometheus.yml file.
A ‘target’ is essentially a source system from which Prometheus can collect metrics. If you have multiple systems (like ten servers) that you want to monitor, you would list the IP addresses of these servers as targets in the Prometheus configuration.
However, before Prometheus can collect any data, each server needs to have a program called ‘Node Exporter’ installed. This program collects system metrics and makes them available for Prometheus to scrape.
In simpler terms, think of it like this: Prometheus is a data collector, the ‘targets’ are the places it collects data from, and ‘Node Exporter’ is the tool that gathers the data and puts it in a place where Prometheus can find it.
Step 6.2: How to do practically ?
Here are the practical steps to get data from 10 servers using Prometheus and Node Exporter:
- Install Node Exporter on Each Server: Node Exporter is a program that collects system metrics and makes them available for Prometheus to scrape. You need to install Node Exporter on each of the 10 servers that you want to monitor.
Node Exporter is like a reporter for your server. It collects information about your server’s performance, such as how much memory it’s using, how much data it’s reading and writing to the disk, and how much work the CPU is doing. It then makes this information available in a format that Prometheus, a monitoring tool, can understand. This allows you to keep track of your server’s health and performance over time.
- Configure Prometheus to Monitor These Servers: After installing Node Exporter, you need to tell Prometheus to scrape metrics from these servers. This is done by adding the IP addresses of these servers as targets in the
prometheus.ymlconfiguration file.
Here’s an example of what the configuration might look like:
$ sudo vim /etc/prometheus/prometheus.yml
scrape_configs:
  - job_name: 'node'
    static_configs:
      - targets: ['<server-1-ip>:9100', '<server-2-ip>:9100', ..., '<server-10-ip>:9100']
Replace <server-1-ip>, <server-2-ip>, …, <server-10-ip> with the actual IP addresses of your servers.
- Start Prometheus: Finally, start the Prometheus server. It will now begin collecting metrics from the specified targets at regular intervals.
References:
Subscribe to my newsletter
Read articles from Rakesh Kumar Jangid directly inside your inbox. Subscribe to the newsletter, and don't miss out.
Written by

Rakesh Kumar Jangid
Rakesh Kumar Jangid
Let's learn together and serve the society, Make India Proud.