Day 75: Building a Docker Monitoring Dashboard with Grafana, Telegraf, and InfluxDB
 Vedant Thavkar
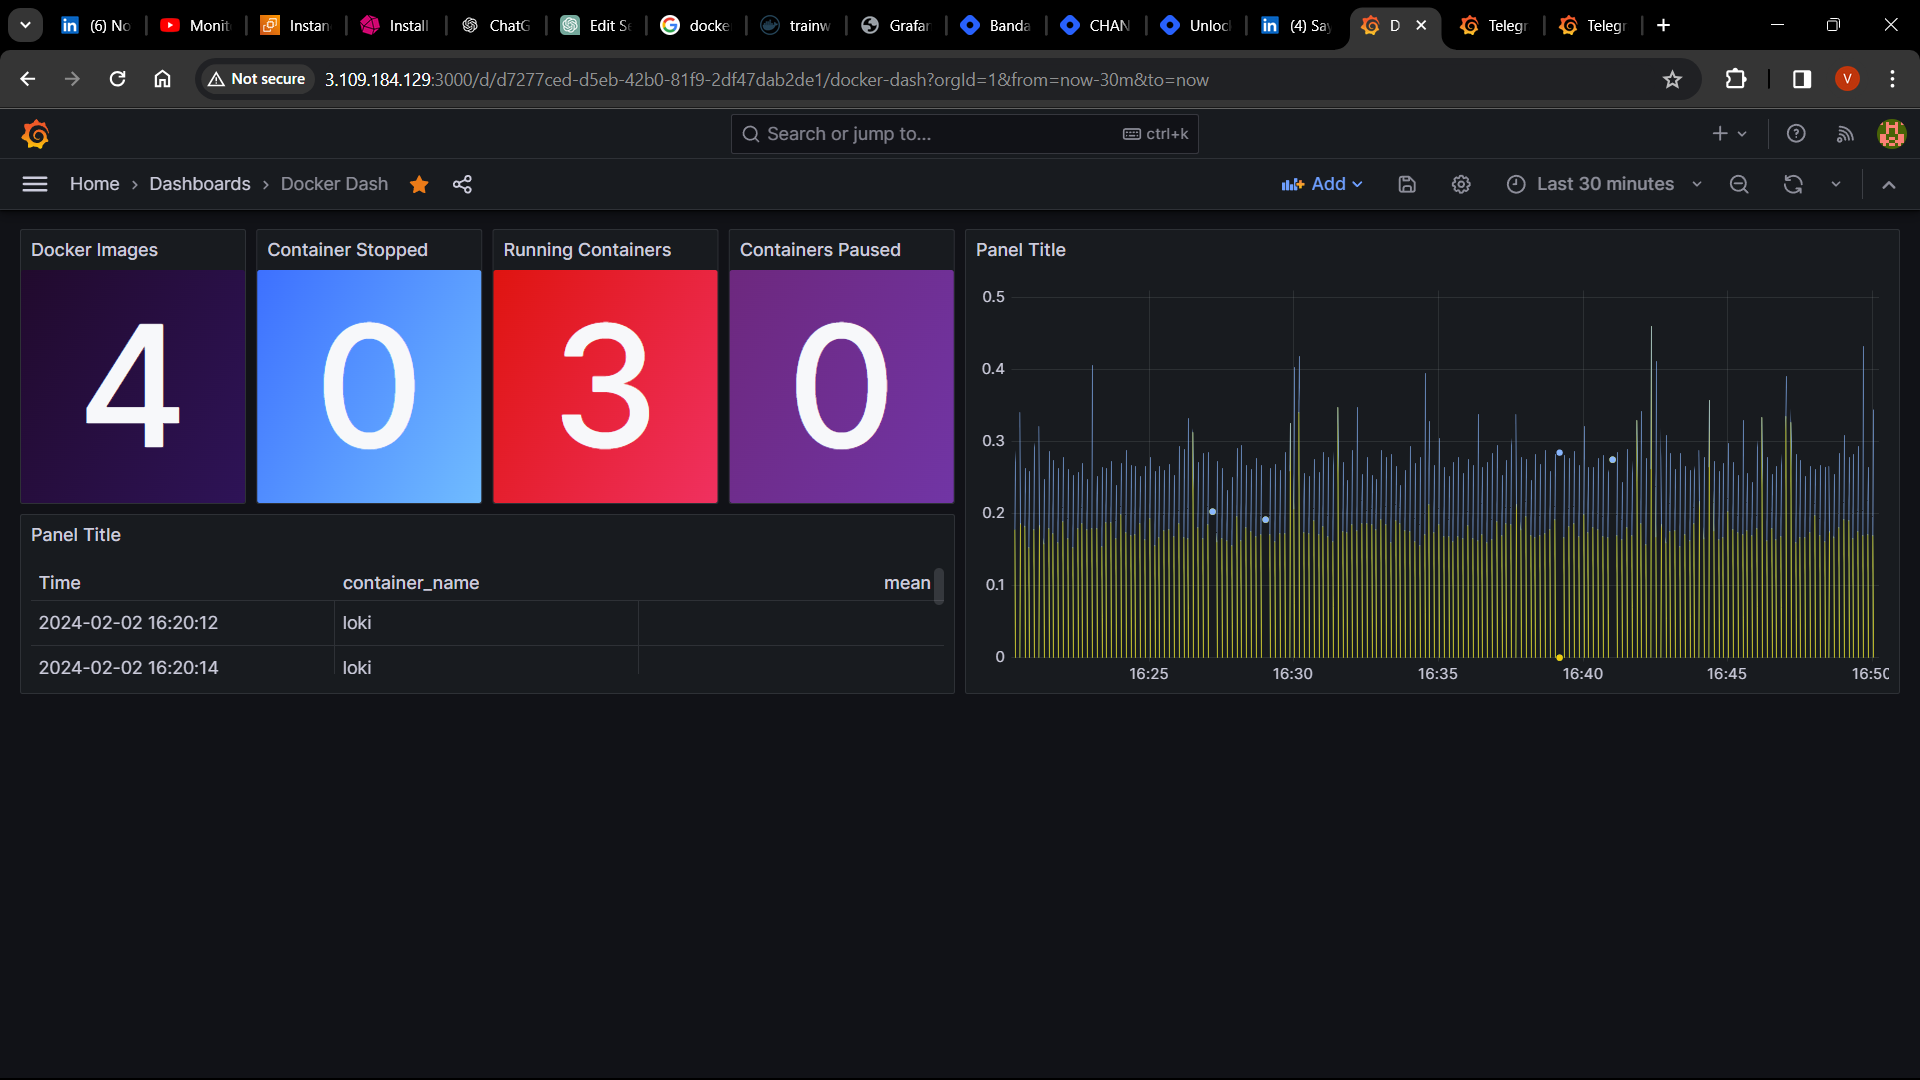
Introduction: Monitoring containerized environments is essential for ensuring the reliability, performance, and scalability of modern applications. In this tutorial, we will guide you through the process of setting up a comprehensive Docker monitoring dashboard using Grafana, Telegraf, and InfluxDB. By leveraging these powerful tools, you can gain valuable insights into your Docker containers' health, resource utilization, and overall performance.
Prerequisites:
Before getting started, ensure you have the following prerequisites in place:
Grafana Installation and Configuration: Follow our guide to install and configure Grafana on your EC2 instance. You can refer to our detailed instructions here.
Docker Installation: Install Docker on your EC2 instance and create Docker images for your applications.
Setting up Monitoring Components:
1. Configuring Telegraf:
Telegraf is a data collection agent that gathers metrics and logs from various sources. Follow these steps to configure Telegraf for Docker monitoring:
Install Telegraf on your EC2 instance using the package manager.
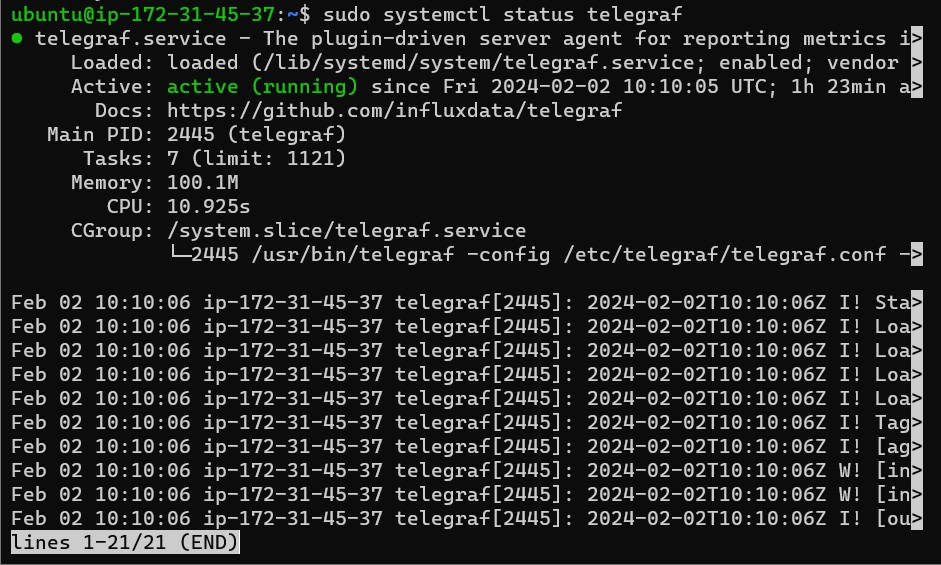
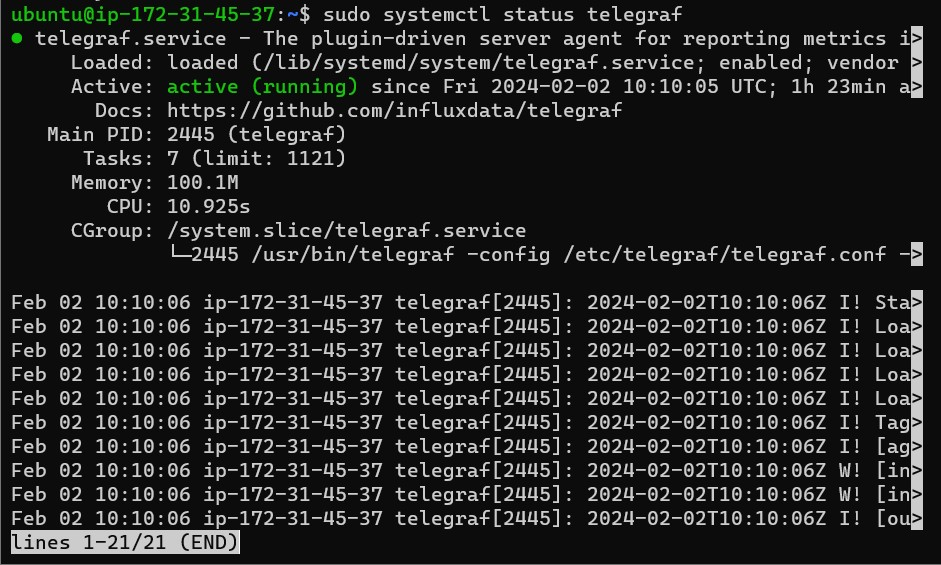
Verify the Telegraf service status to ensure it's running.
Update the Telegraf configuration file (
/etc/telegraf/telegraf.conf) to collect Docker logs.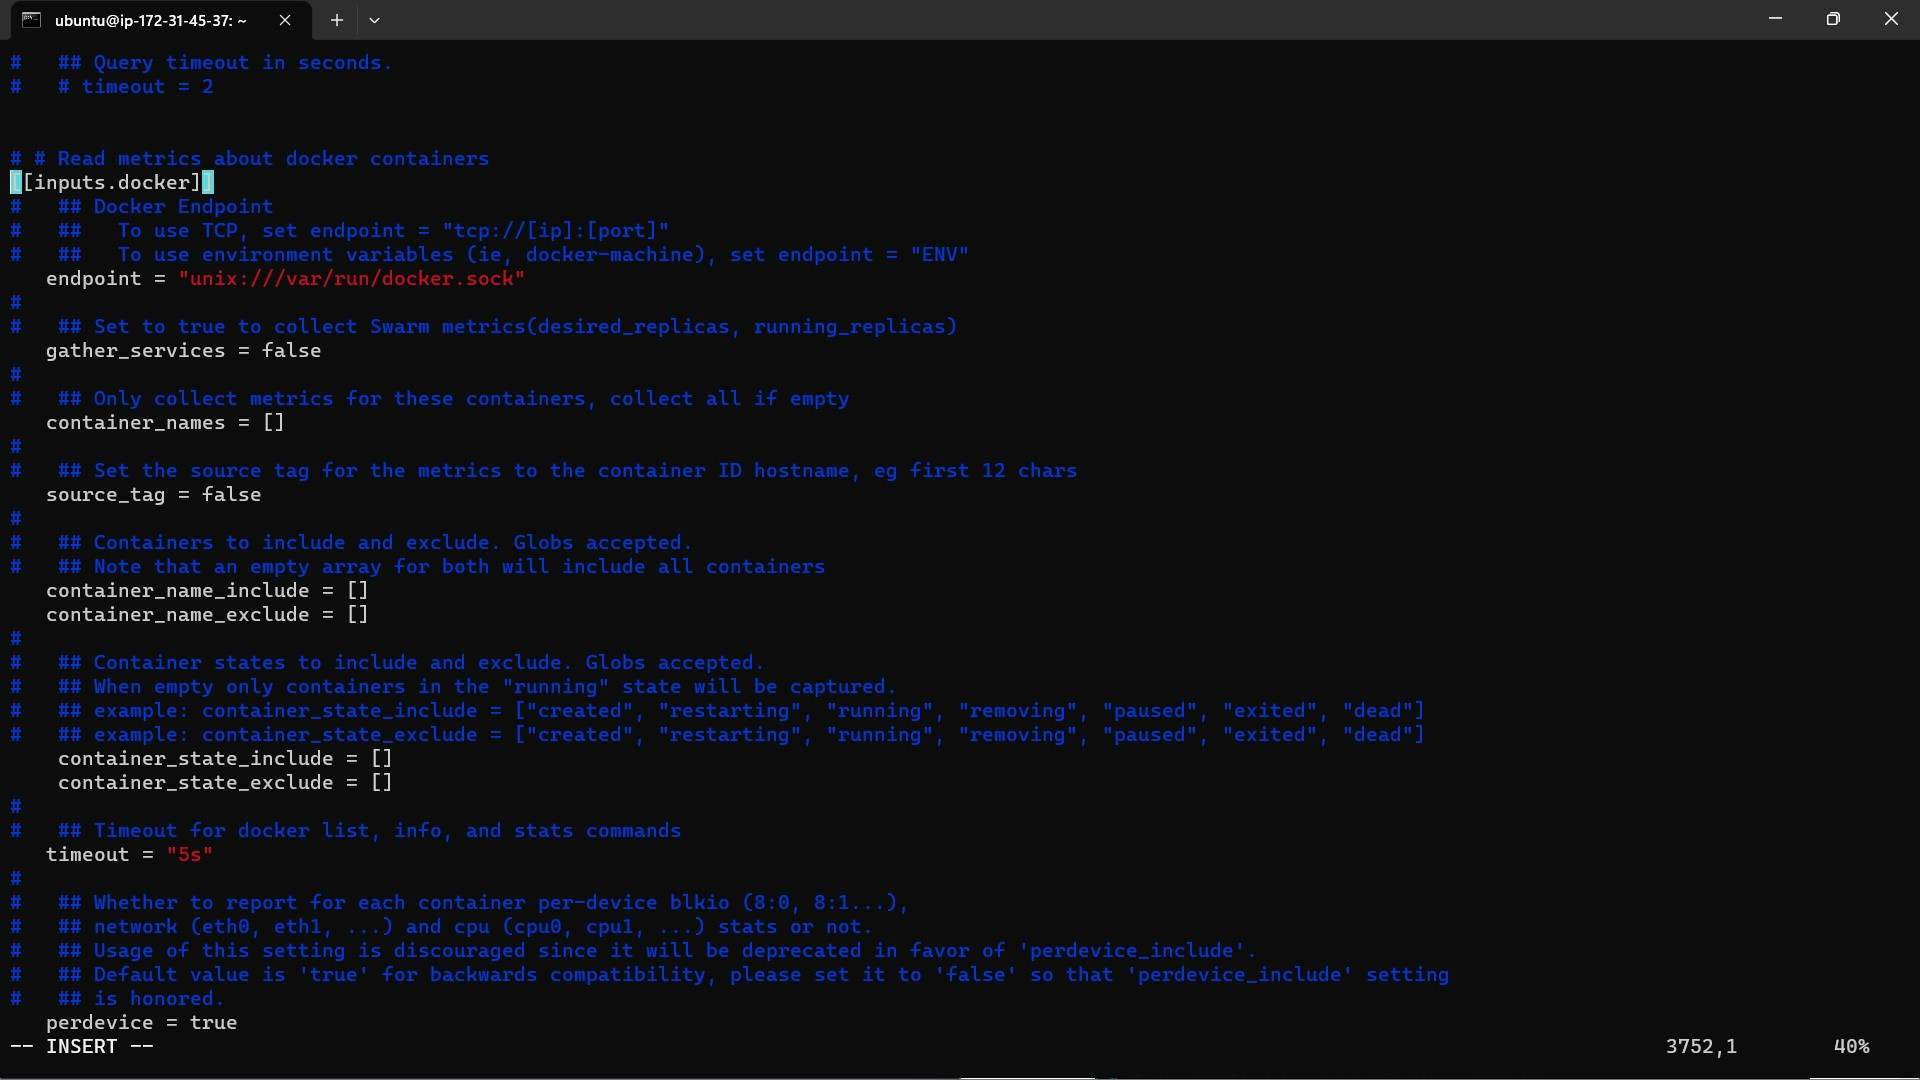
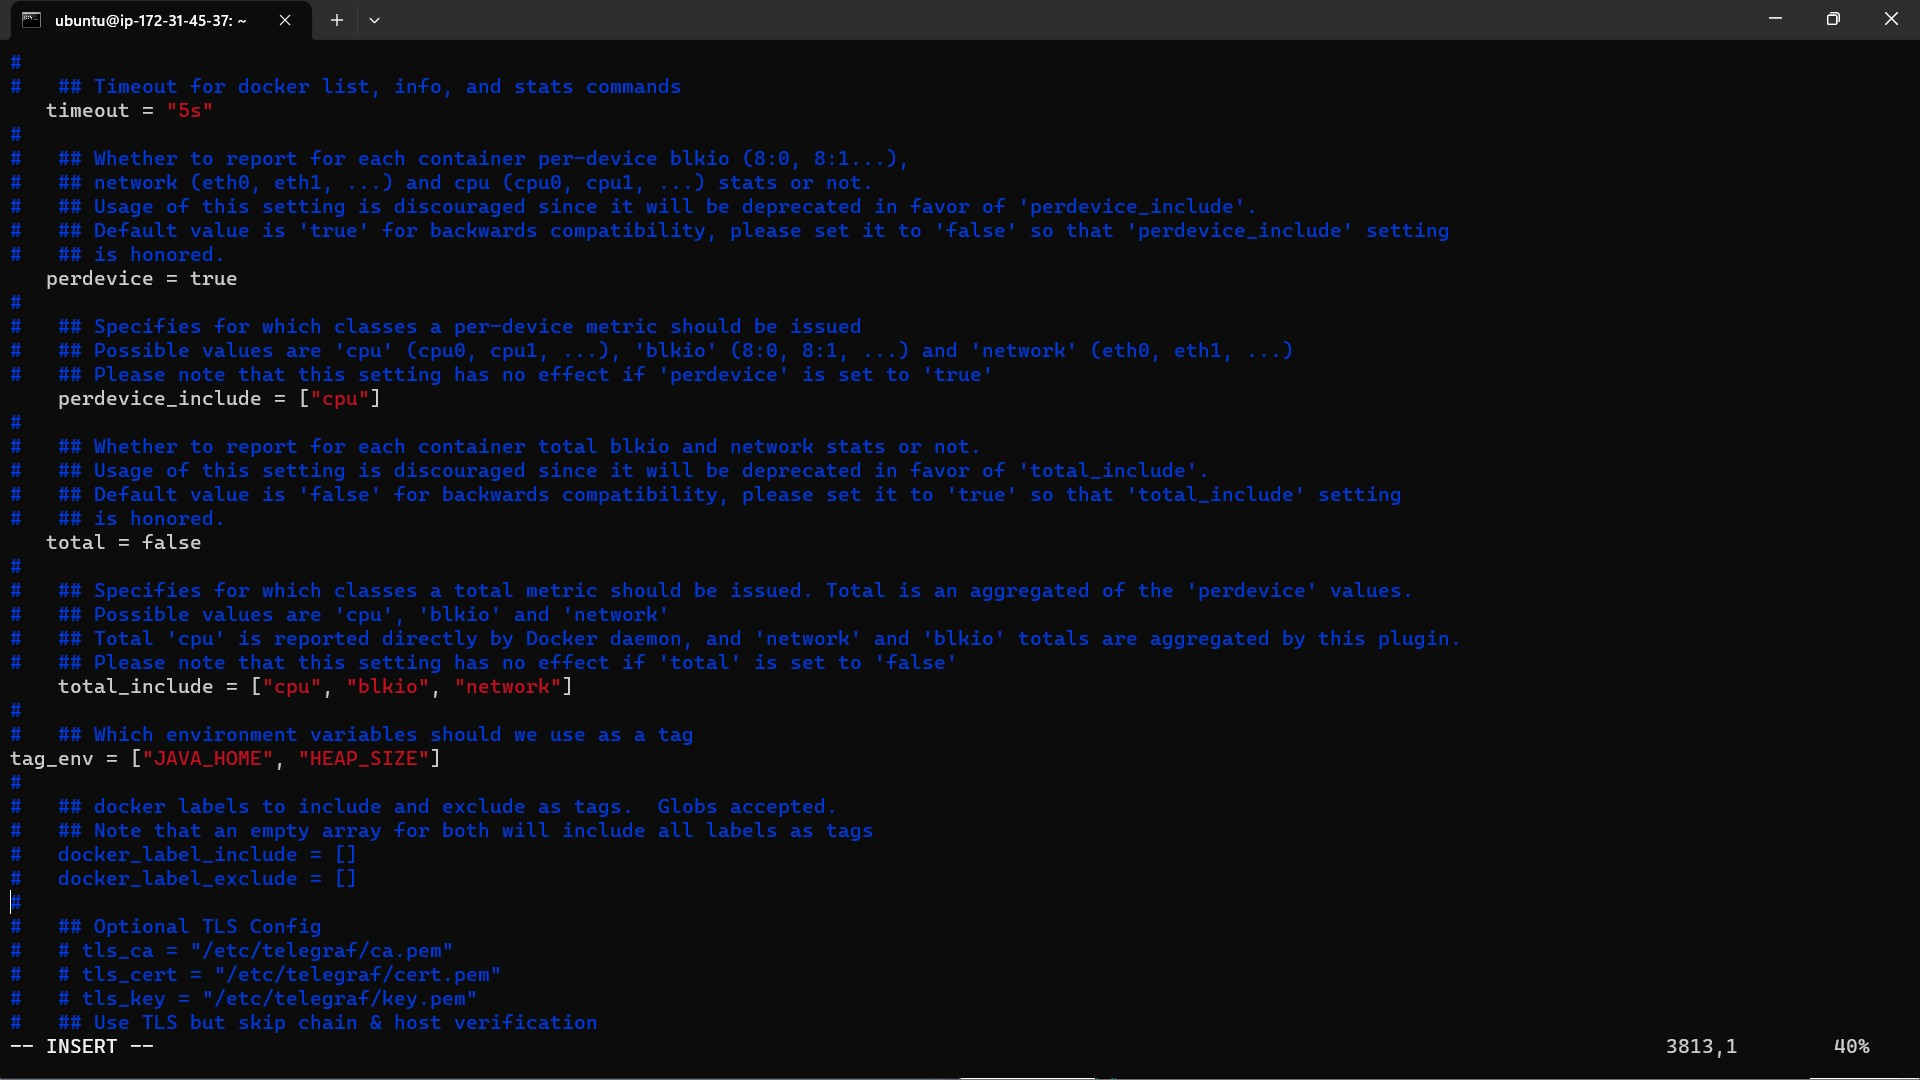
Restart the Telegraf service to apply the configuration changes.
2. Configuring InfluxDB:
InfluxDB serves as the backend storage for Telegraf, allowing you to store and analyze time-series data efficiently. Here's how to configure InfluxDB:
Install InfluxDB on your EC2 instance using the package manager.

Access the InfluxDB shell and create a new database named "telegraf".

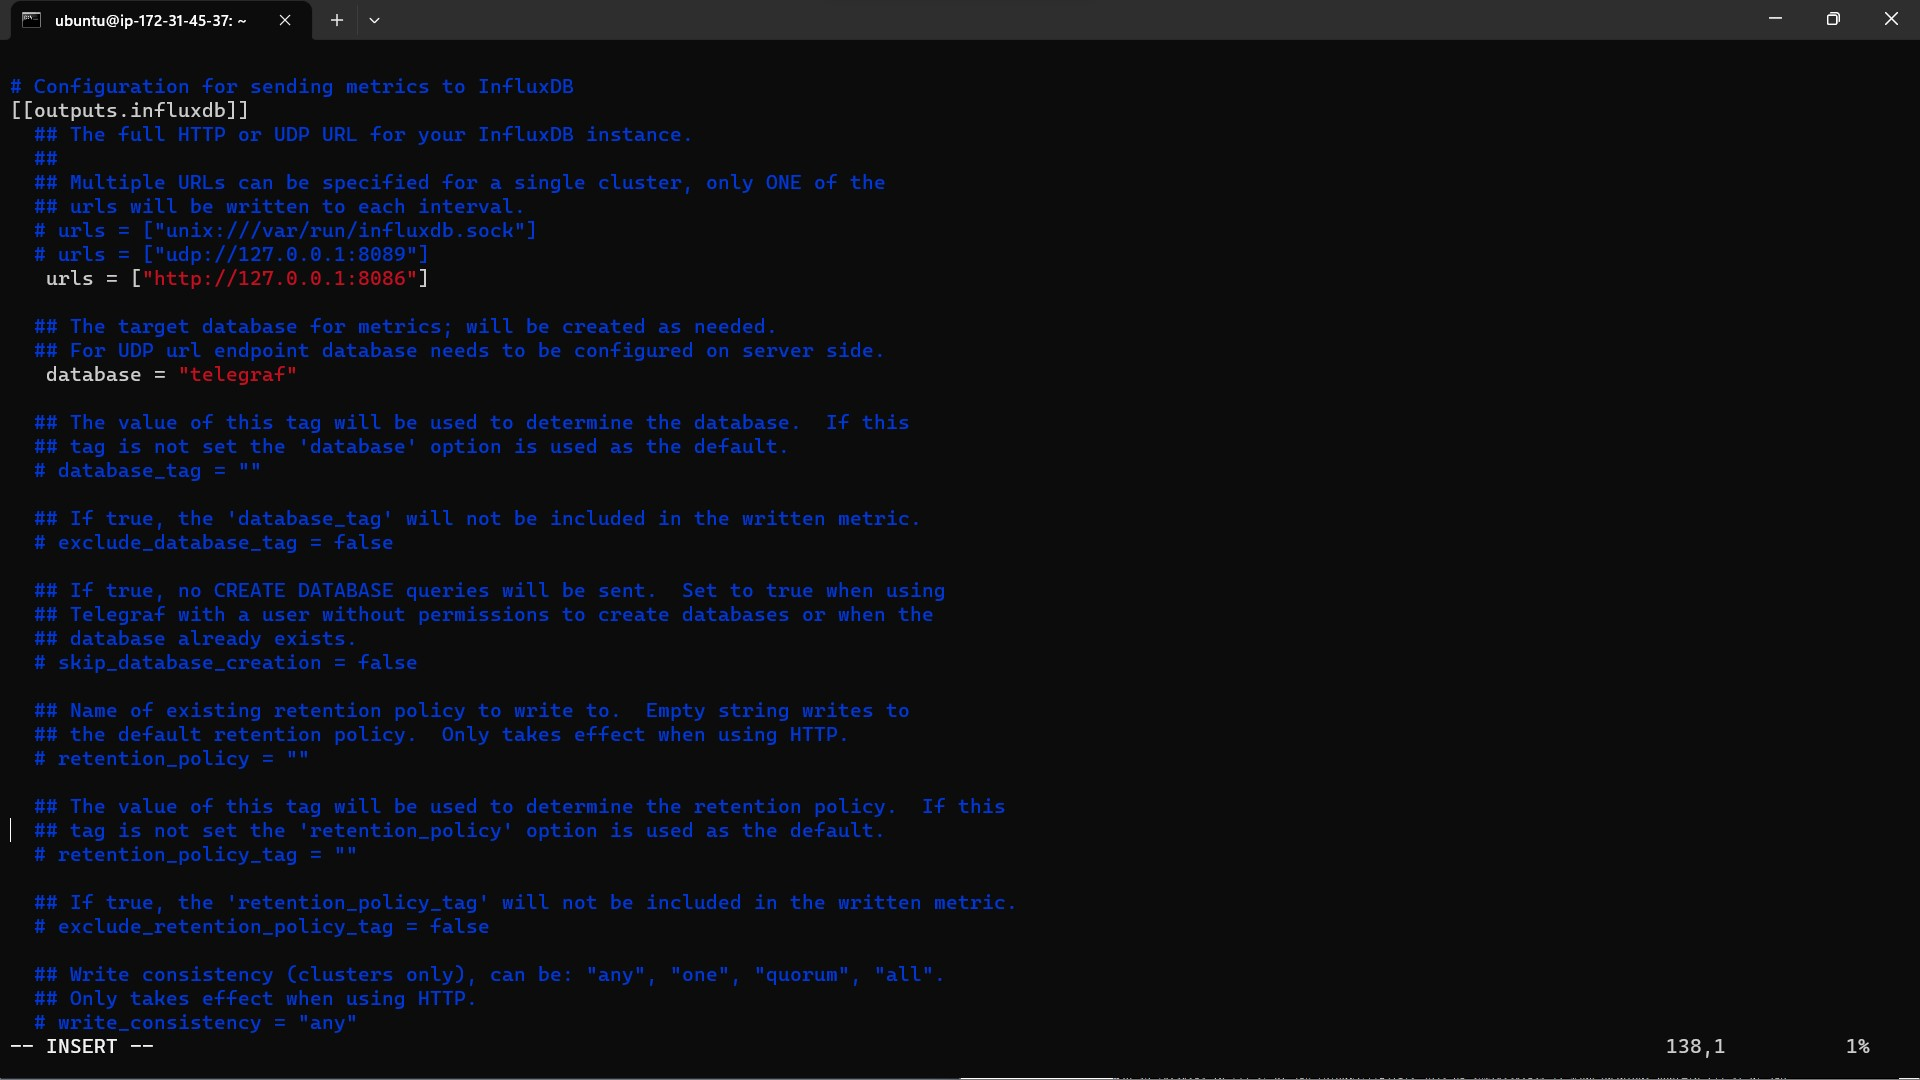
Configure Telegraf to connect to InfluxDB by specifying the database in the Telegraf configuration file.
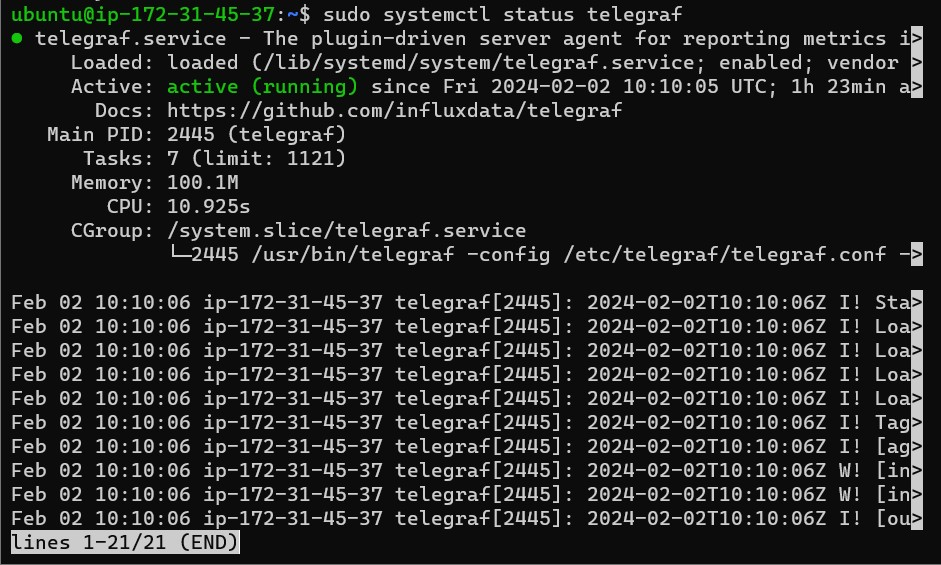
Restart the Telegraf service to ensure the changes are applied.
Creating the Monitoring Dashboard:
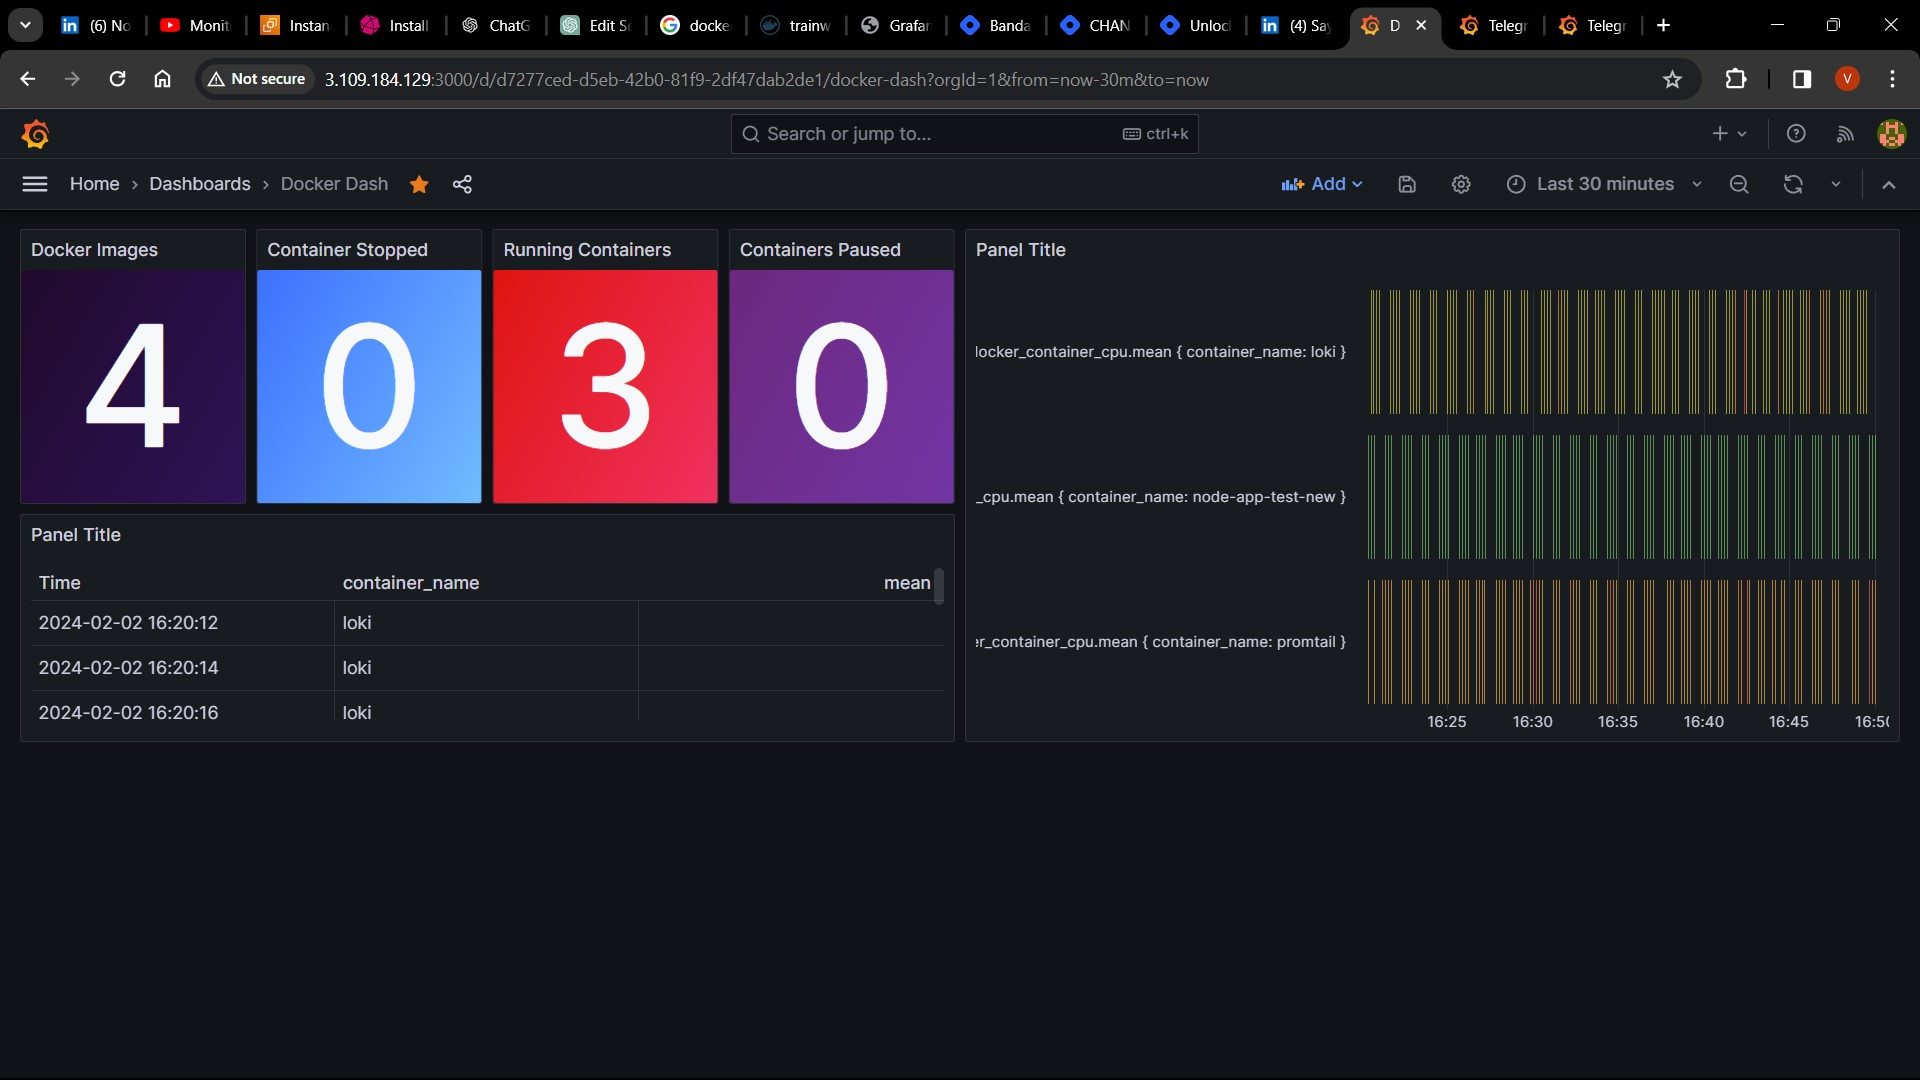
Now, let's create a comprehensive dashboard in Grafana to visualize key Docker metrics:
Total Containers:
Display the total number of containers on the server.
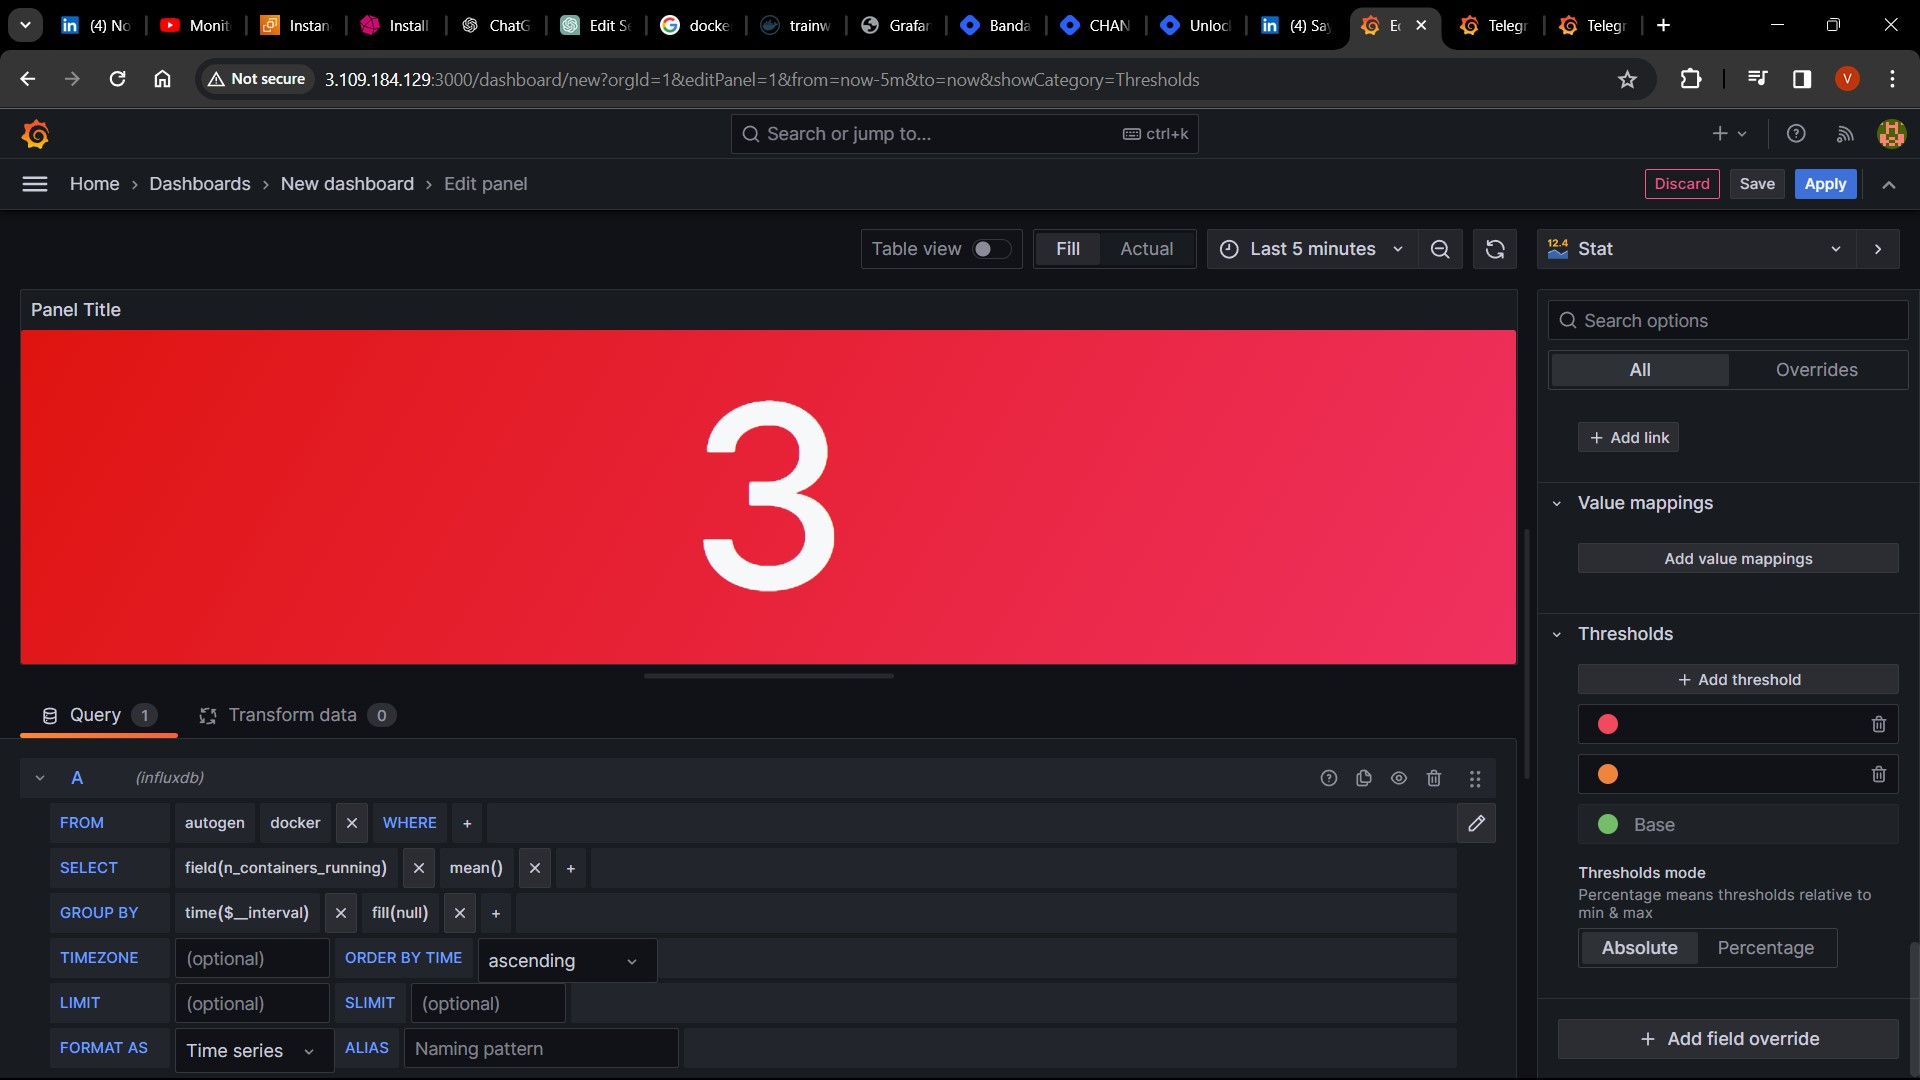
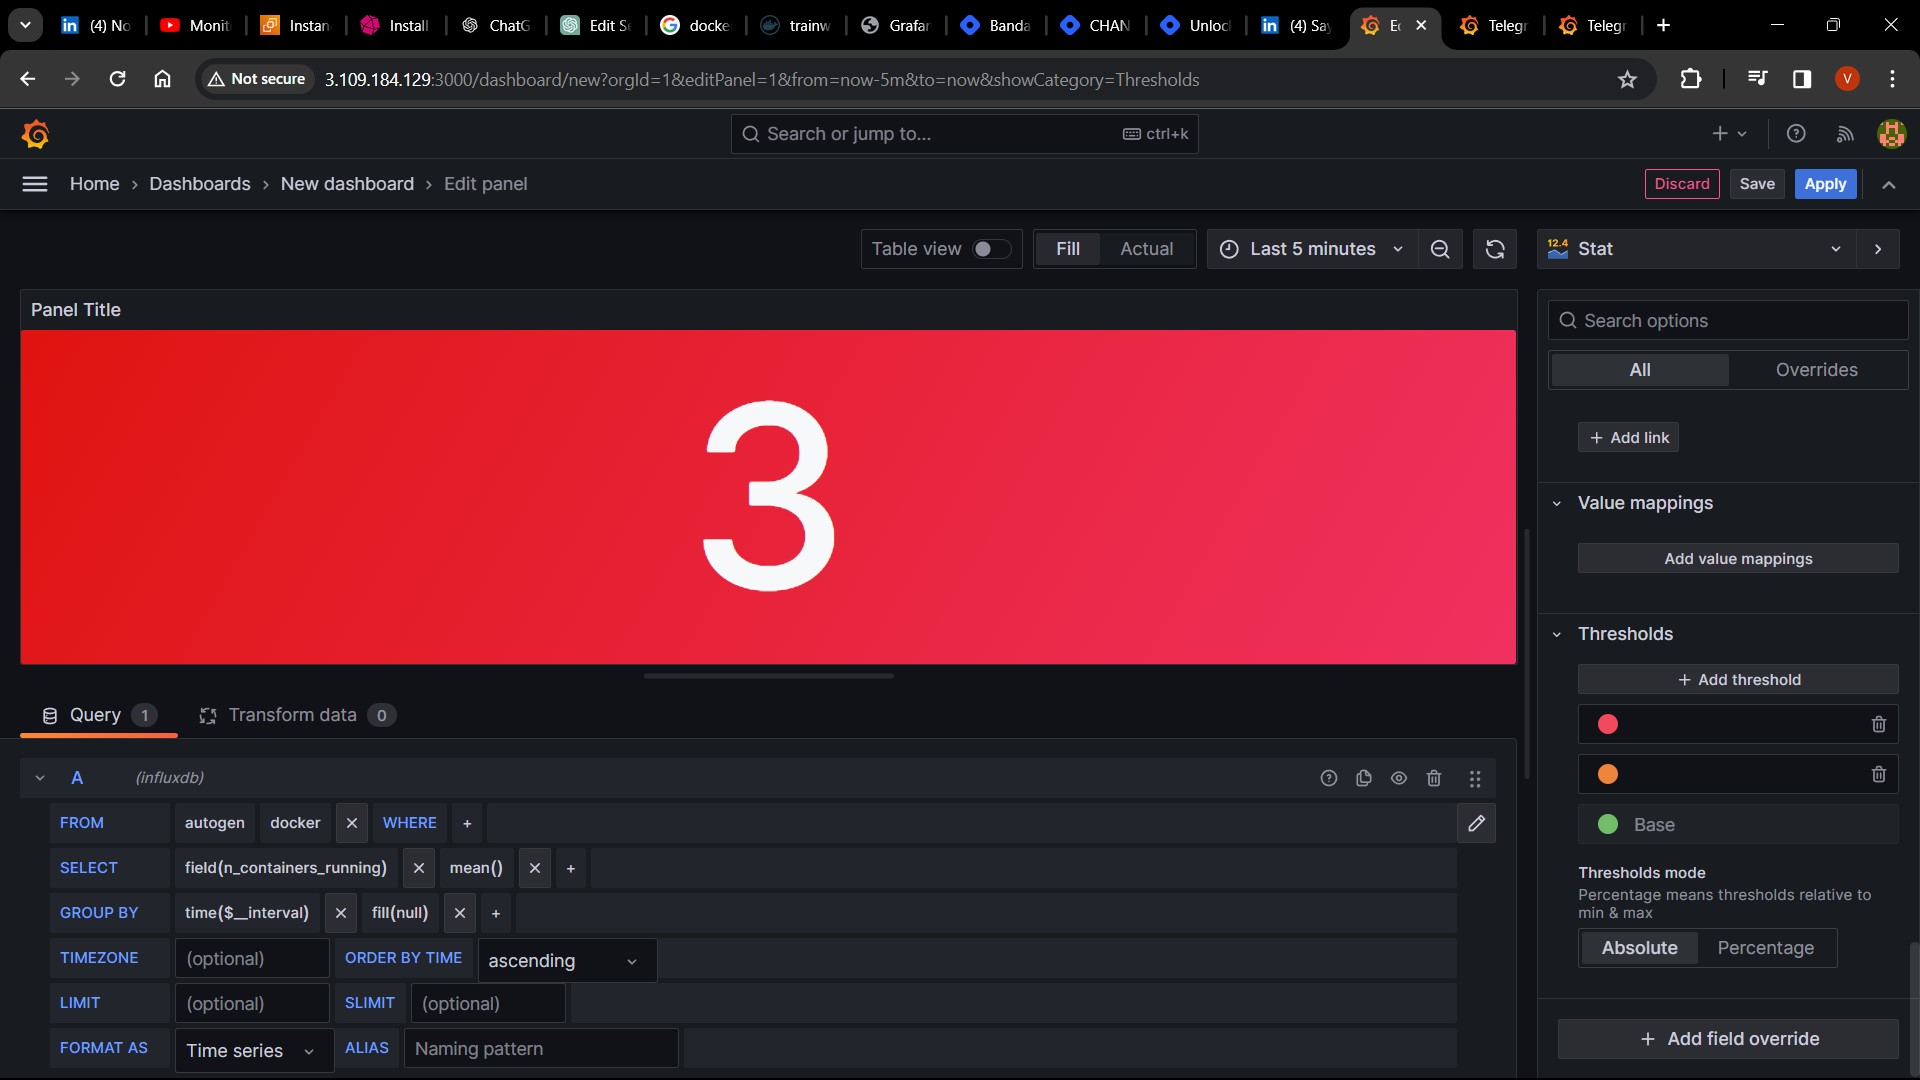
Running Containers:
Show the number of containers currently running.
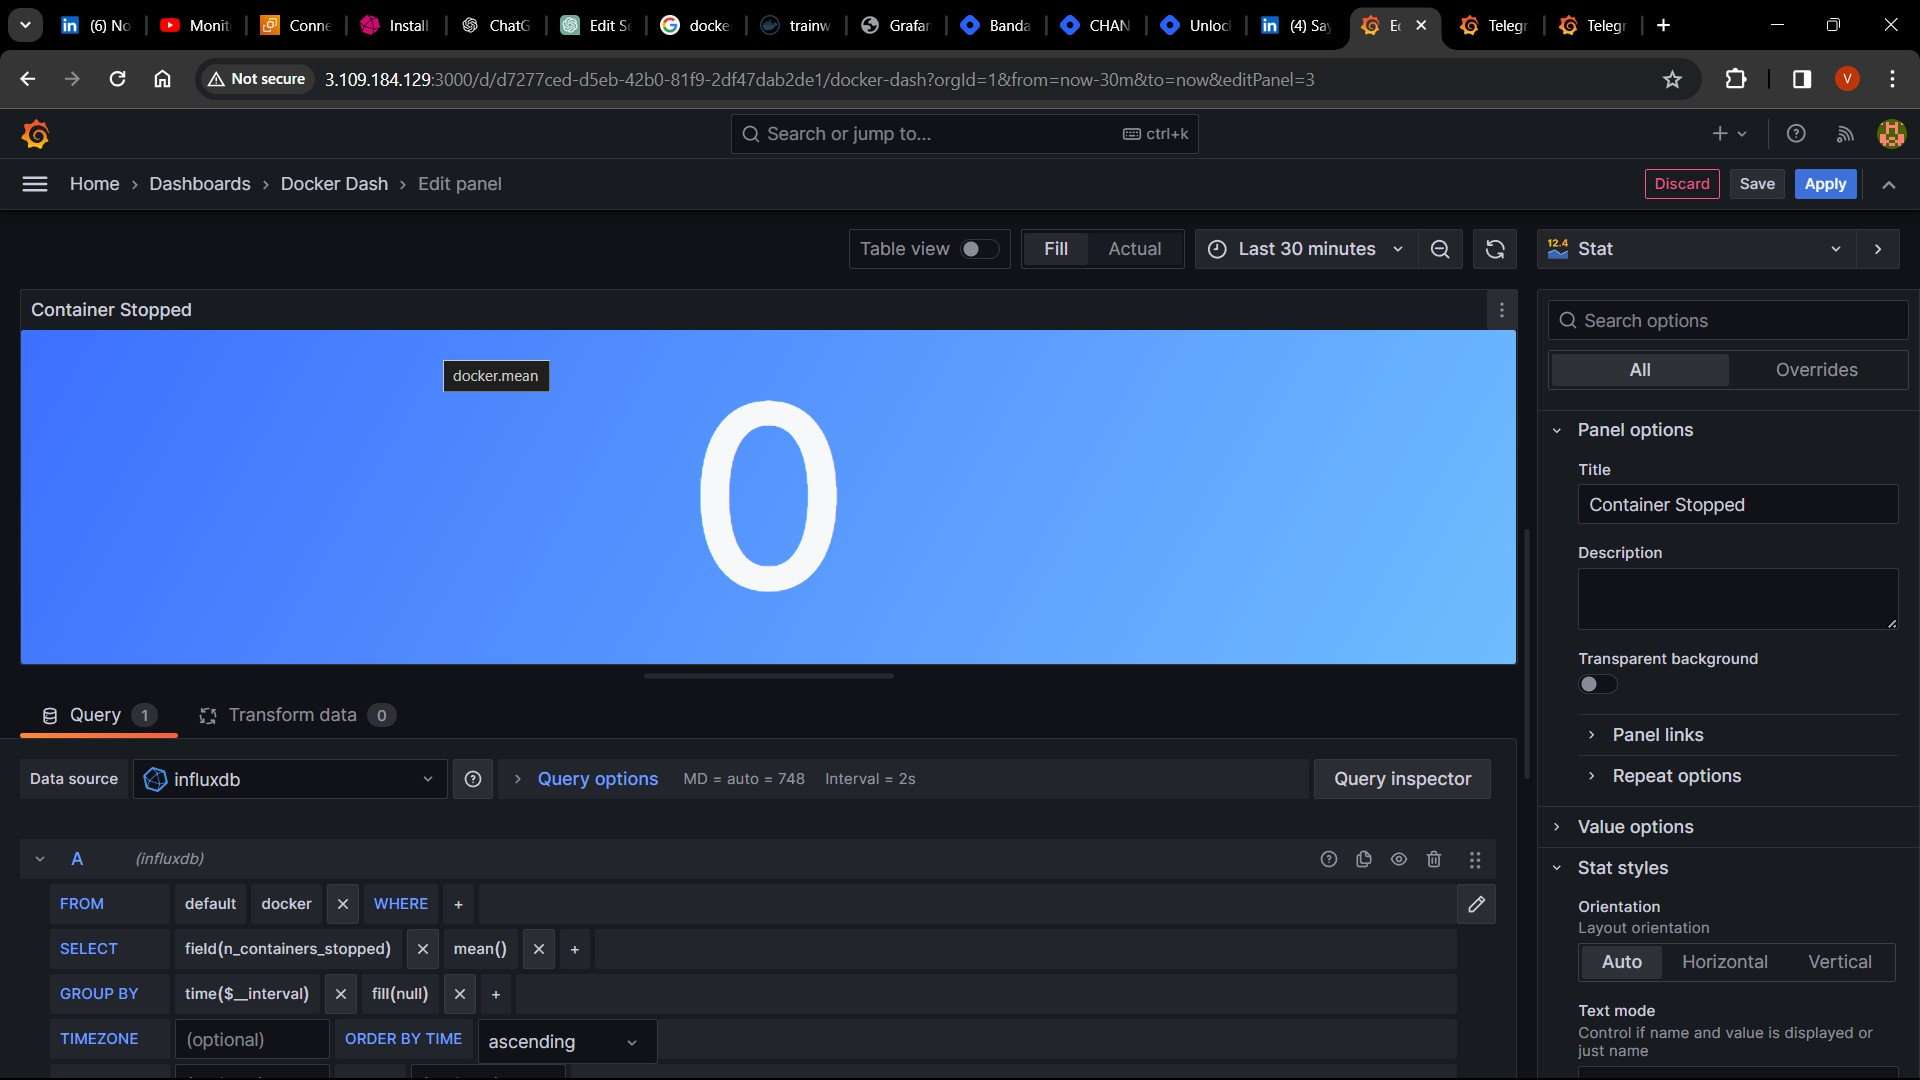
Stopped Containers:
Visualize the count of stopped containers.
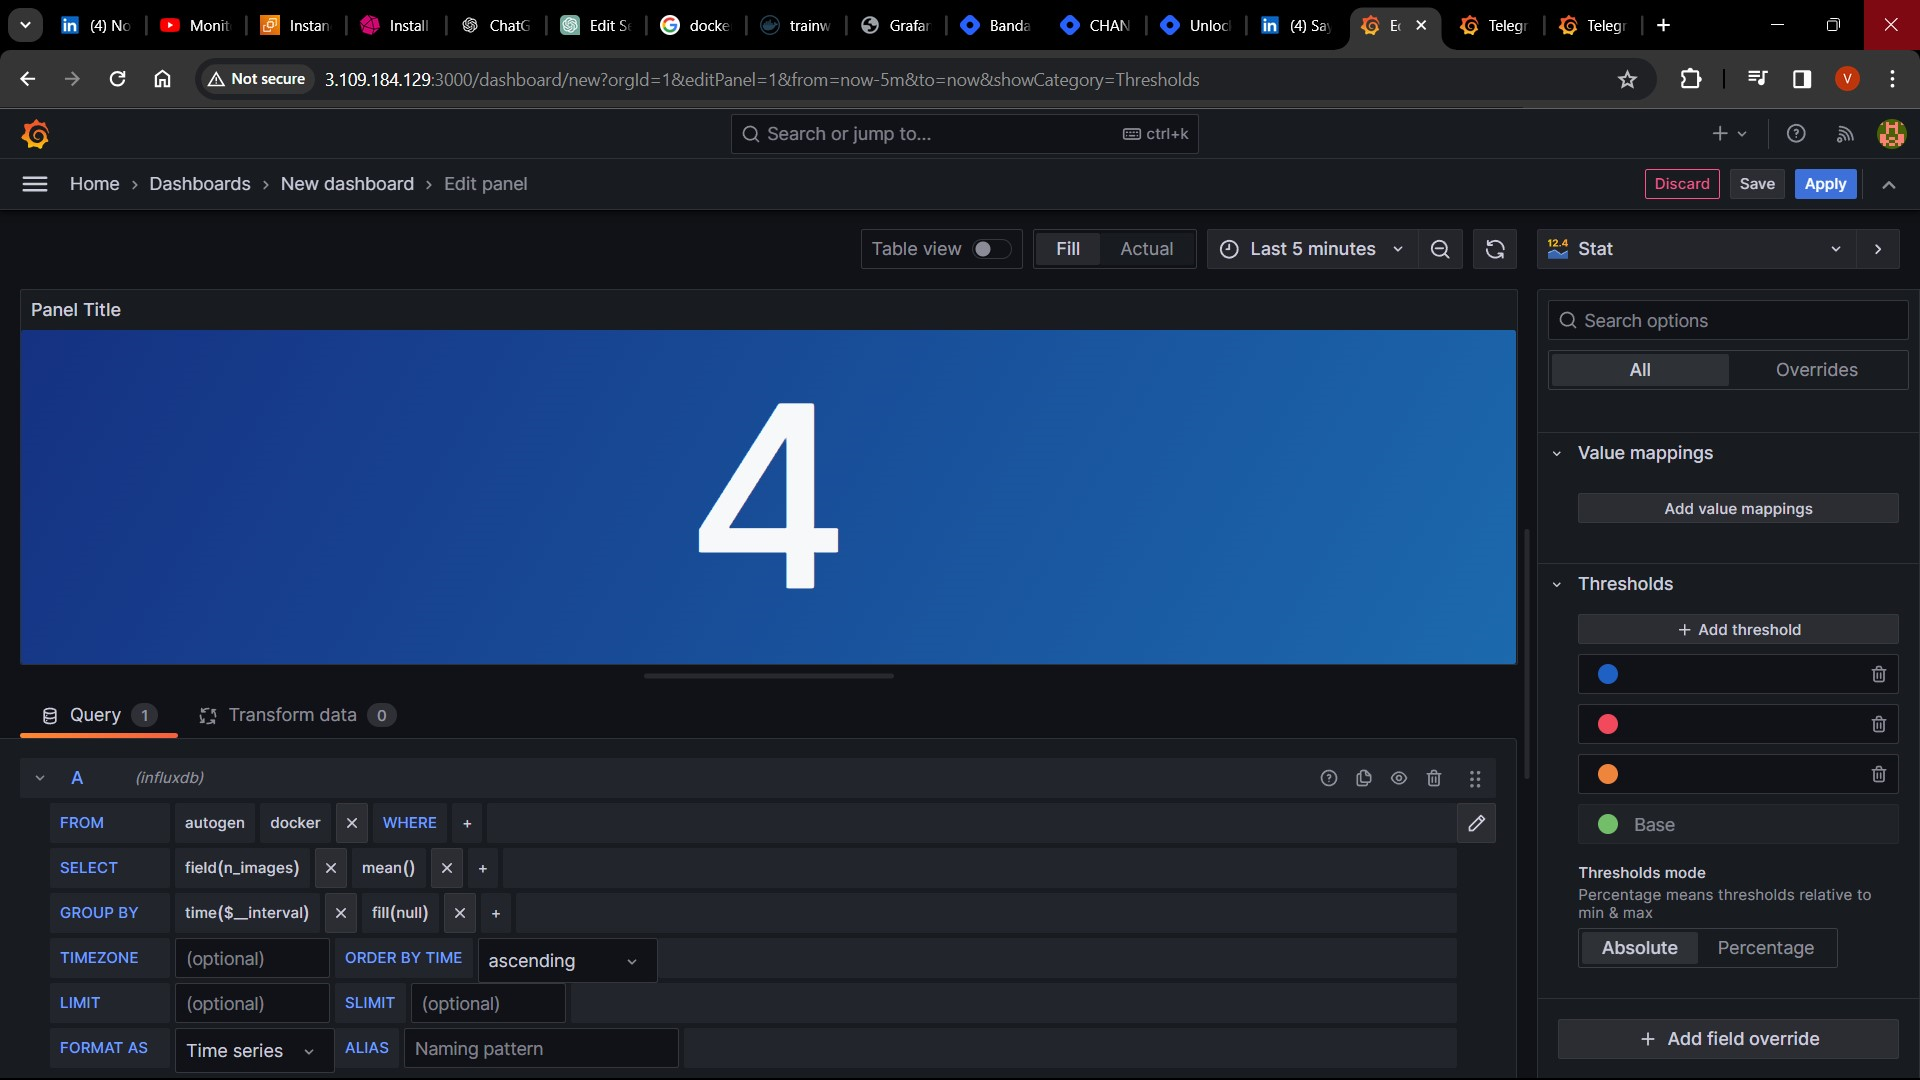
Images:
Present the total number of Docker images on the server.
Containers Memory:
Graph container memory usage percentage.
Containers Uptime:
Display uptime for each container in a tabular format.
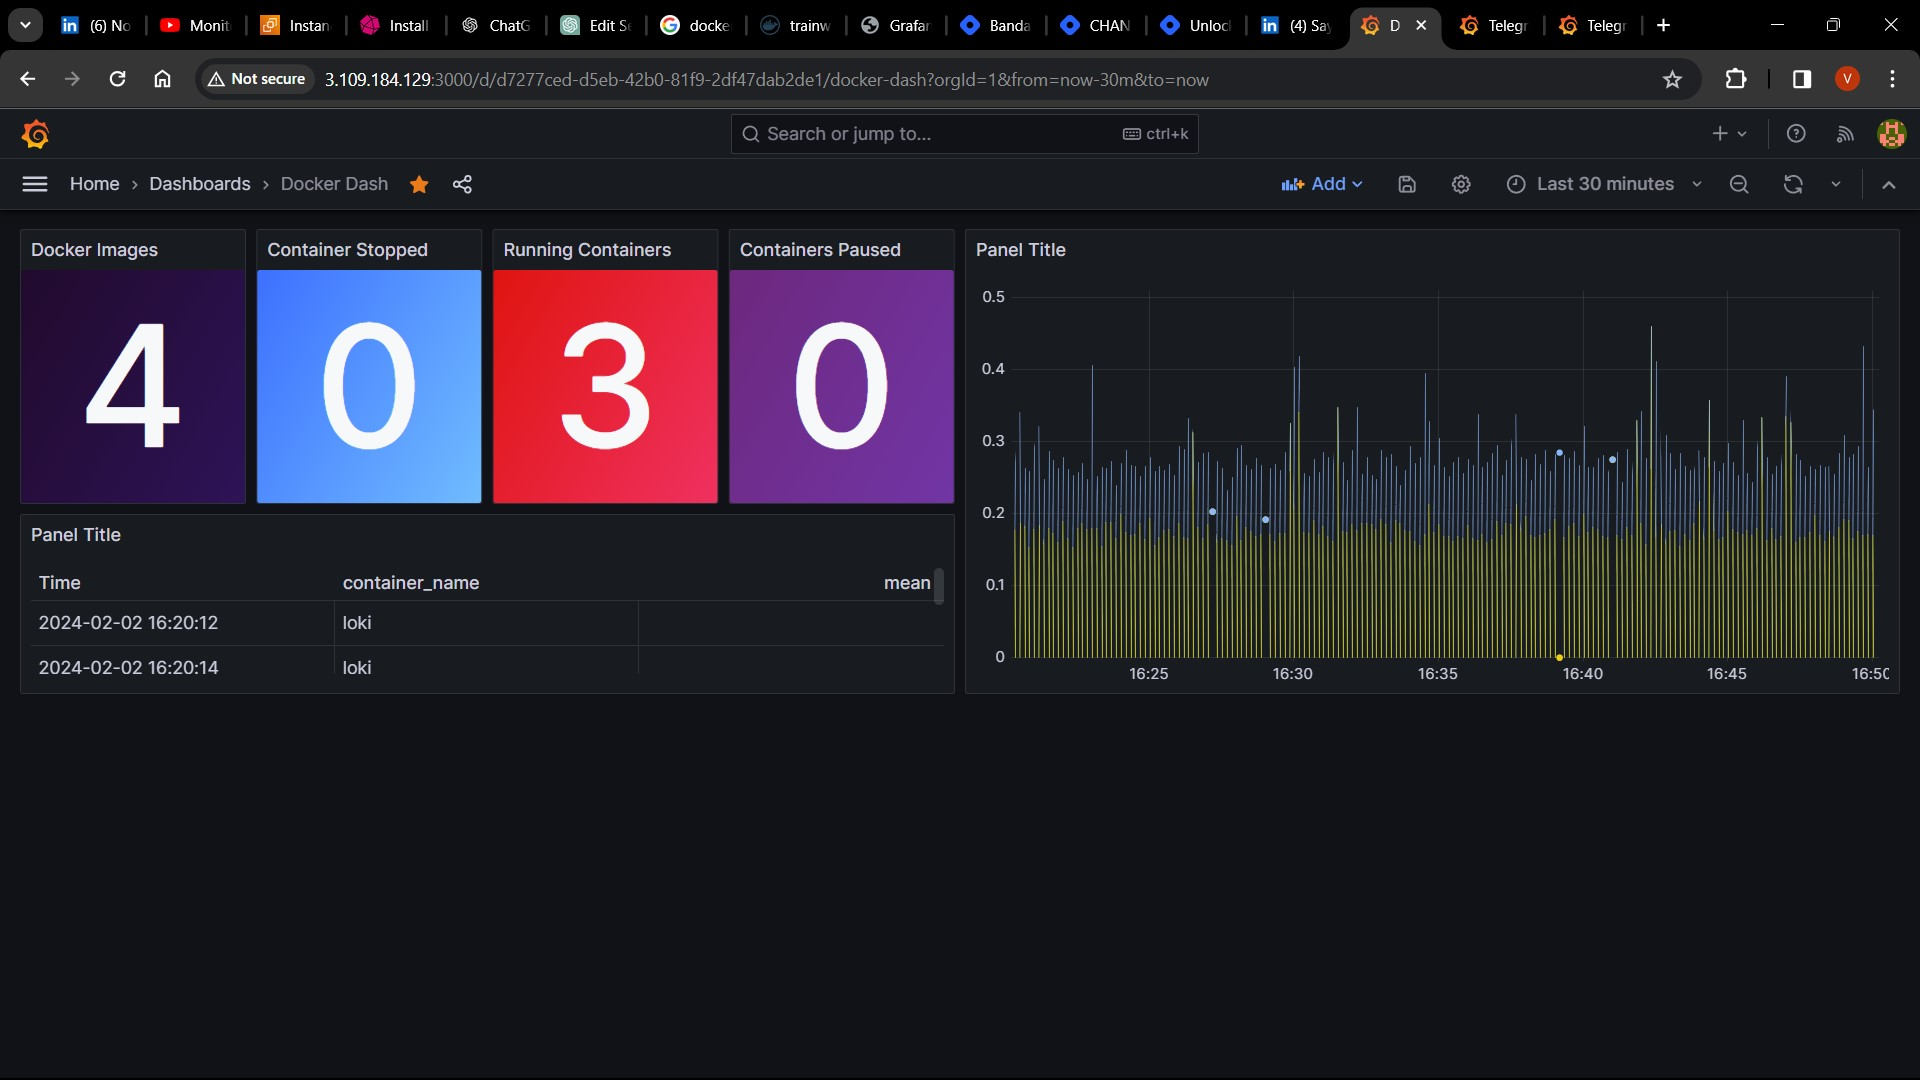
Dashboard:
Conclusion:
By following the steps outlined in this tutorial, you've successfully set up a Docker monitoring dashboard using Grafana, Telegraf, and InfluxDB. This dashboard provides valuable insights into your containerized applications, enabling you to monitor their health, performance, and resource utilization effectively.
Continuous monitoring and optimization of your Dockerized environment are essential for ensuring its reliability and efficiency. With the monitoring tools and practices in place, you can proactively identify issues, optimize resource usage, and maintain the stability of your containerized infrastructure.
Thank you for following along, and we hope you found this tutorial helpful in setting up your Docker monitoring solution. Happy monitoring!
Subscribe to my newsletter
Read articles from Vedant Thavkar directly inside your inbox. Subscribe to the newsletter, and don't miss out.
Written by

Vedant Thavkar
Vedant Thavkar
"DevOps enthusiast and aspiring engineer. Currently honing skills in streamlining development workflows and automating infrastructure. Learning AWS, Docker, Kubernetes, Python, and Ansible. Eager to contribute and grow within the DevOps community."