Top 10 API Monitoring Tools
 Abraham Dahunsi
API monitoring is very similar to web monitoring, as it provides important performance and availability metrics to ensure requests are handled properly. APIs are essential for enabling the integration of different systems, services, or applications, allowing them to work together seamlessly. API monitoring helps software teams find and troubleshoot API-related problems like high latency, security vulnerabilities, and errors to mitigate problems that could negatively impact customers or partners.
Why API Monitoring?
In 2021, DevOps.com estimated that there were over 200 million. There is also a belief amongst software developers that the use of APIs will increase even further, thanks to the fact that developers can now separate the frontend from the backend. The massive adoption of serverless and microservice applications has massively improved machine-to-machine and human-to-machine communication.
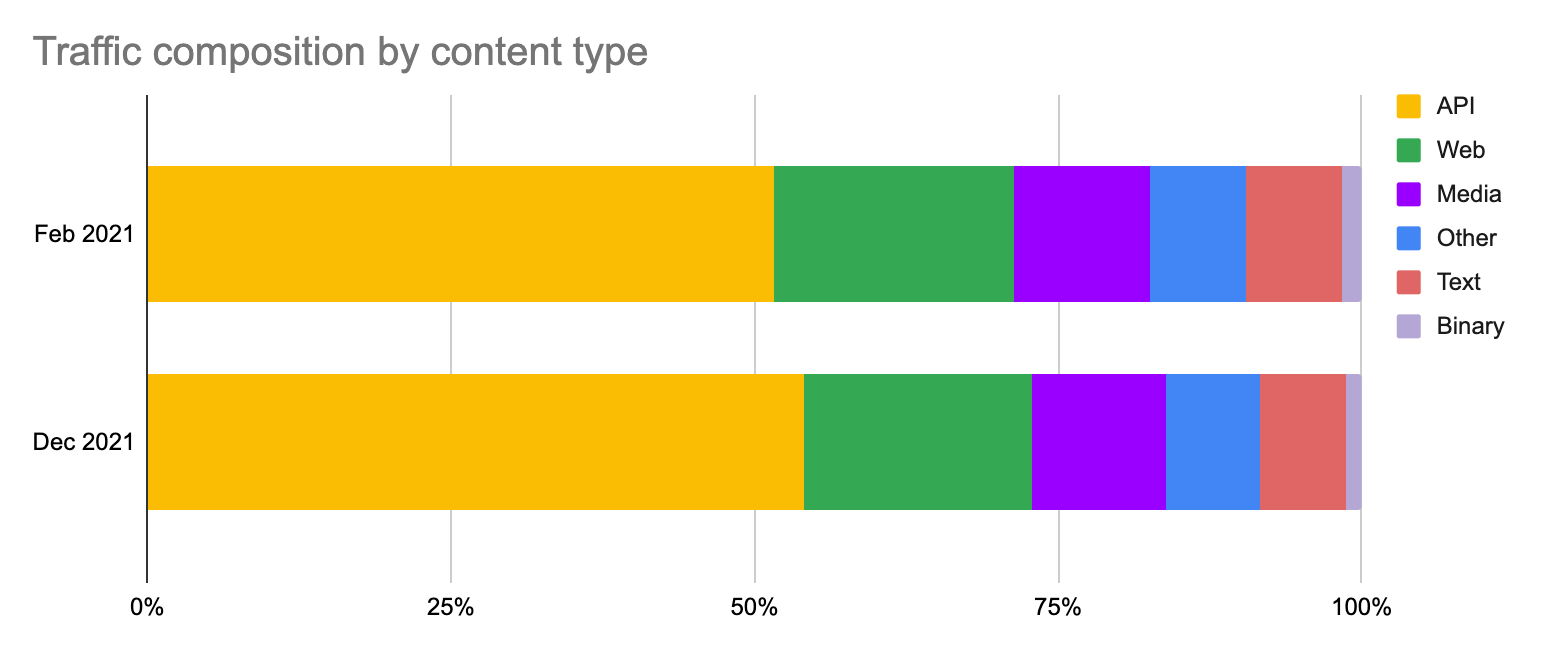
A study made by Cloudflare in 2021 also determined that out of all the requests processed by them, over 50% were API calls; this could very well be in the hundreds of millions. With all this in mind, it is important that your APIs are monitored extensively, just like your web servers.
In this guide, I will be listing the top 10 tools that can help you monitor your API applications.
The Top 10 API Monitoring Tools
Here are 10 of the best API Monitoring tools.
1. Datadog
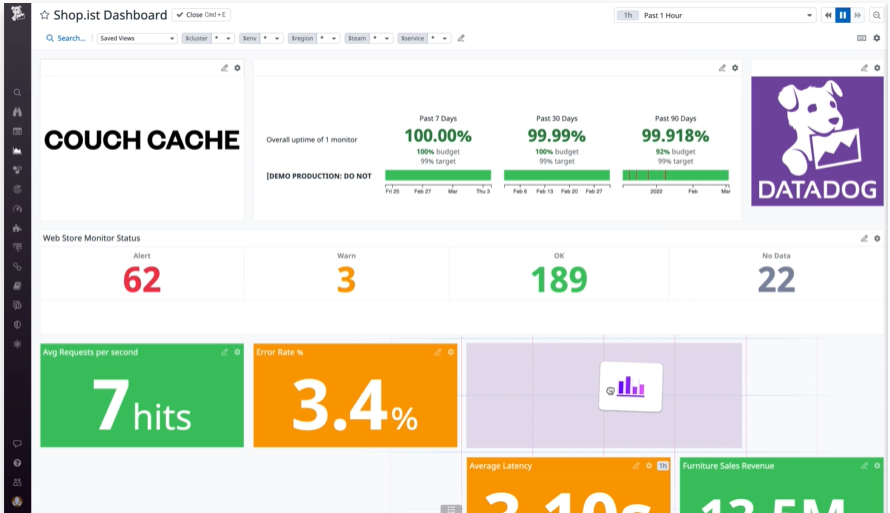
Datadog is a cloud-based platform that provides observability for modern applications. It allows you to monitor, troubleshoot, and optimize the performance and security of your servers, databases, tools, and services across the full devops stack. Datadog is unique in its ability to collect, analyze, and correlate data from different sources and present it in a unified and interactive dashboard.
Features:
Infrastructure Monitoring: Datadog collects metrics and events from over 400 integrations, including AWS, Azure, Google Cloud, Kubernetes, Docker, and more. You can visualize and be alert to the health and performance of your infrastructure in real-time.
Application Performance Monitoring (APM): Datadog traces requests from end to end across distributed systems and provides auto-generated service overviews, error rates, latency percentiles, and more. You can also instrument your code using open-source tracing libraries and customize your traces with tags and metadata.
Log Management: Datadog ingests, indexes, and analyzes your logs from any source and any format. You can quickly search, filter, and explore your logs in context with your metrics and traces. You can also visualize and alert on your log data and create custom log-based metrics.
Synthetic Monitoring: Datadog lets you proactively monitor your user experience by simulating critical user journeys on your website or web application. You can use an easy-to-use web recorder to capture your tests and run them from various locations and devices. You can also leverage AI-powered, self-maintaining tests to detect and alert on performance issues.
Real User Monitoring (RUM): Datadog enables you to measure and optimize the frontend performance of your web applications and correlate it with business impact. You can collect and analyze data from real user sessions, such as load times, frontend errors, and resources. You can also slice and dice your data by custom attributes and troubleshoot issues with frontend, backend, and business metrics in one view.
Pros:
Scalability: Datadog can handle large volumes of data and scale with your growing infrastructure and application complexity. You can also use Datadog's API to programmatically access and manipulate your data and settings.
Flexibility: Datadog offers a wide range of integrations, features, and customization options to suit your specific needs and preferences. You can also use Datadog's query language to perform advanced analytics and calculations on your data.
Collaboration: Datadog facilitates teamwork and communication across your organization by allowing you to share and annotate your dashboards, snapshots, and alerts. You can also use Datadog's chat integrations to discuss issues in context with your production data.
Cons:
Cost: Datadog's pricing is based on the number of hosts, containers, custom metrics, logs, traces, and synthetic tests you use, which can add up quickly and become expensive for large or complex environments.
Learning curve: Datadog's platform is rich and powerful, but it can also be overwhelming and confusing for new or inexperienced users. You may need to spend some time and effort learning how to use Datadog effectively and efficiently.
Support: Datadog's support is available via email, chat, and phone, but some users have reported delays or dissatisfaction with the quality and responsiveness of the support team.
Datadog's pricing is as follows:
Infrastructure Monitoring: $13 per host per month (up to 500 hosts).
APM: $33 per host per month (up to 500 hosts).
Log Management: $1.33 per million log events per month (up to 500 million).
Synthetic Monitoring: $6 per 10,000 test runs per month (up to 100,000).
RUM:$8 per 10,000 sessions per month (up to 100,000).
You can also try Datadog for free for 14 days and access all the features and integrations.
2. SigNoz
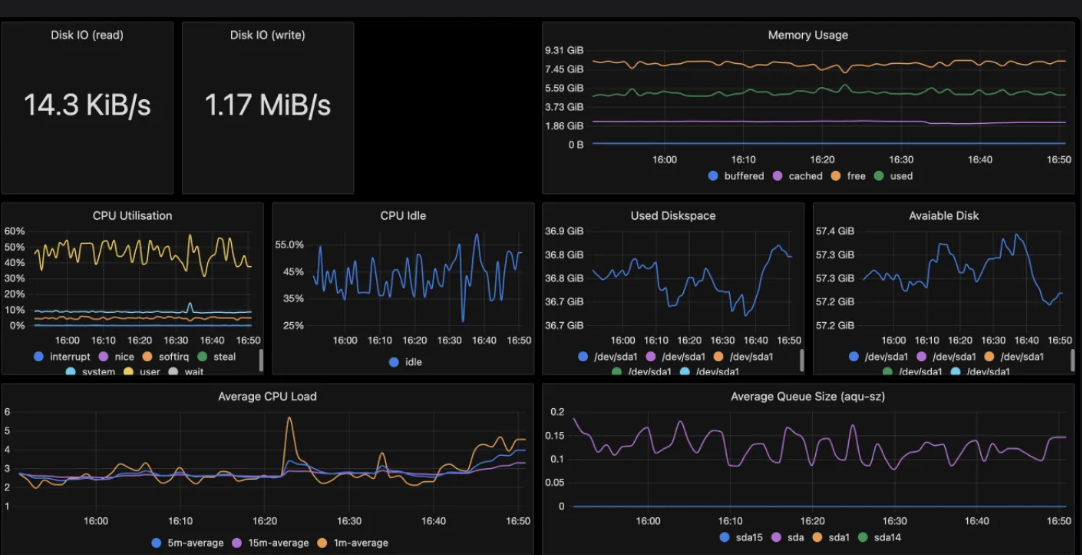
SigNoz is an open-source application performance monitoring (APM) tool that can be used for effective API monitoring. It is built to support OpenTelemetry natively, which means it can collect and analyze data from various sources and frameworks. SigNoz can help you monitor the performance, availability, and errors of your APIs across all your services and applications.
What makes SigNoz unique is that it is designed to handle modern architectures, such as microservices and serverless. It can monitor the top endpoints of all your services and provide important metrics like P95 and P99 latencies, requests per minute, errors per minute, and more. You can also create custom dashboards and alerts for your API monitoring needs.
Features:
Key Operations Section: This feature allows you to get details on API performance over time and filter based on different facets such as service name, endpoint, status code, etc. You can also drill down into individual traces and spans to identify the root cause of any issues.
Custom Dashboards: You can create your own dashboards for monitoring your APIs using SigNoz's query language, which is based on ClickHouse SQL. You can visualize key metrics like P95 and P99 latencies, requests per minute, errors per minute, and more for your APIs over time. You can also use pre-built dashboards for monitoring key APIs.
Alerts: You can set up alerts for your APIs based on various conditions and thresholds. You can choose to receive notifications via email, Slack, or webhook. You can also configure alert policies and escalation rules to manage your alert workflow.
Distributed Tracing: You can use SigNoz to trace the entire journey of an API request across multiple services and applications. You can see the latency, status, and tags of each span in the trace. You can also use flame graphs to visualize the critical paths and bottlenecks of your API requests.
OpenTelemetry Support: SigNoz supports OpenTelemetry, which is a vendor-neutral standard for collecting and exporting telemetry data from various sources and frameworks. You can use OpenTelemetry to instrument your APIs with minimal code changes and send the data to SigNoz for analysis.
Pros:
Open Source and Self-Hosted: SigNoz is an open source tool that you can host on your own infrastructure. This gives you full control and ownership of your data and avoids vendor lock-in. You can also customize and extend SigNoz to suit your specific needs and preferences.
Scalable and Cost-Effective: SigNoz is built on top of ClickHouse, which is a high-performance columnar database that can handle large volumes of data with low latency and high compression. This makes SigNoz scalable and cost-effective for API monitoring, as you can store and query more data with fewer resources.
Easy to Use and Integrate: SigNoz has a user-friendly interface that makes it easy to use and understand. You can also integrate SigNoz with your existing tools and workflows using its REST API and webhooks. You can also leverage the OpenTelemetry ecosystem to instrument your APIs with various languages and frameworks.
Cons:
Limited Documentation and Support: SigNoz is a relatively new and evolving tool that may not have comprehensive documentation and support. You may encounter some bugs or issues that are not well documented or resolved. You may also have to rely on the community for help and feedback.
Lack of Advanced Features: SigNoz may not have some of the advanced features that other API monitoring tools offer, such as synthetic monitoring, anomaly detection, root cause analysis, etc. You may have to use other tools or methods to complement SigNoz for your API monitoring needs.
Dependency on OpenTelemetry: SigNoz depends on OpenTelemetry for collecting and exporting telemetry data from your APIs. This means you have to install and configure OpenTelemetry agents or libraries for your APIs, which may add some overhead and complexity. You may also have to keep up with the changes and updates of OpenTelemetry, which is still in beta.
SigNoz offers a free and open source version that you can use for API monitoring without any limitations. You can also opt for their paid plans, which include additional features and benefits such as:
Managed Hosting: You can choose to have SigNoz hosted and managed by their team on their cloud infrastructure. This saves you the hassle and cost of setting up and maintaining your own servers and databases.
Premium Support: You can get priority support and guidance from SigNoz's experts via email, chat, or phone. You can also get access to exclusive webinars, tutorials, and best practices.
The pricing of SigNoz's paid plans depends on the number of hosts and the amount of data you use for API monitoring. You can contact them for a quote and a free trial.
3. BetterStack
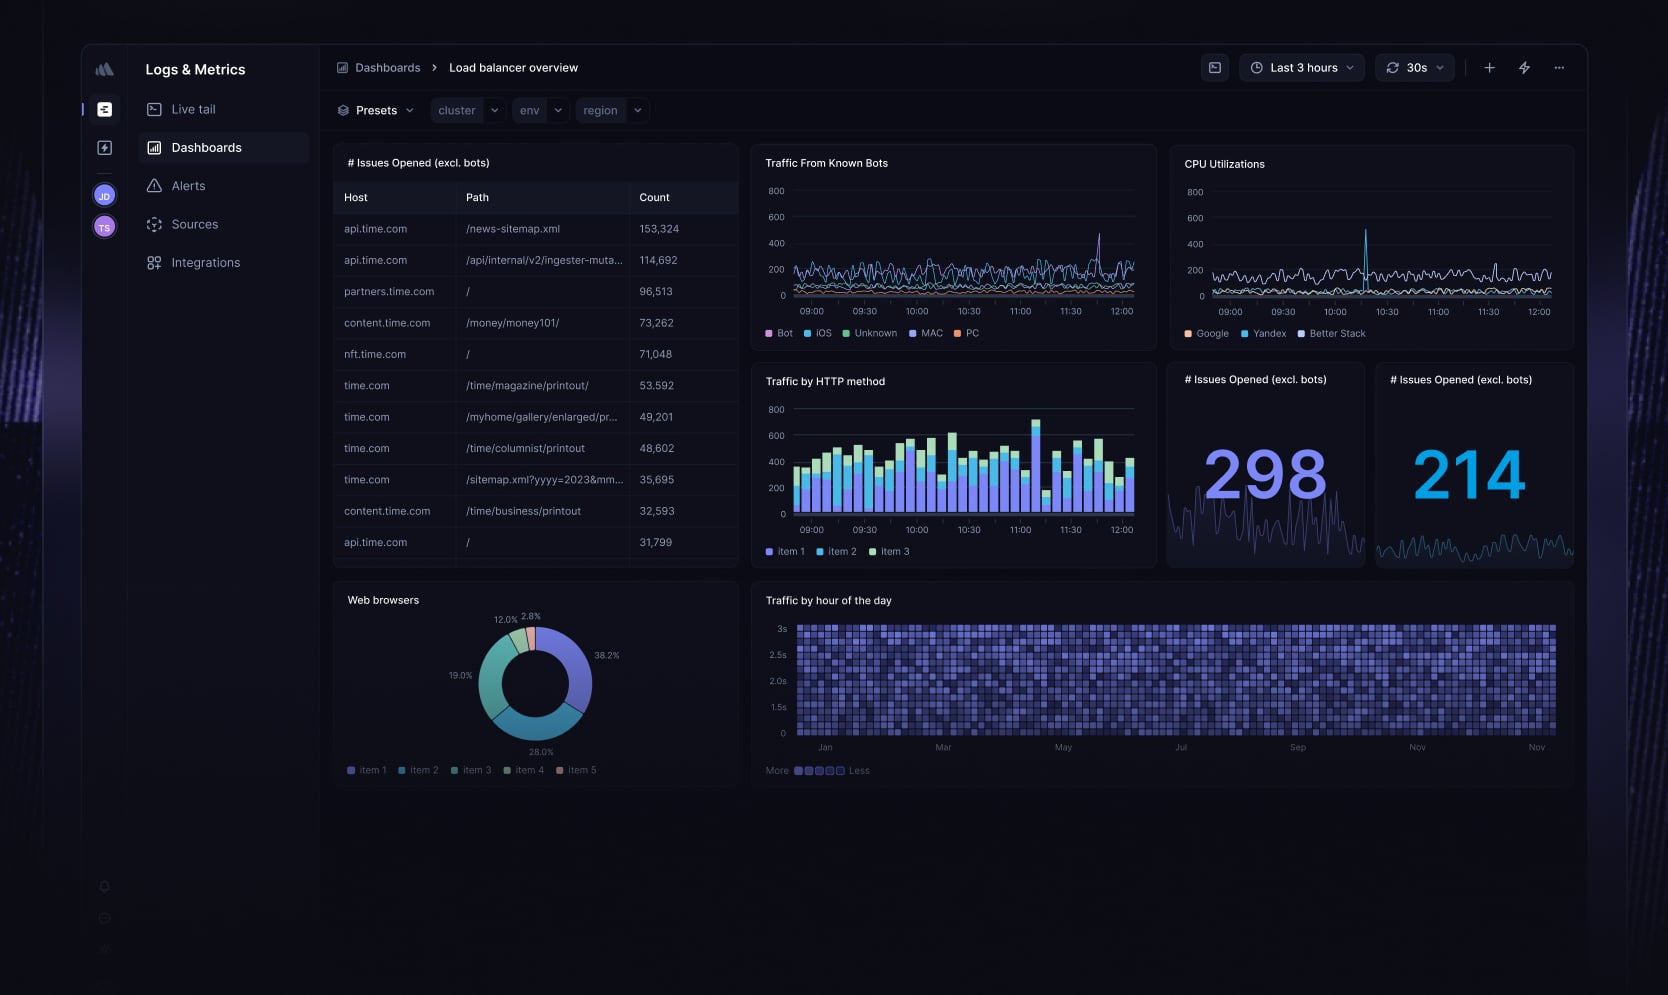
Better Stack is a comprehensive uptime monitoring and incident management solution that includes API monitoring as one of its features. It allows you to monitor the performance, availability, and errors of your APIs across all your services and applications. It also integrates with various third-party tools and platforms to provide you with a complete observability dashboard.
What makes Better Stack unique is that it offers a radically better monitoring solution that covers all the important aspects of synthetic monitoring, such as HTTPS keyword checks, heartbeat, SSL, ping, TLD, TCP/UDP, POP3/IMAP/SMTP, and DNS server monitoring. You can also create custom status pages and on-call schedules to communicate with your users and team members in case of any downtime.
Features:
API monitor: You can monitor your APIs by creating an HTTP status-code monitor or a keyword monitor. An uptime monitor will only check the returned status code, while a keyword monitor can check for a specific string in the API response.
Log management: You can collect and analyze logs from your APIs and other sources using Better Stack's log management feature. You can also search, filter, and visualize your logs using Better Stack's query language, which is based on ClickHouse SQL.
Incident management: You can manage and resolve incidents related to your APIs using Better Stack's incident management feature. You can create incidents manually or automatically, document them with screenshots and error logs, assign them to team members, and create post-mortems.
Status pages: You can create custom status pages for your APIs and other services using Better Stack's status page feature. You can customize the design, content, and domain of your status pages and allow your users to subscribe to updates via email or SMS.
On-call scheduling: You can create on-call schedules for your team members using Better Stack's on-call scheduling feature. You can set up alert policies and escalation rules and integrate them with popular communication tools like Slack, PagerDuty, Opsgenie, etc.
Pros:
Free and open source: Better Stack offers a free and open source version that you can use for API monitoring without any limitations. You can also host it on your own infrastructure and customize it to suit your needs and preferences.
30-second check frequency: Better Stack monitors your APIs as often as every 30 seconds from multiple locations to prevent false alerts. You can also set geo-specific checks to focus on location-related issues.
Comprehensive observability dashboards: Better Stack provides you with a comprehensive observability dashboard that shows you the key metrics and trends of your APIs and other services. You can also create your own dashboards using Better Stack's query language.
Cons:
Not a full-stack observability solution: Better Stack is mainly focused on uptime monitoring and incident management and may not have some of the advanced features that other observability tools offer, such as real user monitoring, distributed tracing, anomaly detection, root cause analysis, etc. You may have to use other tools or methods to complement Better Stack for your observability needs.
Not as feature-rich as some of the larger, much older platforms: Better Stack is a relatively new and evolving tool that may not have as many features and integrations as some of the larger, much older platforms in the space. You may encounter some bugs or issues that are not well documented or resolved. You may also have to rely on the community for help and feedback.
Dependency on ClickHouse: Better Stack is built on top of ClickHouse, which is a high-performance columnar database that can handle large volumes of data with low latency and high compression. This makes Better Stack scalable and cost-effective, but it also adds some overhead and complexity. You have to install and configure ClickHouse for your APIs and keep up with the changes and updates to ClickHouse.
Better Stack offers a free and open-source version that you can use for API monitoring without any limitations. You can also opt for their paid plans, which include additional features and benefits such as:
Managed hosting: You can choose to have Better Stack hosted and managed by their team on their cloud infrastructure. This saves you the hassle and cost of setting up and maintaining your own servers and databases.
Premium support: You can get priority support and guidance from Better Stack's experts via email, chat, or phone. You can also get access to exclusive webinars, tutorials, and best practices.
Custom integrations: You can request custom integrations with your existing tools and platforms, such as AWS, Azure, GCP, Kubernetes, etc. You can also get access to new features and enhancements before they are released to the public.
The pricing of Better Stack's paid plans depends on the number of hosts and the amount of data you use for API monitoring. You can contact them for a quote and a free trial.
4. AWS Cloudwatch
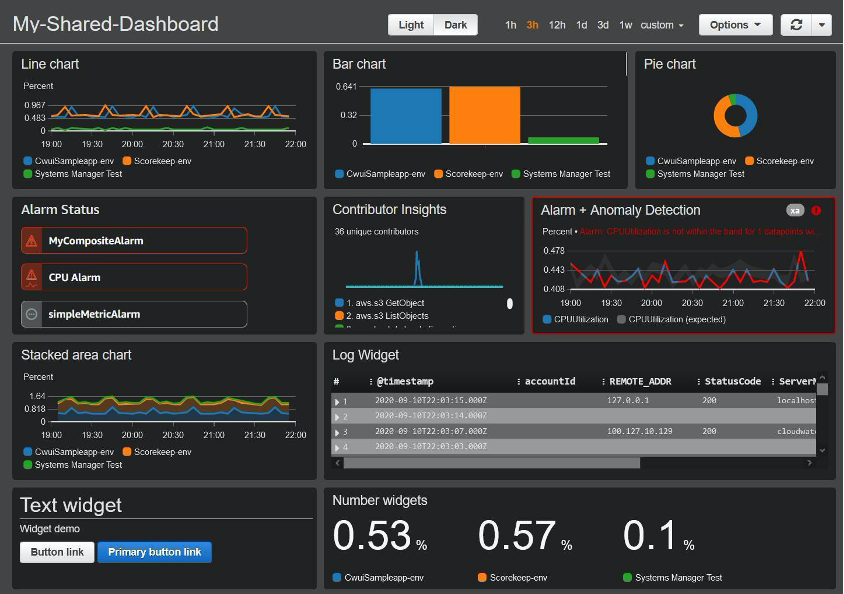
AWS Cloudwatch is a monitoring and observability service that can be used for API monitoring. It collects and processes raw data from various AWS services, including API Gateway, into readable, near-real-time metrics. These metrics provide a simple way to track the performance, availability, and errors of your APIs across all your services and applications.
What makes AWS Cloudwatch unique is that it offers a comprehensive monitoring solution that covers all the important aspects of API monitoring, such as uptime, latency, errors, requests, throttling, caching, logging, tracing, and more. You can also create custom dashboards and alerts for your API monitoring needs.
Features:
API Gateway metrics: You can monitor your APIs by using Cloudwatch metrics that are automatically generated by API Gateway. These metrics include information such as the number of API calls, the latency of API calls, the number of cache hits and misses, the number of 4xx and 5xx errors, and more.
API Gateway logs: You can monitor your APIs by using Cloudwatch logs that are optionally enabled by API Gateway. These logs include detailed information such as the request and response headers, the source IP address, the user agent, the API key, and more.
X-Ray tracing: You can monitor your APIs by using X-Ray tracing that is optionally enabled by API Gateway. This feature allows you to trace the entire journey of an API request across multiple services and applications. You can see the latency, status, and annotations of each segment in the trace. You can also use service maps to visualize the relationships and performance of your services.
Cloudwatch alarms: You can monitor your APIs by using Cloudwatch alarms that are triggered by Cloudwatch metrics or events. You can set up alarms for your APIs based on various conditions and thresholds. You can choose to receive notifications via email, SMS, or SNS. You can also configure alarm actions to take specific actions when the alarm state changes, such as invoking a Lambda function, publishing to an SNS topic, or sending a message to an SQS queue.
Cloudwatch dashboards: You can monitor your APIs by using Cloudwatch dashboards that are customizable and shareable. You can create your own dashboards for monitoring your APIs using Cloudwatch widgets, which can display graphs, numbers, text, or markdown. You can also use pre-built dashboards for monitoring your APIs that are provided by API Gateway.
Pros:
Fully integrated with AWS: AWS Cloudwatch is fully integrated with AWS services, including API Gateway, which makes it easy to use and configure. You can also leverage the AWS ecosystem to integrate Cloudwatch with other tools and platforms, such as Lambda, SNS, SQS, etc.
Scalable and reliable: AWS Cloudwatch is scalable and reliable, as it can handle large volumes of data and metrics with high availability and durability. You can also use Cloudwatch high-resolution metrics to monitor your APIs with a granularity of up to one second.
Flexible and customizable: AWS Cloudwatch is flexible and customizable, as it allows you to create your own metrics, logs, and traces for your APIs using a Cloudwatch agent, SDK, or API. You can also create your own dashboards and alarms for your APIs using Cloudwatch widgets, query languages, or APIs.
Cons:
Not a full-stack observability solution: AWS Cloudwatch is mainly focused on monitoring and observability and may not have some of the advanced features that other observability tools offer, such as synthetic monitoring, anomaly detection, root cause analysis, etc. You may have to use other tools or methods to complement Cloudwatch for your observability needs.
Complex and overwhelming: AWS Cloudwatch is complex and overwhelming, as it has a lot of features and options that may be difficult to understand and use. You may encounter some challenges or issues with Cloudwatch, such as data inconsistency, data retention, data aggregation, data visualization, etc.
Costly and unpredictable: AWS Cloudwatch is costly and unpredictable, as it charges you based on the number and size of metrics, logs, and traces that you use for your APIs. You may also incur additional charges for other features and services that you use with Cloudwatch, such as alarms, dashboards, X-rays, SNS, etc.
AWS Cloudwatch offers a free tier that you can use for API monitoring with some limitations. You can also opt for their paid plans, which include additional features and benefits such as:
Standard plan: You can use the standard plan for API monitoring with a higher number and size of metrics, logs, and traces. You can also use more alarms, dashboards, and high-resolution metrics. You pay for what you use based on the pricing of each feature and service.
Enterprise plan: You can use the enterprise plan for API monitoring with the same features and benefits as the standard plan, plus some additional features such as anomaly detection and metric math. You also get a discount on the pricing of each feature and service.
The pricing of AWS Cloudwatch's paid plans depends on the number and size of metrics, logs, and traces that you use for API monitoring, as well as the number and type of alarms, dashboards, and other features and services that you use with Cloudwatch. You can use the AWS pricing calculator to estimate your costs.
5. Sematext
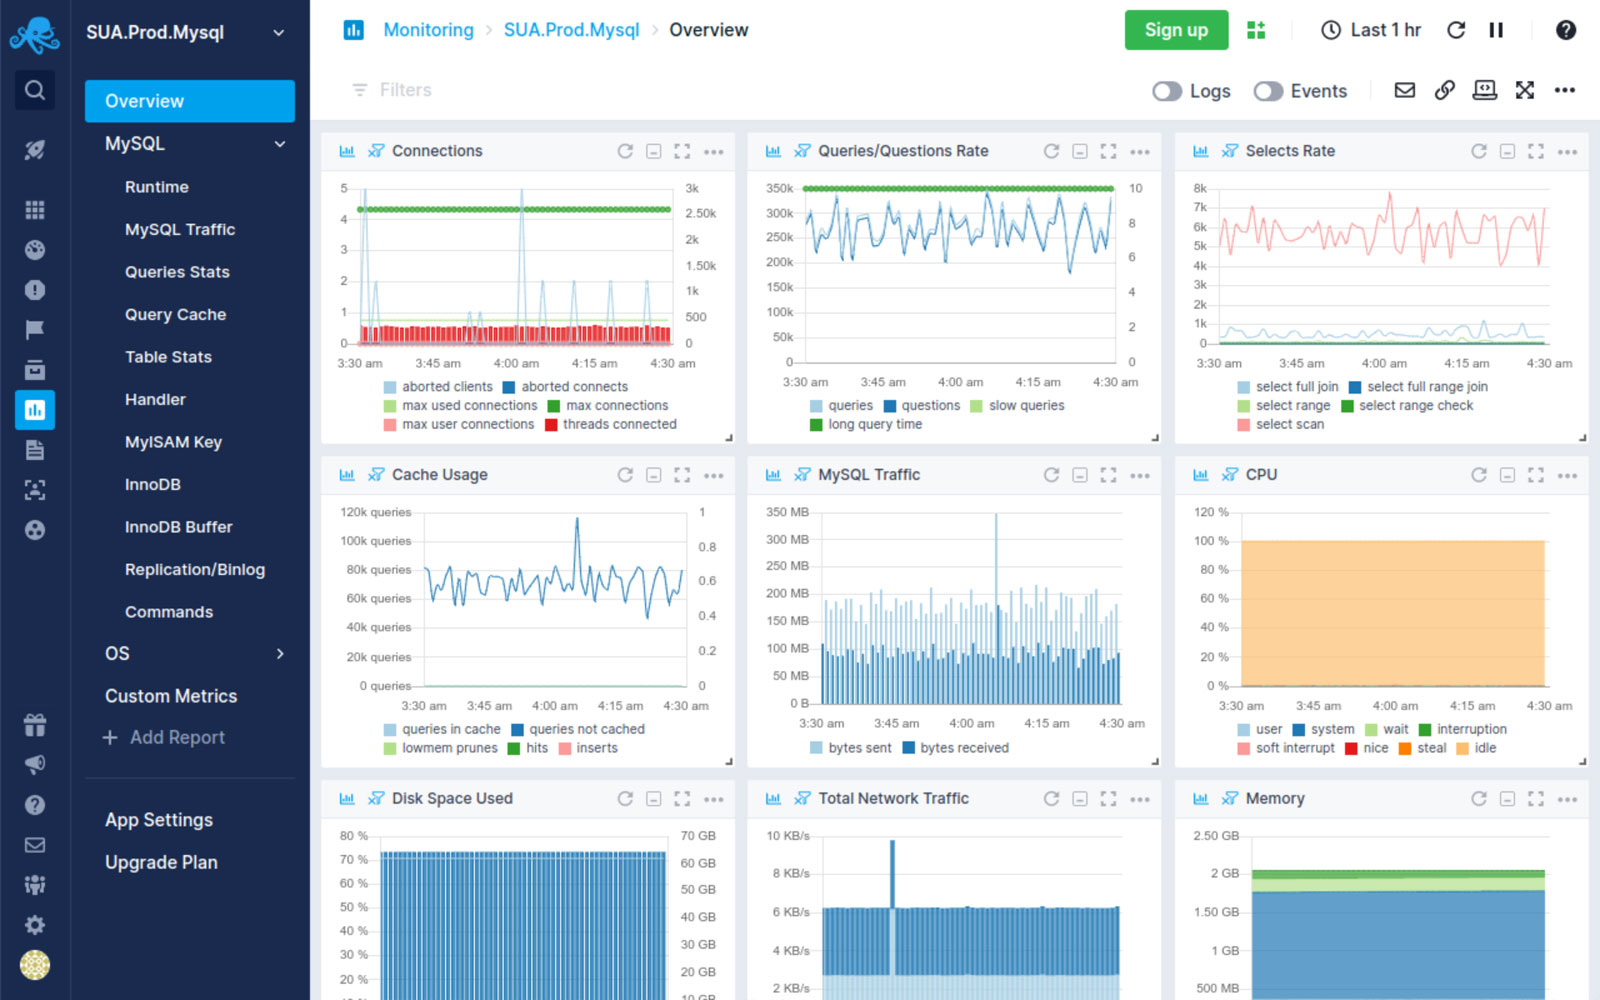
Sematext is a cloud-based observability platform that can be used for API monitoring. It collects and analyzes metrics, logs, traces, and events from various sources, including web services and APIs. It helps you monitor the performance, availability, and errors of your APIs across all your services and applications.
What makes sematext unique is that it offers a full-stack observability solution that covers all the important aspects of API monitoring, such as uptime, latency, errors, requests, throttling, caching, logging, tracing, and more. You can also create custom dashboards and alerts for your API monitoring needs.
Features:
Synthetics: You can monitor your APIs by using synthetics, which are automated tests that simulate user interactions with your web services and APIs. You can create HTTP and browser monitors to check the availability and performance of your APIs from different locations around the world.
APM: You can monitor your APIs by using APM, which is an application performance monitoring tool that provides deep visibility into the performance of your applications and services. You can use transaction tracing to track the entire journey of an API request across multiple services and applications. You can also use service maps to visualize the relationships and performance of your services.
Logs: You can monitor your APIs by using logs, which are records of events and activities that occur in your web services and APIs. You can collect and analyze logs from your APIs and other sources using sematext's log management feature. You can also search, filter, and visualize your logs using sematext's query language, which is based on Elasticsearch.
Metrics: You can monitor your APIs by using metrics, which are numerical values that measure the performance and health of your web services and APIs. You can collect and analyze metrics from your APIs and other sources using sematext's infrastructure monitoring feature. You can also create your own metrics and dashboards using sematext's agent, SDK, or API.
Alerts: You can monitor your APIs by using alerts, which are notifications that inform you of important events or issues that affect your web services and APIs. You can set up alerts for your APIs based on various conditions and thresholds. You can choose to receive notifications via email, SMS, or SNS. You can also configure alert actions to take specific actions when the alert state changes, such as invoking a Lambda function, publishing to an SNS topic, or sending a message to an SQS queue.
Pros:
Free and self-hosted: Sematext offers a free and self-hosted version that you can use for API monitoring without any limitations. You can also host it on your own infrastructure and customize it to suit your needs and preferences.
Fully integrated with AWS: Sematext is fully integrated with AWS services, including API Gateway, which makes it easy to use and configure. You can also leverage the AWS ecosystem to integrate sematext with other tools and platforms, such as Lambda, SNS, SQS, etc.
Flexible and customizable: Sematext is flexible and customizable, as it allows you to create your own metrics, logs, traces, and alerts for your APIs using sematext's agent, SDK, or API. You can also create your own dashboards and reports for your APIs using sematext's widgets, query language, or API.
Cons:
Not as feature-rich as some of the larger, much older platforms: Sematext is a relatively new and evolving tool that may not have as many features and integrations as some of the larger, much older platforms in the space. You may encounter some bugs or issues that are not well documented or resolved. You may also have to rely on the community for help and feedback.
Complex and overwhelming: Sematext is complex and overwhelming, as it has a lot of features and options that may be difficult to understand and use. You may encounter some challenges or issues with sematext, such as data inconsistency, data retention, data aggregation, data visualization, etc.
Costly and unpredictable: Sematext is costly and unpredictable, as it charges you based on the number and size of metrics, logs, traces, and events that you use for your APIs. You may also incur additional charges for other features and services that you use with sematext, such as alerts, dashboards, synthetics, APM, etc.
Sematext offers a free and self-hosted version that you can use for API monitoring without any limitations. You can also opt for their paid plans, which include additional features and benefits such as:
Cloud: You can choose to have sematext hosted and managed by their team on their cloud infrastructure. This saves you the hassle and cost of setting up and maintaining your own servers and databases.
Enterprise: You can choose to have sematext customized and supported by their team on your own infrastructure. This gives you more control and flexibility over your data and configuration.
The pricing of sematext's paid plans depends on the number and size of metrics, logs, traces, and events that you use for API monitoring, as well as the number and type of alerts, dashboards, and other features and services that you use with sematext. You can use the sematext pricing calculator to estimate your costs.
6. Postman
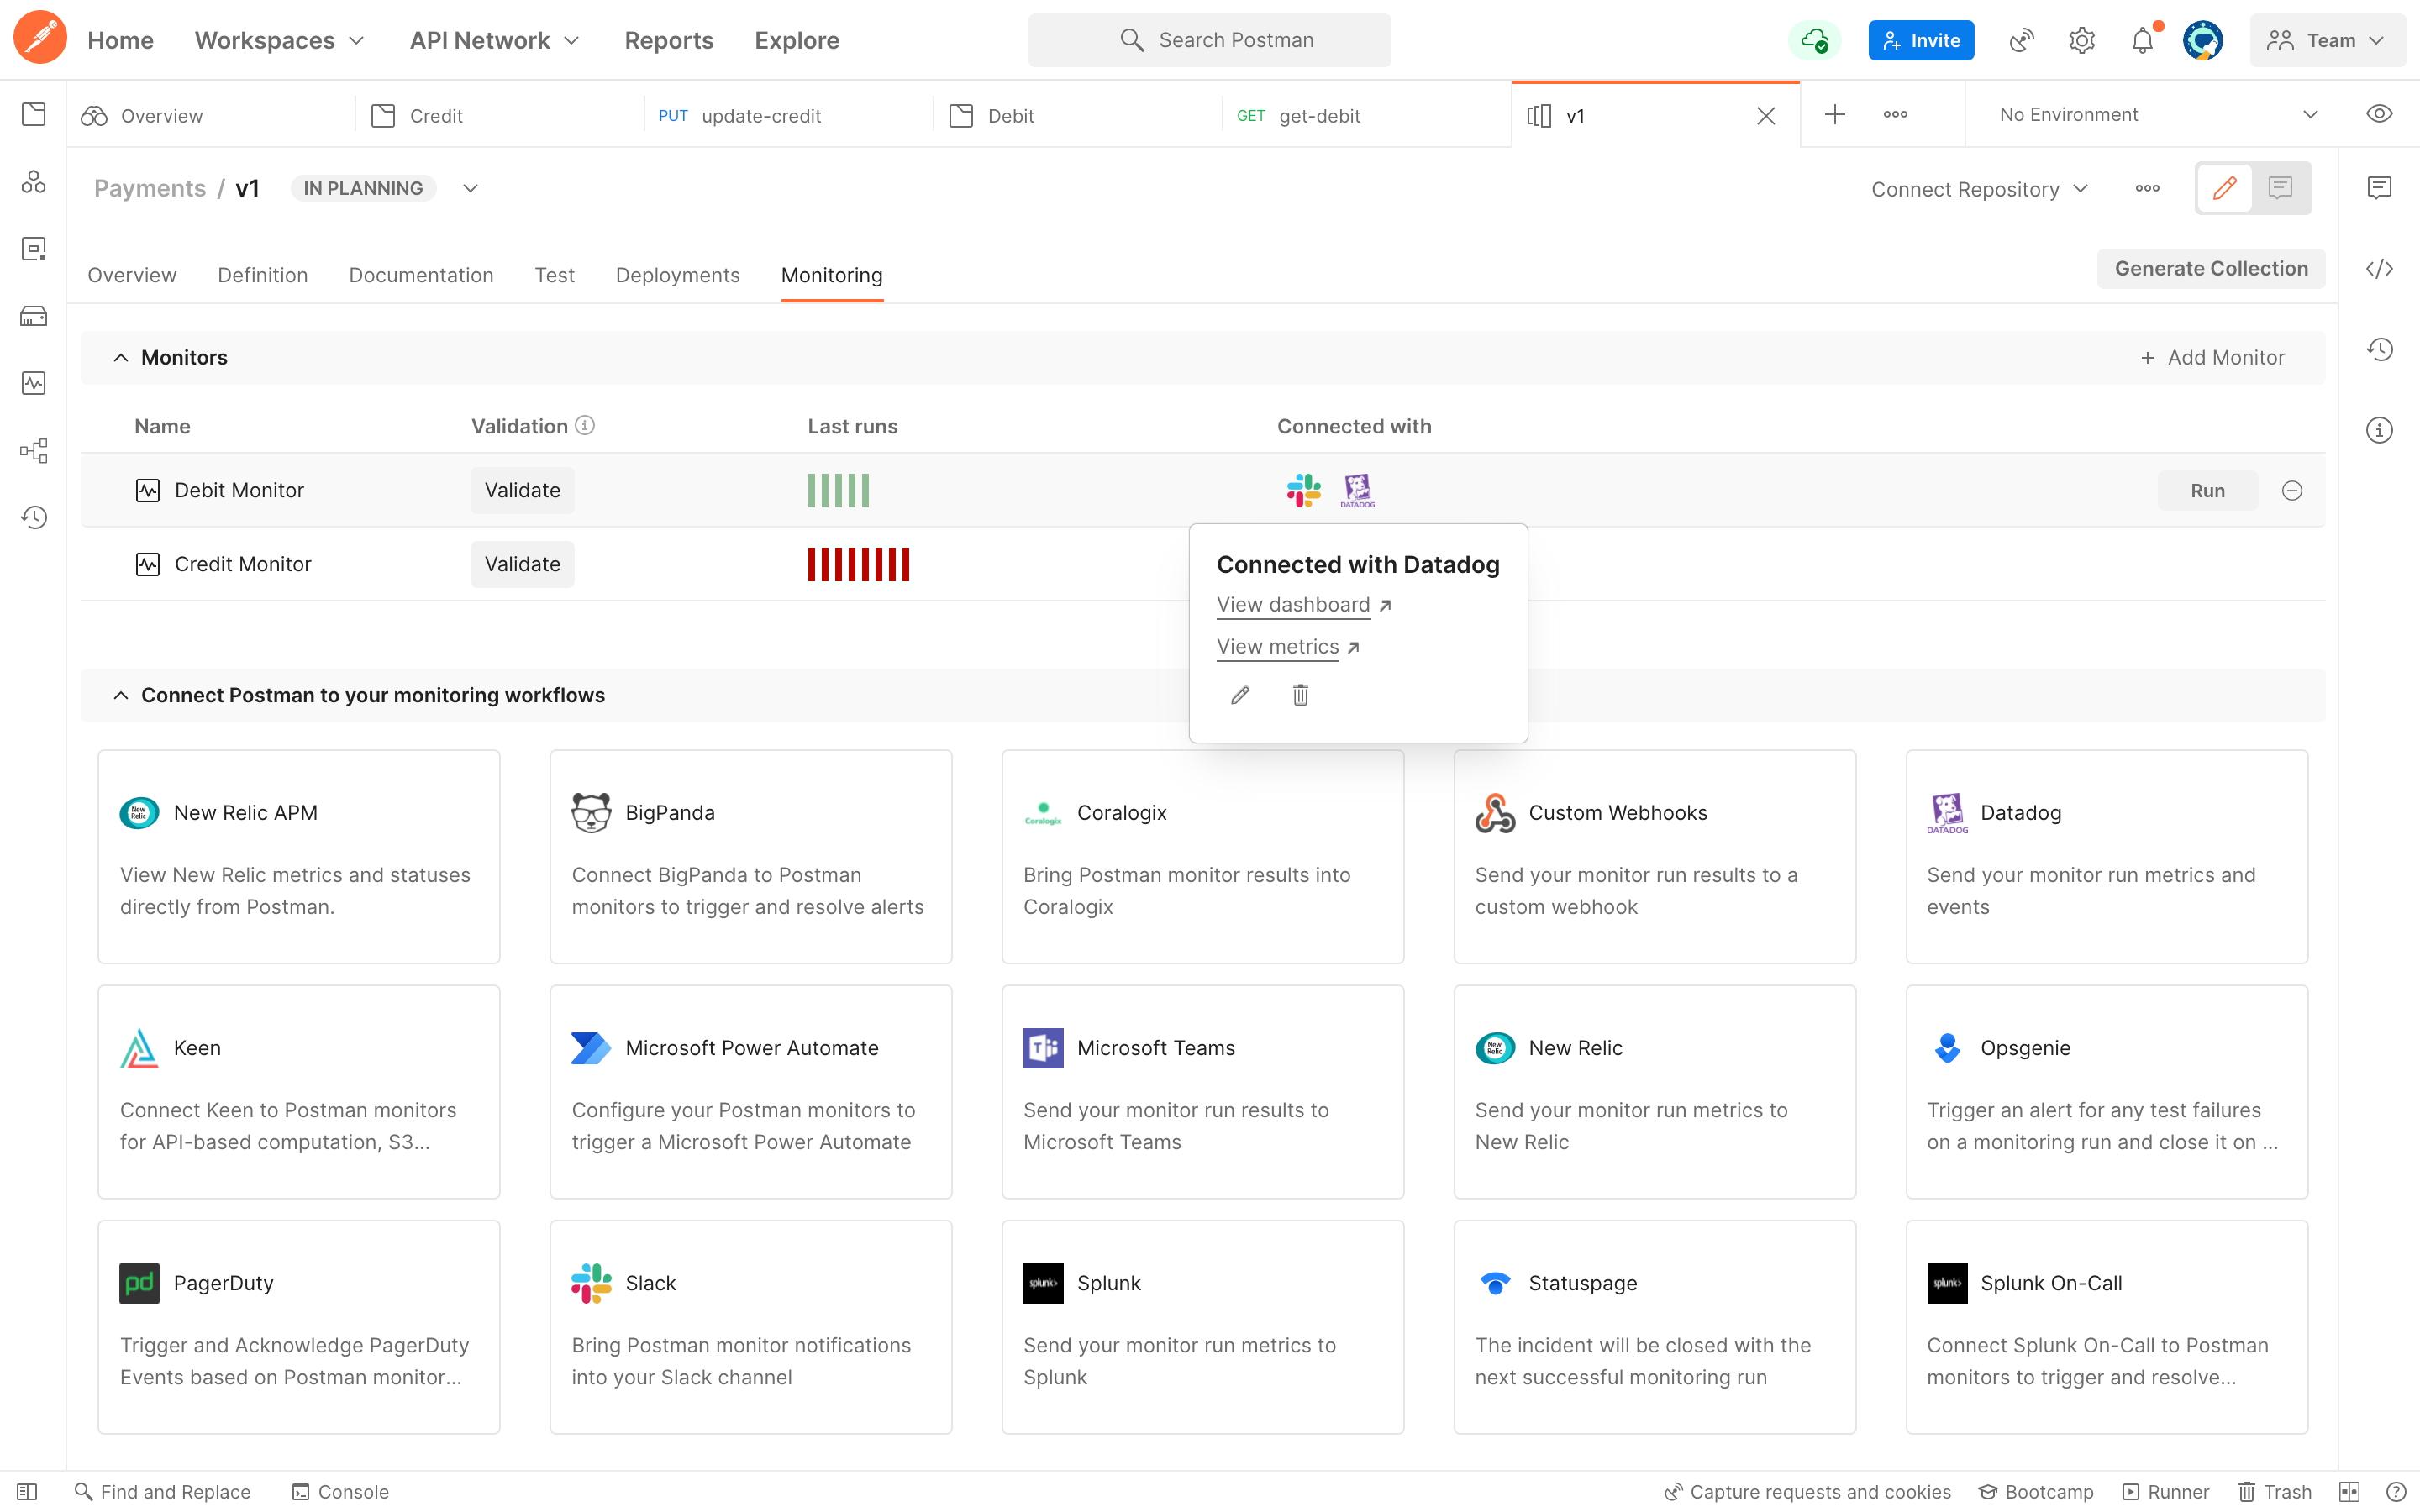
Postman is a popular and powerful tool for API development and testing that can also be used for API monitoring. It allows you to create, run, and analyze requests to your web services and APIs. It also integrates with various third-party tools and platforms to provide you with a complete API lifecycle management solution.
What makes Postman unique is that it offers a user-friendly and collaborative environment for API monitoring, where you can easily create, share, and execute monitors for your APIs. You can also use Postman's rich collection of features and functionalities to monitor your APIs in various ways, such as using pre-request scripts, tests, variables, environments, etc.
Features:
Collection runner: You can monitor your APIs by using the collection runner, which is a feature that allows you to run a collection of requests in a sequence. You can use the collection runner to check the availability and performance of your APIs from different locations around the world.
Monitors: You can monitor your APIs by using monitors, which are scheduled collection runs that are executed by Postman's cloud service. You can use monitors to check the uptime, latency, and errors of your APIs over time. You can also view the results and trends of your monitors on Postman's web dashboard.
Tests: You can monitor your APIs by using tests, which are snippets of JavaScript code that you can write to validate the response of your requests. You can use tests to check the status code, response time, response body, headers, cookies, and more of your APIs. You can also use tests to set and get variables, generate dynamic data, and perform calculations.
Alerts: You can monitor your APIs by using alerts, which are notifications that inform you of important events or issues that affect your monitors. You can set up alerts for your monitors based on various conditions and thresholds. You can choose to receive notifications via email, Slack, or webhook.
Integrations: You can monitor your APIs by using integrations, which are connections that allow you to sync your Postman data with other tools and platforms. You can use integrations to enhance your API monitoring workflow, such as sending monitor results to Datadog, creating issues in GitHub, or triggering actions in Zapier.
Pros:
Easy to use and learn: Postman is easy to use and learn, as it has a simple and intuitive interface that makes it accessible to both beginners and experts. You can also find a lot of resources and documentation to help you get started and learn more about Postman.
Flexible and customizable: Postman is flexible and customizable, as it allows you to create your own requests, collections, monitors, tests, and integrations for your APIs. You can also use Postman's scripting capabilities to add logic and functionality to your API monitoring.
Collaborative and shareable: Postman is collaborative and shareable, as it allows you to work with your team members and other stakeholders on your API projects. You can use Postman's cloud service to sync and share your data across devices and platforms. You can also use Postman's public API network to discover and consume APIs from various domains and industries.
Cons:
Not a full-stack observability solution: Postman is mainly focused on API development and testing, and may not have some of the advanced features that other observability tools offer, such as distributed tracing, anomaly detection, root cause analysis, etc. You may have to use other tools or methods to complement Postman for your observability needs.
Limited free plan: Postman offers a free plan that you can use for API monitoring with some limitations. You can only create up to 10 monitors, run up to 1,000 monitoring calls per month, and store up to 25 MB of monitoring data. You may also encounter some performance issues or delays with your monitors.
Costly and complex paid plans: Postman offers paid plans that you can use for API monitoring with more features and benefits. However, these plans can be costly and complex, as they charge you based on the number of users, monitors, monitoring calls, and monitoring data that you use. You may also have to deal with some billing and subscription issues with your plans.
Postman offers a free plan that you can use for API monitoring with some limitations. You can also opt for their paid plans, which include additional features and benefits.
7. APIMetrics
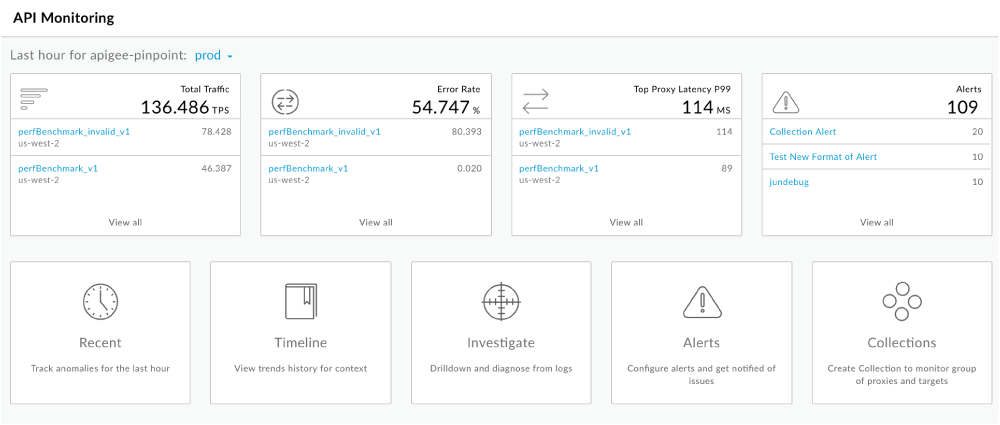
APIMetrics is a low-code platform for API metrics, security, performance, SLA tracking and governance monitoring for the APIs you provide or depend on. It is unique in its ability to measure real-world, end-to-end API performance from multiple cloud locations, and provide intelligent insights using AI and data from over a billion API calls.
Features:
Multi-step calls: You can monitor API sequences that are critical to your users, such as login, checkout, or payment processes.
Cross-cloud monitoring: You can test your APIs from over 80 locations around the world, and see how they perform in different regions and networks.
API functionality verification: You can set assertions, override expected HTTP return codes, and validate the content and security of your API responses.
Performance management and SLAs: You can define and monitor SLAs for availability and latency, and see quality metrics using the CASC (Cloud API Service Consistency) measure. You can also benchmark your API against similar ones in your industry using data from the APIMetrics API Directory.
AI-driven insights: You can leverage the APIMetrics AI engine, trained on over a billion real API calls, to spot trends, issues, and problems before they impact your users.
Pros:
Easy setup and integration: You can quickly configure your API calls using the call creator or sync collections from your API documentation via Postman, OpenAPI, and more. You can also integrate APImetrics with your favorite DevOps tools, such as Slack, DataDog, HipChat, OpsGenie, and more.
Trusted and secure: APImetrics is used by leading banks, telecoms, IT providers, and government agencies to deliver high-quality API services and comply with regulations. It also supports various authentication methods, such as API keys and OAuth.
Real-time alerts and reports: You can get notified of any API issues via email or webhook, and access detailed dashboards, status pages, performance and benchmarking reports for any REST and SOAP API.
Cons:
Limited free plan: The free plan only allows you to monitor up to 5 APIs, with 1,000 calls per month, and 1 location. You may need to upgrade to a paid plan to access more features and resources.
Complex pricing model: The pricing model is based on the number of APIs, calls, locations, and features you need, which can be confusing and hard to estimate. You may need to contact the sales team to get a custom quote for your use case.
Lack of documentation and support: The APIMetrics website does not provide much documentation or tutorials on how to use the platform, and the support options are limited to email and chat. You may need to rely on your own trial and error or seek help from the community.
The pricing of APIMetrics depends on the number of APIs, calls, locations, and features you need. The basic plan starts from $29 per month, and the Team plan starts from $99 per month. There are also enterprise and custom plans available upon request. You can also try APIMetrics for free for 14 days.
8 RapidAPI
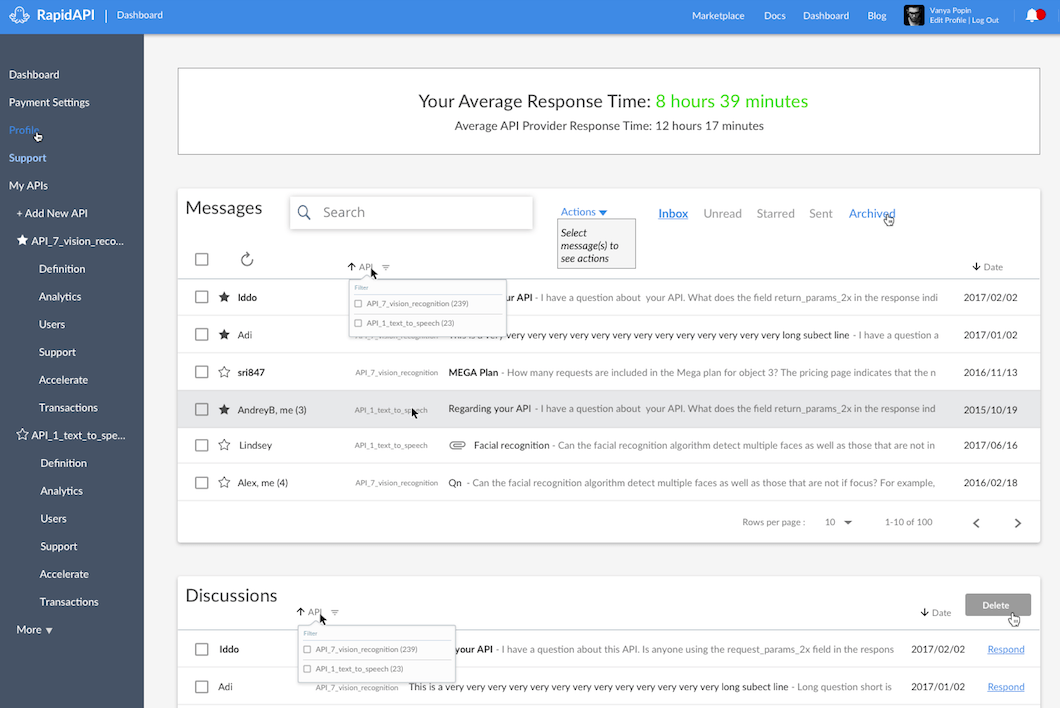
RapidAPI is a platform that connects developers to thousands of APIs from various categories, such as weather, sports, news, entertainment, and more. It is unique in its ability to provide a unified interface for discovering, testing, and integrating APIs from multiple sources, as well as managing and monitoring their performance.
Features:
API Hub: You can browse and search over 40,000 APIs from different providers, and see their ratings, reviews, documentation, and pricing.
API Client: You can test and debug any API using a built-in API client that supports various methods, headers, parameters, and authentication schemes.
API Dashboard: You can track and analyze the usage, latency, and errors of any API you subscribe to, and set alerts and notifications for any issues.
API Marketplace: You can monetize your own APIs by publishing them on the RapidAPI marketplace, and set your own plans and pricing.
API Enterprise Hub: You can create a private and customized API hub for your organization, and manage the access, security, and governance of your internal and external APIs.
Pros:
One-stop shop: You can access and integrate thousands of APIs from various domains and providers, using a single SDK and one API key.
Easy and fast: You can test and debug any API in minutes, and integrate it into your project or application with minimal code.
Free and flexible: You can sign up and use RapidAPI for free, and only pay for the APIs you use. You can also choose from different plans and pricing options for each API.
Cons:
Limited control: You have to rely on the RapidAPI platform and the API providers for the availability, reliability, and quality of the APIs you use. You may not have much control over the updates, changes, or issues of the APIs.
Variable performance: You may experience different levels of performance and latency for different APIs, depending on their location, network, and provider.
Security risks: You have to trust RapidAPI and the API providers with your data and credentials, and ensure that they comply with the relevant regulations and standards.
The pricing of RapidAPI depends on the APIs you use and the plans you choose. Some APIs are free, while others have different tiers and rates based on the number of requests, features, and support you need. You can also use RapidAPI for free for up to 10,000 requests per month, and upgrade to a paid plan if you need more.
9. Graphite
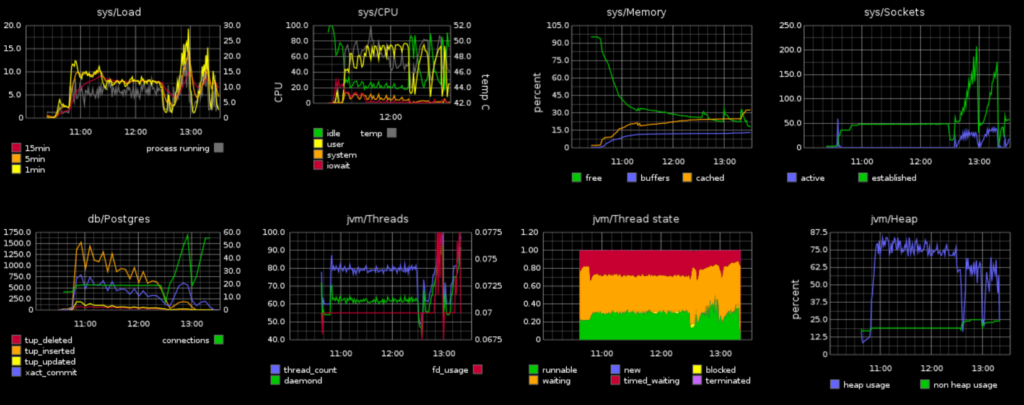
Graphite is an open-source monitoring system that collects and stores metrics from various sources, such as APIs, services, containers, and applications. It is unique in its ability to scrape API data from intermediary pushes for short-lived jobs, and provide a flexible query language and a dimensional data model for analyzing API performance.
Features:
Service discovery: You can automatically discover and configure the targets to monitor, such as APIs, using various methods, such as DNS, Kubernetes, Consul, and more.
Data collection: You can collect metrics from any HTTP endpoint that exposes data in a specific format, such as the Prometheus exposition format. You can also use client libraries or exporters to instrument your own code or expose metrics from third-party services.
Data storage: You can store the collected metrics in a local time series database, and optionally use remote storage adapters to integrate with external systems, such as InfluxDB, Cortex, or Thanos.
Data visualization: You can explore and visualize the stored metrics using a built-in web interface, or use external tools, such as Grafana, to create dashboards and alerts.
Data analysis: You can use the Graphite query language (GraphiteQL) to query and manipulate the metrics, and perform various operations, such as filtering, aggregation, computation, and transformation.
Pros:
Scalable and reliable: You can scale Graphite to handle millions of metrics, and ensure high availability and durability using replication and sharding techniques.
Extensible and integrable: You can extend Graphite with custom components, such as exporters, webhooks, or alert managers, and integrate it with various systems, such as Kubernetes, Grafana, or Alerta.
Free and open-source: You can use Graphite for free, and contribute to its development and improvement as part of a vibrant community.
Cons:
Limited data retention: Graphite is designed for short-term storage of metrics, and does not provide long-term retention or backup options by default. You may need to use external solutions or plugins to achieve this functionality.
Limited data types: Graphite only supports numeric data types, such as counters, gauges, histograms, and summaries. You may not be able to monitor other types of data, such as text, logs, or events, using Graphite.
Complex configuration and maintenance: Graphite requires a lot of configuration and tuning to set up and run, and may not be very user-friendly for beginners or non-technical users. You may also need to update and maintain your Graphite instance regularly to keep up with the latest features and fixes.
The pricing of Graphite is free, as it is an open-source project that does not charge any fees or subscriptions.
10. Prometheus
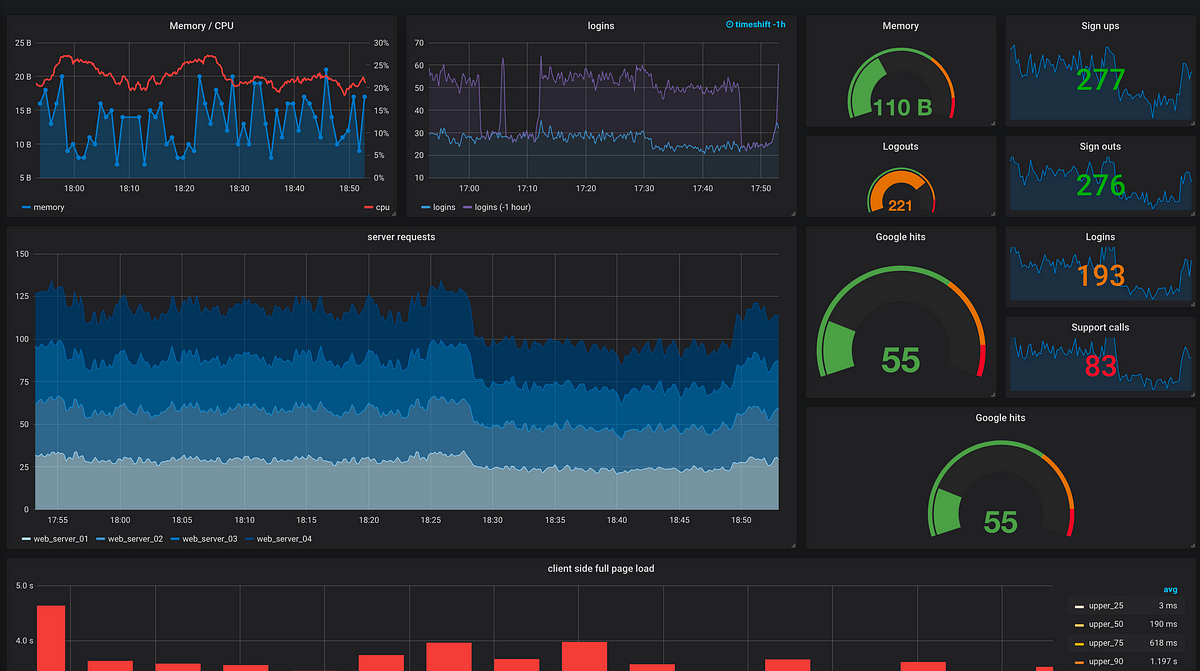
Prometheus is an open-source monitoring system that collects and stores metrics from various sources, such as APIs, services, containers, and applications. It is unique in its ability to scrape API data from intermediary pushes for short-lived jobs, and provide a flexible query language and a dimensional data model for analyzing API performance.
Features:
Service discovery: You can automatically discover and configure the targets to monitor, such as APIs, using various methods, such as DNS, Kubernetes, Consul, and more.
Data collection: You can collect metrics from any HTTP endpoint that exposes data in a specific format, such as the Prometheus exposition format¹. You can also use client libraries or exporters to instrument your own code or expose metrics from third-party services.
Data storage: You can store the collected metrics in a local time series database, and optionally use remote storage adapters to integrate with external systems, such as InfluxDB, Cortex, or Thanos.
Data visualization: You can explore and visualize the stored metrics using a built-in web interface, or use external tools, such as Grafana, to create dashboards and alerts.
Data analysis: You can use the Prometheus query language (PromQL) to query and manipulate the metrics, and perform various operations, such as filtering, aggregation, computation, and transformation.
Pros:
Scalable and reliable: You can scale Prometheus to handle millions of metrics, and ensure high availability and durability using replication and sharding techniques.
Extensible and integrable: You can extend Prometheus with custom components, such as exporters, webhooks, or alert managers, and integrate it with various systems, such as Kubernetes, Grafana, or Alerta.
Free and open-source: You can use Prometheus for free, and contribute to its development and improvement as part of a vibrant community.
Cons:
Limited data retention: Prometheus is designed for short-term storage of metrics, and does not provide long-term retention or backup options by default. You may need to use external solutions or plugins to achieve this functionality.
Limited data types: Prometheus only supports numeric data types, such as counters, gauges, histograms, and summaries. You may not be able to monitor other types of data, such as text, logs, or events, using Prometheus.
Complex configuration and maintenance: Prometheus requires a lot of configuration and tuning to set up and run, and may not be very user-friendly for beginners or non-technical users³. You may also need to update and maintain your Prometheus instance regularly to keep up with the latest features and fixes.
The pricing of Prometheus is free, as it is an open-source project that does not charge any fees or subscriptions.
Key API Metrics To Monitor
API metrics are data points that measure the performance, quality, and value of APIs. They help developers, operators, and business owners to monitor, analyze, and improve API services. There are many types of API metrics, but some of the most important ones are:
Availability: This metric indicates whether an API is up and running, and able to respond to requests. It is usually expressed as a percentage of uptime over a period of time. Availability is a basic measure of reliability and service level agreement (SLA) compliance.
Latency: This metric measures the time it takes for an API to process and return a response to a request. It is usually expressed in milliseconds or seconds. Latency is a key measure of performance and user experience.
Throughput: This metric measures the number of requests that an API can handle in a given time interval. It is usually expressed in requests per second (RPS) or requests per minute (RPM). Throughput is a measure of scalability and capacity.
Error rate: This metric measures the percentage of requests that result in errors, such as 4xx or 5xx HTTP status codes. It is usually expressed as a ratio or a percentage. Error rate is a measure of quality and stability.
Usage: This metric measures the volume and frequency of requests that an API receives from different sources, such as users, applications, or devices. It is usually expressed in terms of requests, users, sessions, or hits. Usage is a measure of adoption and popularity.
Satisfaction: This metric measures the level of satisfaction or dissatisfaction that users have with an API service. It can be derived from various sources, such as ratings, reviews, feedback, or surveys. Satisfaction is a measure of loyalty and retention.
Value: This metric measures the business impact or outcome that an API service generates or supports. It can be derived from various sources, such as revenue, conversions, retention, or referrals. Value is a measure of success and growth.
These are some of the key API metrics that every platform team should be tracking. By monitoring these metrics, you can gain insights into the health, performance, and value of your APIs and identify and resolve any issues or opportunities for improvement. You can also use these metrics to communicate and demonstrate the value of your APIs to your stakeholders and customers.
Conclusion
That concludes the list of the 10 top API monitoring tools. You have to weigh many aspects when selecting the right API monitoring tool for you, and each one has unique requirements. The most helpful suggestion for this scenario is to be patient, investigate thoroughly, and try out as many free plans as possible.
Subscribe to my newsletter
Read articles from Abraham Dahunsi directly inside your inbox. Subscribe to the newsletter, and don't miss out.
Written by

Abraham Dahunsi
Abraham Dahunsi
I enjoy solving problems by writing code and breaking down technical contents by writing.