Debugging session #1: zio-logging & quill
 Pierre Ricadat
In this new series of posts, I will share walkthroughs of debugging sessions I had to do at work to solve real-life problems, in the hope that both the process and the lessons learned will be useful to others working in the Scala ecosystem.
The problem
While we were load testing a new service that will be deployed to production soon, I noticed something odd in the profiler (we use the fantastic Datadog Continuous Profiler both in prod and load test environments; it is always on with minimal performance impact).

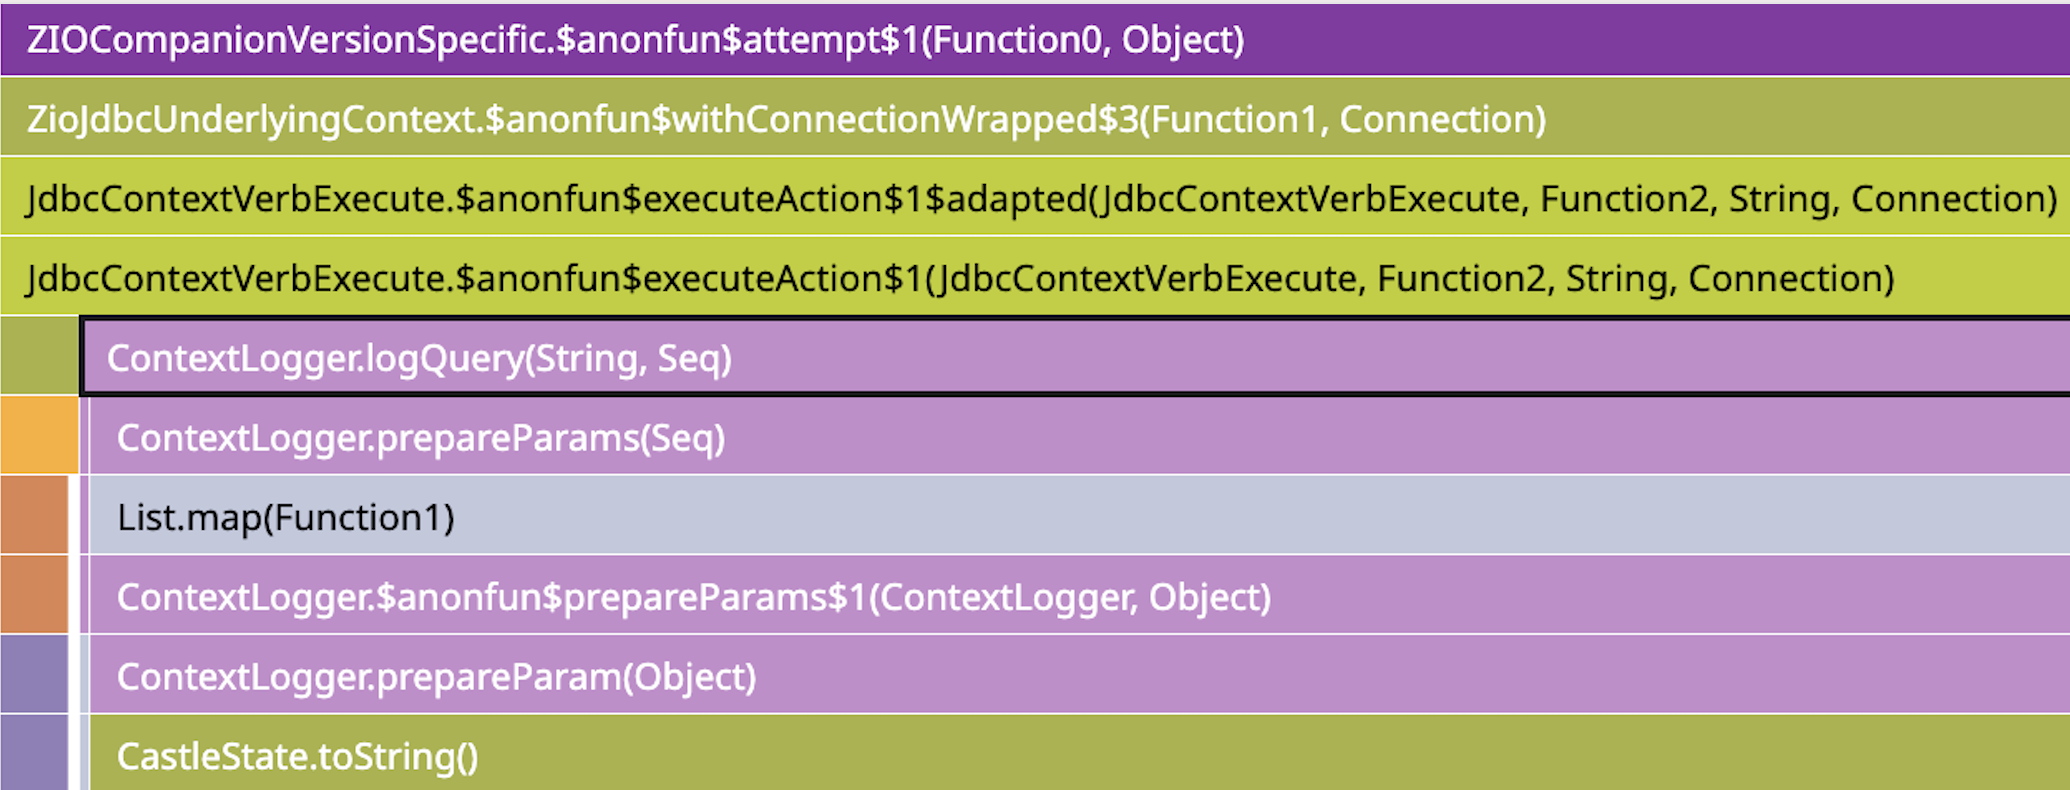
It is spending a lot of time in a function called CastleState.toString(). CastleState is a pretty large domain object that gets written to the database quite often, so it makes sense that computing its toString would be pretty slow. However, there is no call to toString in our code at all. What's happening then?
The investigation
Let's look a little closer to see where that call comes from.

The call originates from ContextLogger.logQuery, which belongs to the Quill library that we use for all database access. Let's examine the logQuery function in detail (here's the code on GitHub):
def logQuery(query: String, params: Seq[Any]): Unit =
  if (!bindsEnabled || params.isEmpty) underlying.debug(query.trimTooLong)
  else {
    underlying.debug("{} - binds: {}", query.trimTooLong, prepareParams(params))
  }
If there are query parameters (params), the code checks the value of bindsEnabled: if true, it logs all parameters (prepareParams is the function that actually calls toString); otherwise, it only logs the SQL query without its parameters.
A quick look at the definition of bindsEnabled:
private def bindsEnabled =
  io.getquill.util.Messages.logBinds ||
    underlying.underlying.isTraceEnabled
It first checks Quill's logBinds option, which is false by default but can be enabled by the user; otherwise, it checks if the current logger is currently logging traces.
However, a quick check of our code showed that:
we didn't modify
logBinds, which should then be falsewe were only logging logs for
Infolevel and higher
Since I couldn't easily insert logs inside Quill's code, I ran the project in debug mode on my machine and put a breakpoint on the call to bindsEnabled to find which of the two conditions was true: it turned out to be isTraceEnabled! The plot thickens...
Let's take a look at where this underlying comes from:
import com.typesafe.scalalogging.Logger
import org.slf4j.LoggerFactory

val underlying: Logger = Logger(LoggerFactory.getLogger(name))
It is good old slf4j, here wrapped by the scala-logging library, something quite common in the Java/Scala ecosystem. I then had a look at the slf4j configuration but... didn't find any.
It turns out we were using ZIO Logging, a library that offers compatibility between ZIO logging (you can simply write ZIO.logDebug(...) in ZIO applications and get a lot of contextual information in your logs) and various logging backends (including slf4j). When using that library, there are 2 options:
the slf4j "backend" will forward all ZIO logs to slf4j: in that case, you configure your logs in the sl4j configuration file
the slf4j "bridge" will forward all slf4j logs to ZIO: in that case, you configure your logs using ZIO loggers
As you may have guessed, since we didn't have any slf4j configuration, we were using the bridge mode. But traces were disabled regardless.
I then took a look at the implementation of the sl4j Logger in the "bridge module" to find this:
@Override
public boolean isTraceEnabled() {
  return true;
}
Yes, isTraceEnabled is hardcoded to true! As are all the similar functions for the other log levels. Is that intentional? Couldn't we simply get the log level from some kind of ZIO configuration?
It's actually not that simple, because ZIO doesn't really let you enable a particular log level; instead, you define a ZLogger that determines how to handle any log coming from ZIO.log. There's an operator called filterLogLevel that can transform a ZLogger into a new one that ignores the given log levels, but it takes a function as a parameter, so there's no way to get the "current log level".
Note that the ZIO.logLevel operator in ZIO is slightly confusing: it doesn't affect what will be logged or not; it only affects what the log level will be when you call ZIO.log without an explicit level.
Here's how you define a logger that will print logs with level Info or higher:
val logger =
  ZLogger
    .default
    .map(println(_))
    .filterLogLevel(_ >= LogLevel.Info)
Even trickier, it is possible to override the ZLogger in a particular scope or block using operators such as ZIO.withLogger and ZIO.withLoggerScoped. Indeed, the value of the current logger is stored in a FiberRef that can be overwritten locally. So not only is there no operator to get the current log level, but it is also contextual. A fiber might be writing everything above Info, while another fiber might be writing Debug logs too.
You might be wondering how the bridge performs when it needs to actually write a log. For the reasons I just mentioned, the bridge has to "inspect" the currently running fiber on the ZIO side in order to create a "runtime" with the proper context and call ZIO.log on it so that it runs the appropriate logger. This operation is not cheap, so it introduces an overhead every time you log something at any level, whether we are filtering them out in the logger or not.
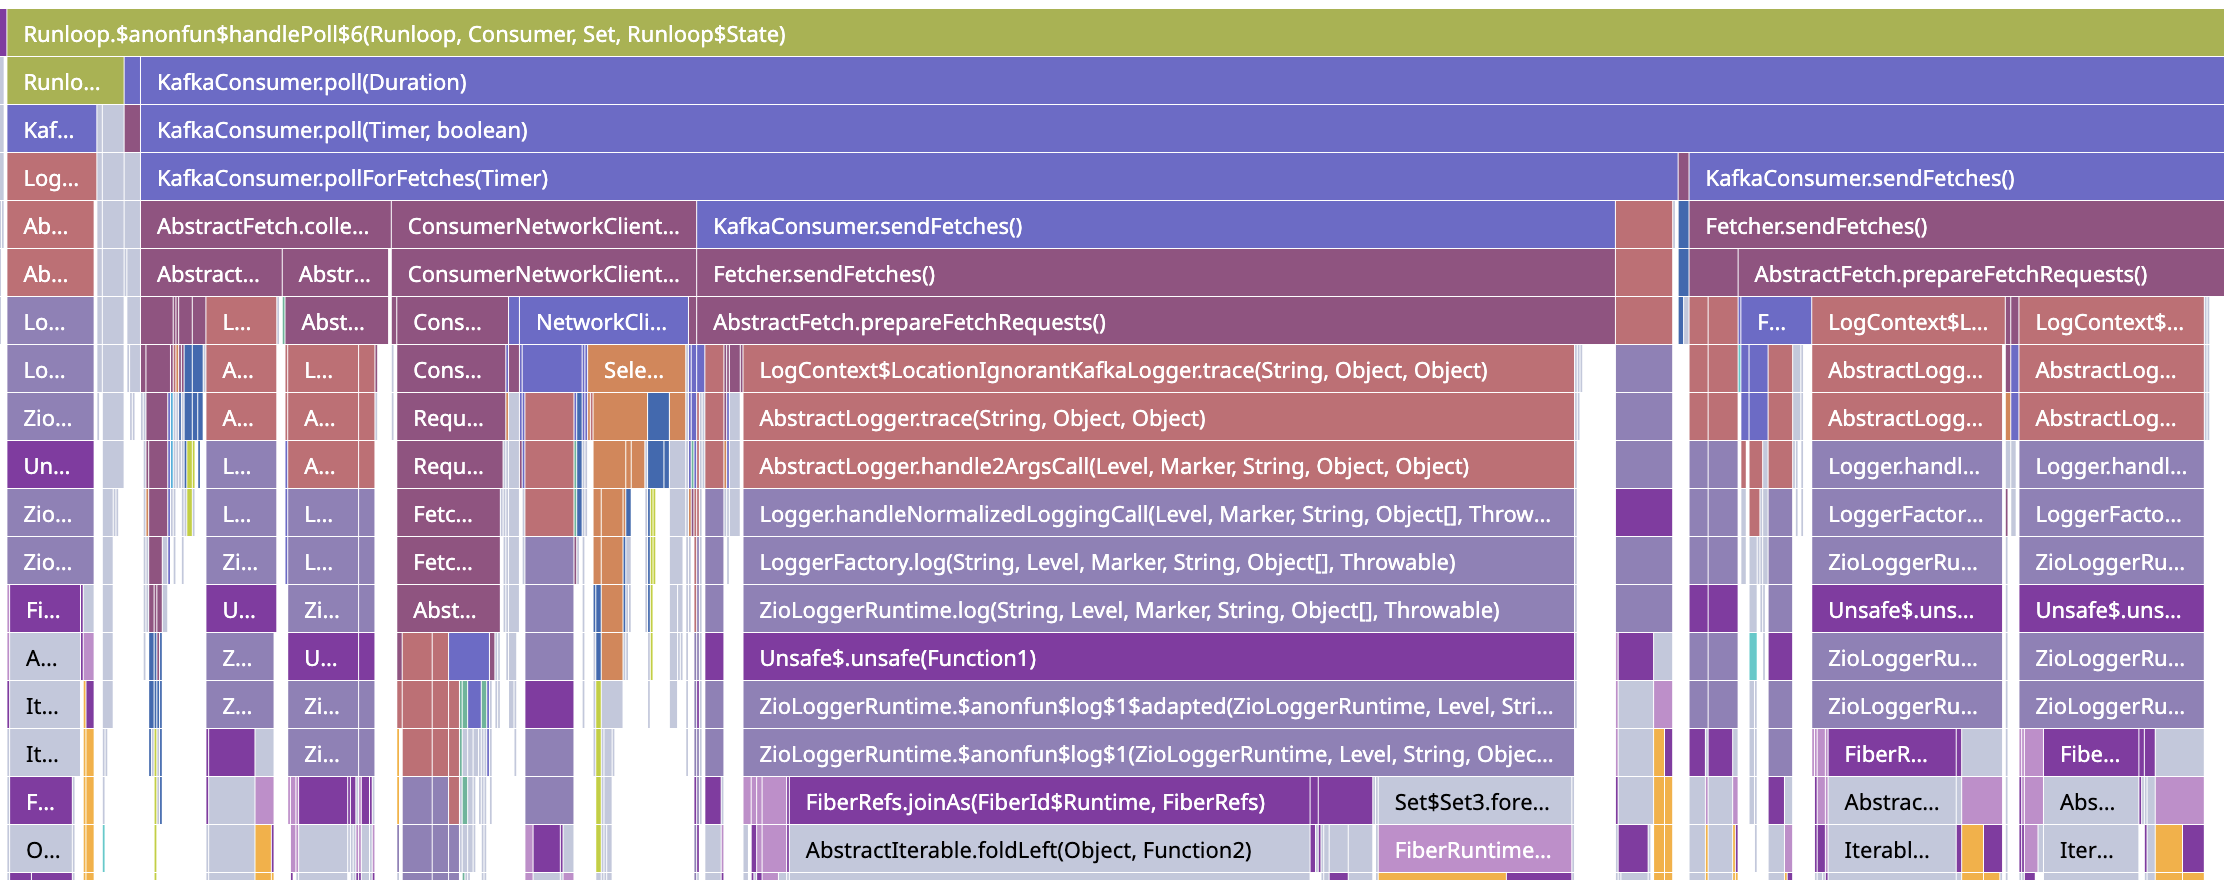
This is quite visible when you use a very verbose Java library such as the official Kafka client. A closer inspection showed the following in our profiler:

As you can see, most of the CPU used inside the Kafka poll function is actually spent logging, particularly in ZIOLoggerRuntime, which is the code that tries to recover the current fiber context. Because Kafka is very verbose at trace and debug levels, and because the bridge forwards ALL logs to ZIO.log and lets the ZIO logger do the filtering, we end up with a situation like this.
Takeaways
I did open an issue on the zio-logging repo to raise the problem of enabling all log levels and the potential hidden cost it has with libraries like Quill that rely on these boolean functions to avoid expensive operations. However, for the reasons we just saw, it seems unlikely that a perfect solution will emerge that can both be consistent with the "current" ZIO logger and have minimal performance impact. At best, I think it is possible to define a fixed list of log levels we want to enable when we set up the bridge and disable the rest to short-circuit them.
In conclusion, I would recommend to anyone using zio-logging in performance-sensitive applications to prefer the simple slf4j module that redirects ZIO logs to slf4j rather than the slf4j-bridge. If you don't care much about performance, using the bridge to have everything configured on the ZIO side is a completely reasonable option.
That's it for today, I hope this was interesting. See you next time for another debugging session!
Subscribe to my newsletter
Read articles from Pierre Ricadat directly inside your inbox. Subscribe to the newsletter, and don't miss out.
Written by

Pierre Ricadat
Pierre Ricadat
Software Architect | Scala Lover | Creator of Caliban and Shardcake