Javascript Debugging -m "commit to memory"
 Seth Spring
Intro - First Post
Hello there, fellow devs! My name is Seth Spring and I am on a transformative journey attending a full-stack BootCamp courtesy of Flatiron School in New York City. As I navigate through each intensive 3-week phase I will reflect on our teachings, or explore concepts I found valuable during the lessons which may not have been covered deeply enough with the pace of the courses.
In this inaugural blog post, I'm excited to explore the concept that forms the foundation of software development: debugging. I'll be focusing on both Visual Studio Code (VS Code) and debugging in the console. Since I've had the privilege of coding for a mere 2 weeks, this blog post is tailored for true beginners.
What is debugging?
Debugging is the process of identifying and resolving errors, defects, or unexpected behavior in code. It involves examining the code, identifying the root cause of the issue, and implementing a solution to fix it. There are several methods for debugging but we will be working specifically with the integrated debugger in VS Code for Javascript. Debugging is an essential skill for software developers and allows us to diagnose and fix issues efficiently.
Scenario
Our cohort consists mostly of first-time coders, and through our labs, I continuously observed the following while writing javascript functions:
Write down lines upon lines of
consts,lets,functions()to satisfy the requirements of our labs; attempting to pass multiple tests at once.console.log()to verify results of the code.Receive countless errors: ReferenceErrors, Undefined, SyntaxErrors, etc.
Manually backtrack with trial and error to see which lines were breaking our code.
Methodology
In VS Code on the left side of your window click on the the bug with play button icon which will open a debug tab. For this to work, the application will need to be running on a live local server. You can click on the "Go Live" button on the bottom right of your VS Code window to run this. Chrome will open up your page in a new tab. With that in place click on "run and debug" back in VS Code and it will ask which environment you want to run; for my purposes I use Chrome. It will output a configured JSON file which stays inside of your project. Within the launch.json file that has been created, navigate to the URL key within the object and change to your local host (port); mine looks like this "HTTP://localhost:5500". Save, and hit the play button on the top left of your VS Code window to trigger the debugging instance which will launch and setup the debugger.
Note
launch.json file.Now that this is set we will create 'breakpoints' inside of VS Code. Within your .js file, the breakpoints can be set by hovering to the left of your lines of code per the image below.

Breakpoints are "an intentional stopping or pausing place in a program, put in place for debugging purposes." when testing your code, it will automatically stop at the placed breakpoint so you can inspect the variables on that line.

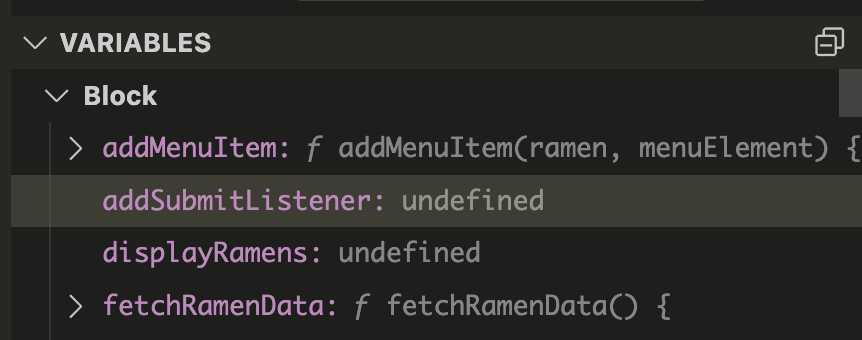
Once the breakpoints are established, go ahead and test your code and it will run until it hits the set breakpoints. You will see the debugger tab populate with several boxes on the left hand side of the VS Code window. The beauty of this happens in the 'VARIABLES' tab. It will show Global, Local, and Block variables to hone in on issues that may be causing errors in the code. This allows you to inspect your variables, especially as the DOM elements change; such as submitting a form, or uploading an image.

A debug toolbar will appear on the top of your editor with several options: Continue/Pause, Step Over, Step Into, Step Out, Restart, and Stop/Disconnect. Use these options to progress through your breakpoints and inspect line by line and cleanup your code.
There is a huge advantage to using true debugging with the debugging tool opposed to console logging console.log() as you can see changing elements and variables in real-time with this tool.
Debugging in the Console
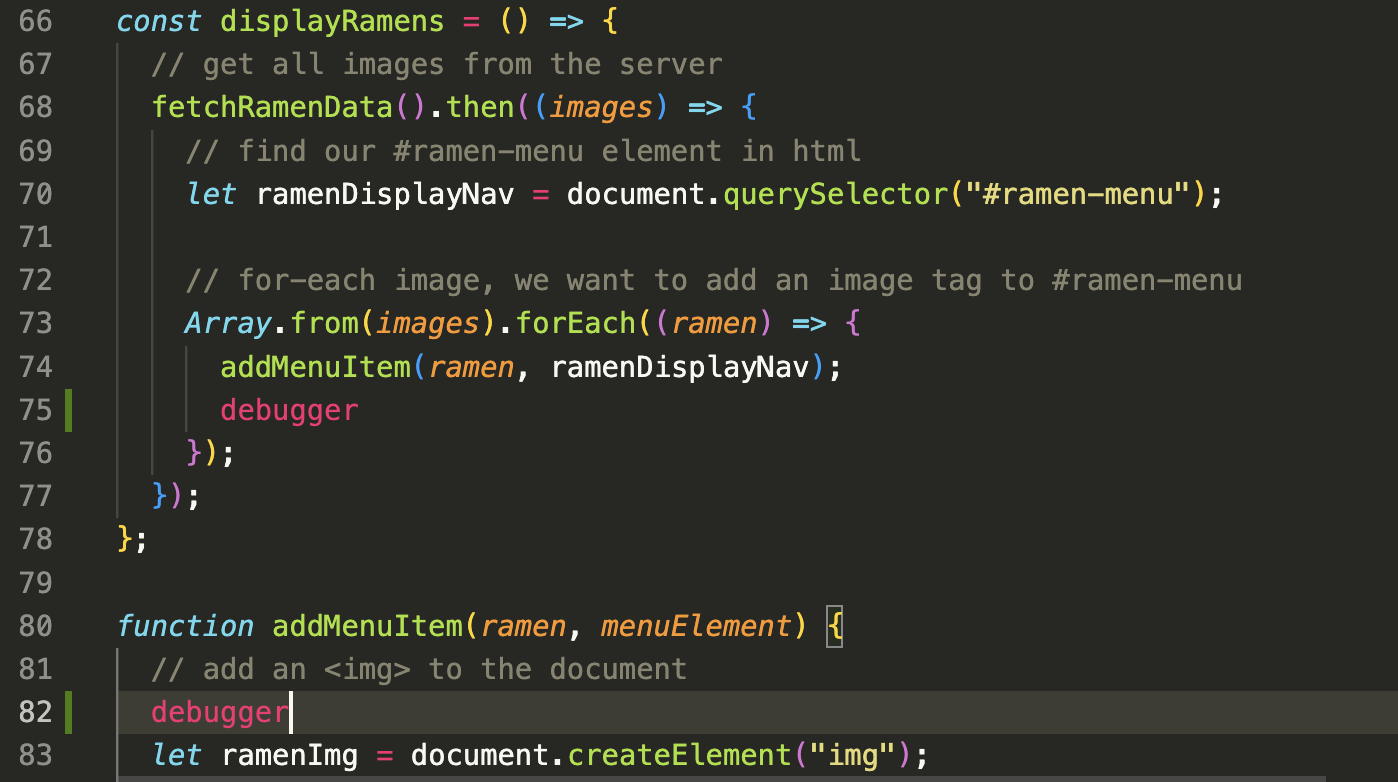
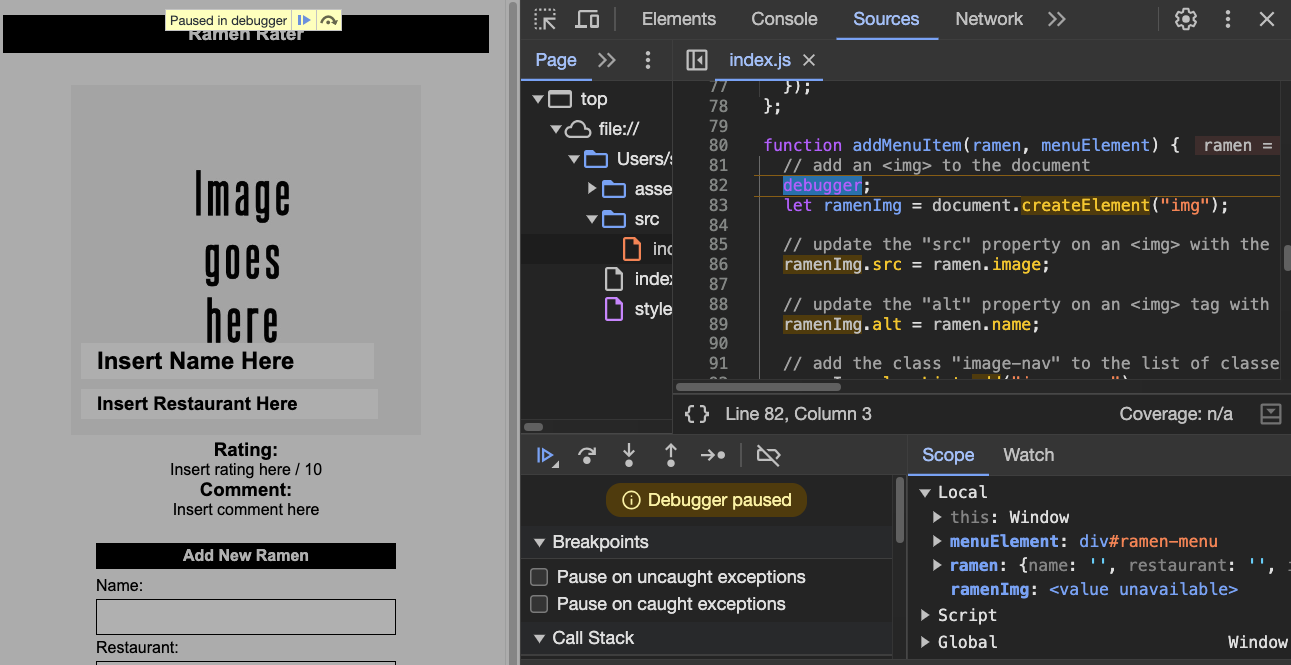
For simpler applications or ones that do not have a live local server, there is also the option of placing debugger statements inside of your code which will act as a breakpoint. The behavior will be the same, but the breakpoints are being set by the statement debugger and run inside your developer console within your browser; allowing DOM manipulation.

A debugging toolbar will also display within your browser, but will only mirror the "Continue/Pause" and "Step Over" options to inspect your breakpoints. The toolbar will still function in the exact same manner; allowing you to control the execution flow, inspect variables, and interact with breakpoints.

Final Words
The art of debugging is an essential skill for all software developers. By leveraging the power of debugging available in the environment of your choice, you can efficiently identify and resolve errors in your code. Remember, debugging is not about fixing errors in your code, it's also about understanding how your code works and becoming a more proficient developer overall. As I enter week three of Flatiron, I'm continuously learning new concepts, methods, syntax, & functionality, but the power of debugging is the innate habit that I'm focusing on no matter the language I end up excelling in.
Sources
Wikipedia - Breakpoint - https://en.wikipedia.org/wiki/Breakpoint#:~:text=In%20software%20development%2C%20a%20breakpoint,referred%20to%20as%20a%20pause.
Visual Studio - Debugging in VS Code - https://code.visualstudio.com/docs/editor/debugging
Chrome - Debug JavaScript - https://developer.chrome.com/docs/devtools/javascript
W3Schools - JavaScript Debugging - https://www.w3schools.com/js/js_debugging.asp
Subscribe to my newsletter
Read articles from Seth Spring directly inside your inbox. Subscribe to the newsletter, and don't miss out.
Written by
