Maximizing Insights with Cloud Intelligence Dashboards
 Abhiraj Kharbade
Table of contents
- Real-time Visibility
- Customizable Metrics
- Cost Optimization
- Automated Alerts
- Benefits of AWS Cloud Intelligence Dashboards
- Best Practices for AWS Cloud Intelligence Dashboards
- Key Features of AWS Cloud Intelligence Dashboards
- Benefits of AWS Cloud Intelligence Dashboards
- Available Dashboards
- Advanced Dashboards:
- Additional Dashboards:
- Deployment Process of AWS Cloud Intelligence Dashboards
- Setup Permissions:
- Deployment Architecture:
- Deployment Steps:
In the dynamic landscape of cloud computing, businesses are increasingly relying on advanced tools to harness the power of data for strategic decision-making. One such pivotal component is the Cloud Intelligence Dashboard on Amazon Web Services (AWS). This sophisticated solution empowers organizations to gain real-time insights, optimize performance, and drive innovation. Let's delve into the key features, benefits, and best practices of leveraging AWS Cloud Intelligence Dashboards.
Real-time Visibility
AWS Cloud Intelligence Dashboards revolutionize the way organizations monitor and manage their cloud resources. Offering real-time visibility into the performance of various AWS services, these dashboards empower users to stay ahead of potential issues. Through dynamic visualizations and customizable widgets, users can monitor key performance indicators, resource utilization, and other critical metrics, allowing for proactive decision-making.
Customizable Metrics
The versatility of AWS Cloud Intelligence Dashboards lies in their ability to cater to the unique needs of each organization. Users can customize their dashboards by selecting from a rich array of metrics spanning compute, storage, networking, and application performance. This adaptability ensures that the dashboard aligns seamlessly with specific business objectives, providing a tailored and comprehensive view of the cloud environment.
Cost Optimization
Efficient cost management is a perpetual concern for businesses operating in the cloud. AWS Cloud Intelligence Dashboards address this challenge by offering detailed insights into resource costs. Through visualizations of cost trends, users can identify areas of overspending, optimize resource allocation, and implement cost-saving measures. This proactive approach to cost optimization is instrumental in ensuring the economic efficiency of cloud operations.
Automated Alerts
The proactive nature of AWS Cloud Intelligence Dashboards extends to automated alerting. Users can set up alerts based on predefined thresholds, enabling the system to notify stakeholders of any anomalies or potential issues. This feature empowers organizations to respond swiftly to performance deviations, minimizing downtime, and maintaining a robust and resilient cloud infrastructure.
Benefits of AWS Cloud Intelligence Dashboards
Improved Decision-Making
The consolidated view provided by AWS Cloud Intelligence Dashboards serves as a central hub for decision-makers. By presenting critical data in a coherent manner, these dashboards facilitate informed decision-making. Whether addressing performance bottlenecks, scaling resources, or optimizing configurations, decision-makers can rely on real-time insights to drive the business forward.
Enhanced Collaboration
AWS Cloud Intelligence Dashboards foster collaboration among cross-functional teams. By providing a shared platform for monitoring and analysis, these dashboards break down silos that often hinder collaboration. Teams can work seamlessly together, leveraging the same set of metrics and visualizations to address challenges, troubleshoot issues, and optimize performance collaboratively.
Scalability and Flexibility
The scalability and flexibility of AWS Cloud Intelligence Dashboards make them suitable for organizations of all sizes. Whether a startup with modest cloud usage or an enterprise with a complex and diverse infrastructure, these dashboards can adapt to evolving needs. The consistent and reliable monitoring solution ensures that as businesses grow, their dashboards grow with them, providing a scalable and future-proof solution.
Best Practices for AWS Cloud Intelligence Dashboards
Define Key Metrics
Successful implementation of AWS Cloud Intelligence Dashboards begins with a clear understanding of the key metrics relevant to the organization's goals. By identifying and prioritizing these metrics, users can ensure that the dashboard delivers actionable insights without overwhelming users with unnecessary information.
Implement Role-Based Access Control
Security and compliance are paramount in cloud environments. AWS Cloud Intelligence Dashboards integrate seamlessly with AWS Identity and Access Management (IAM), allowing organizations to implement role-based access control. This ensures that team members have appropriate levels of access, maintaining the confidentiality and integrity of sensitive data.
Regularly Review and Refine
The dynamic nature of cloud environments necessitates regular reviews of dashboard configurations, metrics, and alerts. By periodically assessing the relevance and effectiveness of the dashboard components, organizations can refine and optimize their monitoring strategy, ensuring that the dashboard remains aligned with evolving business requirements and objectives.
Key Features of AWS Cloud Intelligence Dashboards
AWS Cloud Intelligence Dashboards revolutionize the way organizations monitor and manage their cloud resources. Offering real-time visibility into the performance of various AWS services, these dashboards empower users to stay ahead of potential issues. Through dynamic visualizations and customizable widgets, users can monitor key performance indicators, resource utilization, and other critical metrics, allowing for proactive decision-making.
The versatility of AWS Cloud Intelligence Dashboards lies in their ability to cater to the unique needs of each organization. Users can customize their dashboards by selecting from a rich array of metrics spanning compute, storage, networking, and application performance. This adaptability ensures that the dashboard aligns seamlessly with specific business objectives, providing a tailored and comprehensive view of the cloud environment.
Efficient cost management is a perpetual concern for businesses operating in the cloud. AWS Cloud Intelligence Dashboards address this challenge by offering detailed insights into resource costs. Through visualizations of cost trends, users can identify areas of overspending, optimize resource allocation, and implement cost-saving measures. This proactive approach to cost optimization is instrumental in ensuring the economic efficiency of cloud operations.
The proactive nature of AWS Cloud Intelligence Dashboards extends to automated alerting. Users can set up alerts based on predefined thresholds, enabling the system to notify stakeholders of any anomalies or potential issues. This feature empowers organizations to respond swiftly to performance deviations, minimizing downtime, and maintaining a robust and resilient cloud infrastructure.
Benefits of AWS Cloud Intelligence Dashboards
The consolidated view provided by AWS Cloud Intelligence Dashboards serves as a central hub for decision-makers. By presenting critical data in a coherent manner, these dashboards facilitate informed decision-making. Whether addressing performance bottlenecks, scaling resources, or optimizing configurations, decision-makers can rely on real-time insights to drive the business forward.
AWS Cloud Intelligence Dashboards foster collaboration among cross-functional teams. By providing a shared platform for monitoring and analysis, these dashboards break down silos that often hinder collaboration. Teams can work seamlessly together, leveraging the same set of metrics and visualizations to address challenges, troubleshoot issues, and optimize performance collaboratively.
The scalability and flexibility of AWS Cloud Intelligence Dashboards make them suitable for organizations of all sizes. Whether a startup with modest cloud usage or an enterprise with a complex and diverse infrastructure, these dashboards can adapt to evolving needs. The consistent and reliable monitoring solution ensures that as businesses grow, their dashboards grow with them, providing a scalable and future-proof solution.
Available Dashboards
AWS Cloud Intelligence Dashboards offer a diverse range of dashboards tailored to different organizational needs, providing actionable insights and optimization opportunities across various aspects of cloud management:
Foundational Dashboards:
a. CUDOS Dashboard (Cost and Usage Dashboard for Operational Savings):
Audience: Product Owners, Finance, FinOps, DevOps, Engineering teams.
Description: The CUDOS Dashboard provides high-level operational insights and cost optimization recommendations. It offers auto-generated recommendations and actionable insights, allowing users to quickly identify cost-saving opportunities and optimize resource usage. With drill-down capabilities to resource-level granularity, this dashboard empowers teams to uncover uncertainties in AWS usage and make informed decisions.
Features: Auto-generated cost optimization recommendations, operational insights, drill-down capabilities, highlighting of particular resources for optimization.
b. Cost Intelligence Dashboard (CID):
Audience: Executives, Finance/Procurement.
Description: The CID is a customizable and accessible dashboard designed to help create the foundation for cost management and optimization. It caters to executives, directors, and individuals managing cloud financials, requiring little to no technical knowledge of AWS services. The dashboard provides easy-to-use tools relevant to their specific use cases, facilitating financial accountability and cost optimization efforts.
Features: Customizable dashboard, accessible to non-technical users, relevant tools for cost management and optimization.
c. KPI and Modernization Dashboard:
Audience: Product Owners, Finance, FinOps, DevOps, Engineering teams.
Description: The KPI and Modernization Dashboard aligns DevOps, IT infrastructure, Finance, and the C-Suite to track modernization and optimization goals effectively. It enables organizations to set and monitor usage goals, such as OnDemand and Spot adoption, facilitating efficient growth and innovation on AWS. The dashboard empowers every line of business to track usage goals while providing recommendations organization-wide.
Features: Tracking of modernization and optimization goals, organization-wide recommendations, goal-setting capabilities.
Advanced Dashboards:
a. Trusted Advisor Organizational (TAO) Dashboard:
Audience: Product Owners, FinOps, DevOps, Engineering, SRE, Security teams.
Description: The TAO Dashboard provides visibility into cost optimization opportunities, auto-identified idle resources, and AWS Trusted Advisor risks across Security, Reliability, and Performance pillars. It offers historical trends for tracking optimization results, enabling teams to make informed decisions based on past performance.
Features: Visibility into optimization opportunities and risks, historical trend analysis, cross-pillar insights.
b. Compute Optimizer Dashboard (COD):
Audience: Product Owners, FinOps, DevOps, Engineering teams.
Description: The COD helps organizations visualize and trace right-sizing recommendations from AWS Compute Optimizer. It identifies cost savings opportunities by highlighting over-provisioned resources and operational risks from under-provisioned ones. By providing actionable insights, the dashboard enables efficient resource allocation and optimization.
Features: Visualization of right-sizing recommendations, identification of cost-saving opportunities, operational risk assessment.
c. Cost Anomaly Dashboard (CAD):
Audience: Product Owners, FinOps, DevOps, Engineering teams.
Description: The CAD helps track and visualize findings from AWS Cost Anomaly Detection. It enables users to identify and address cost anomalies effectively, ensuring cost efficiency and optimization. By providing visualizations of anomalies, the dashboard facilitates proactive cost management strategies.
Features: Visualization of cost anomalies, proactive cost management capabilities.
Additional Dashboards:
a. Trends Dashboard:
Audience: Executives, Finance/Procurement.
Description: The Trends Dashboard provides financial and technology leaders with access to proactive trends, signals, insights, and anomalies for analyzing AWS cloud usage. It enables organizations to understand usage patterns and make data-driven decisions to optimize costs and performance effectively.
Features: Access to proactive trends and insights, anomaly detection capabilities, data-driven decision-making tools.
b. Sustainability Proxy Metrics Dashboard:
Audience: Product Owners, FinOps, DevOps, Engineering teams.
Description: The Sustainability Proxy Metrics Dashboard helps organizations reduce their sustainability impact by making changes to their AWS infrastructure. It shows resource usage in key areas defined in the Sustainability Pillar of the Well Architected Framework, enabling the implementation of impact-aware architectures and business metrics.
Features: Visualization of sustainability metrics, impact-aware architecture implementation tools.
c. Cloud Intelligence Dashboard for Azure (CID for Azure):
Audience: Executives, Finance/Procurement, FinOps, Product Owners.
Description: The CID for Azure solution allows organizations to create Azure cost visualizations and reports in Amazon QuickSight. It enables cross-cloud cost analysis and optimization, providing executives and finance teams with comprehensive insights into cloud spending across multiple platforms.
Features: Cross-cloud cost visualizations, integration with Amazon QuickSight, comprehensive cost analysis capabilities.
Deployment Process of AWS Cloud Intelligence Dashboards
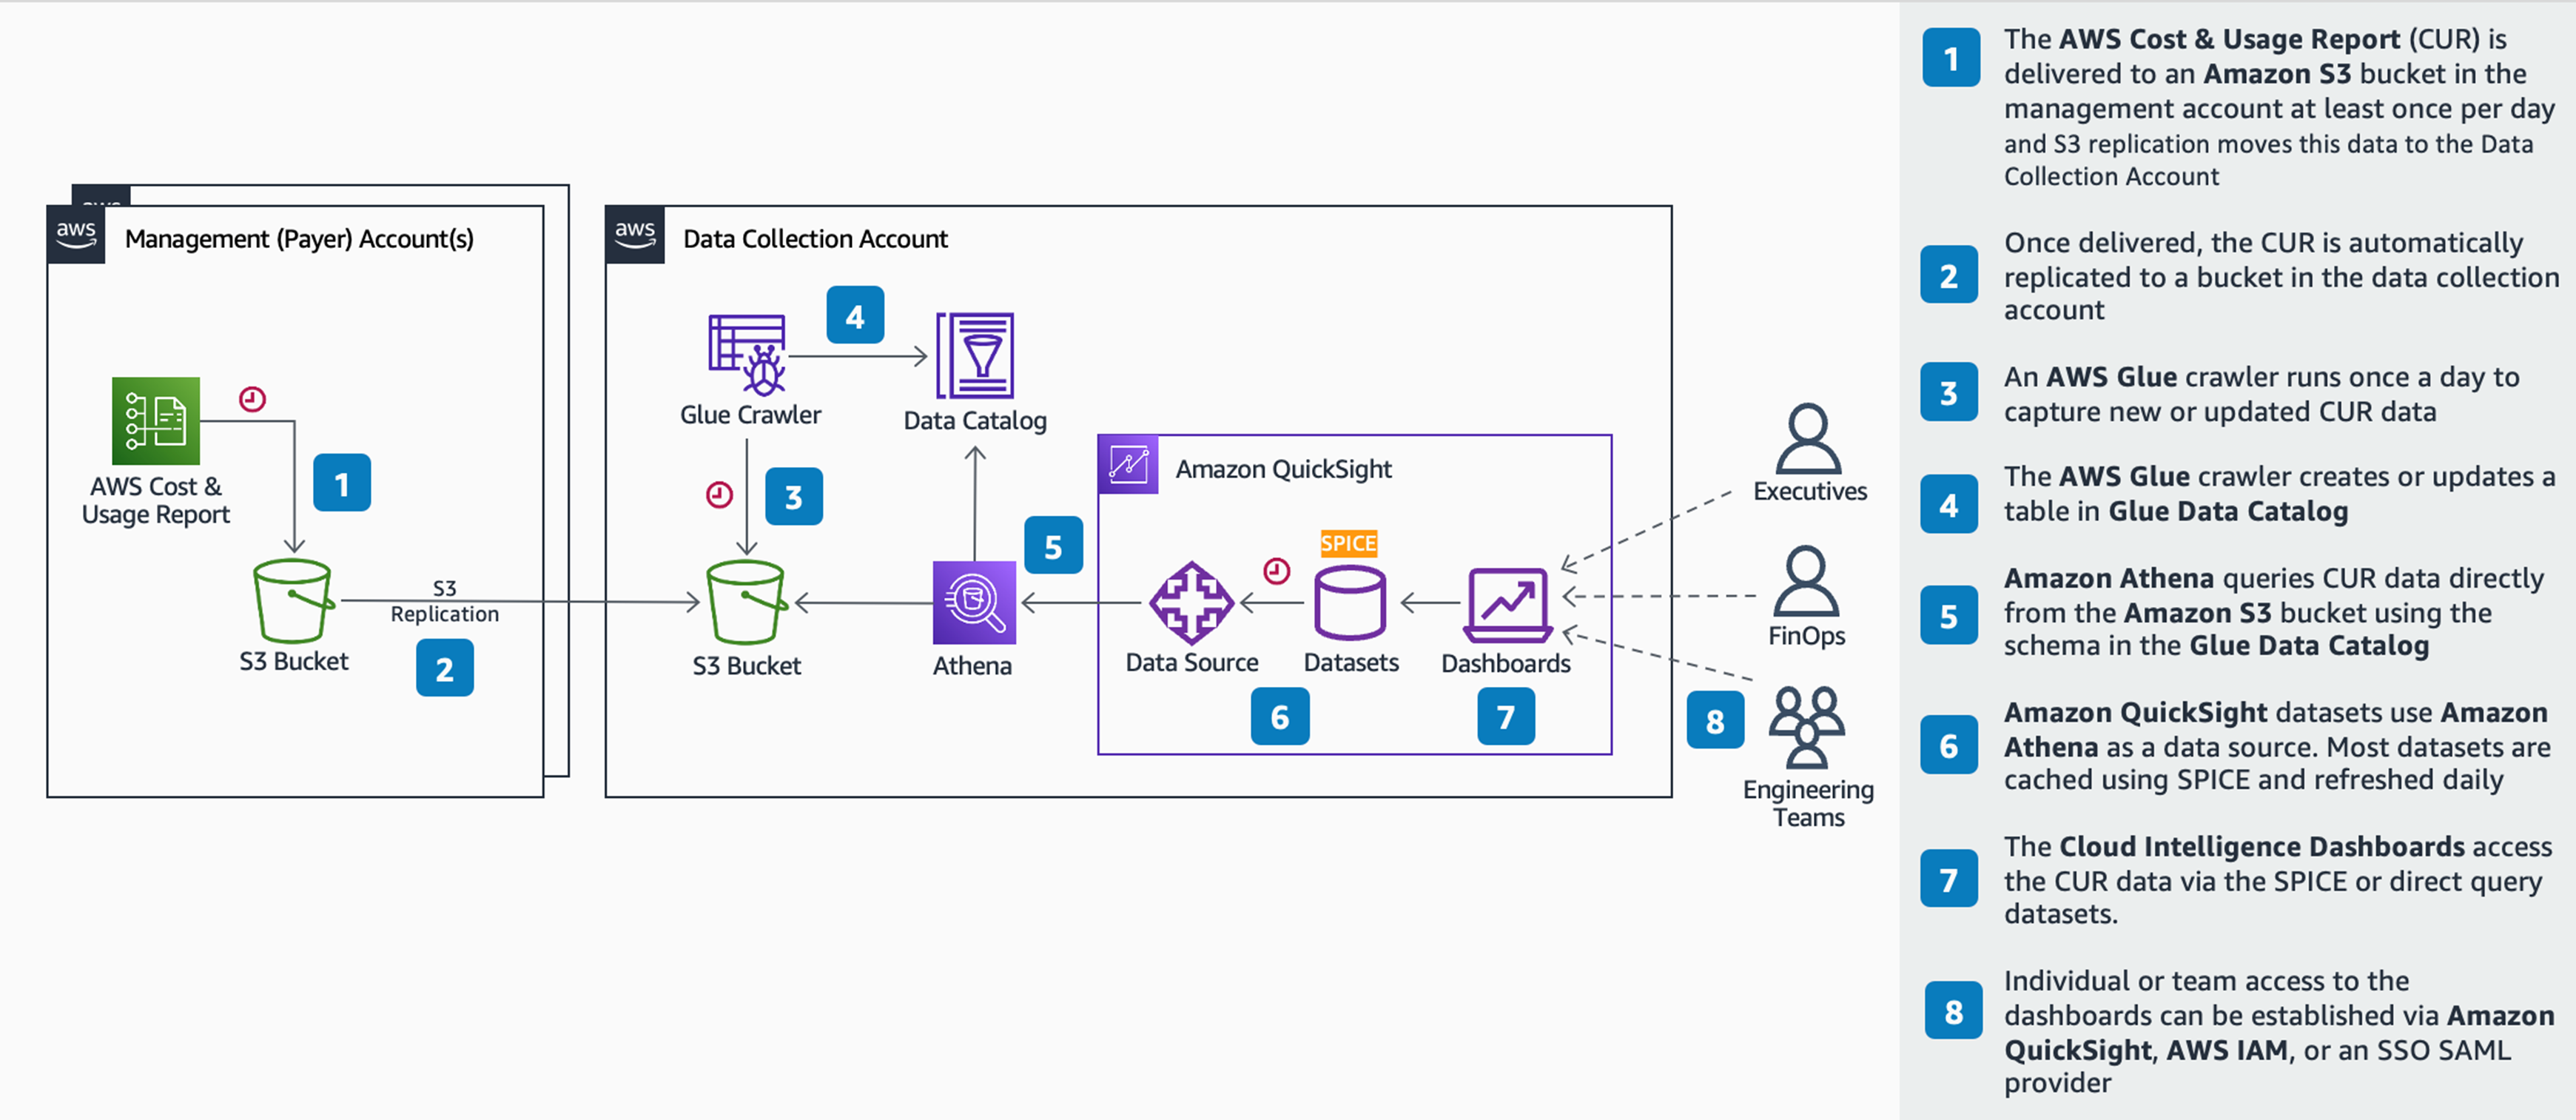
Deploying AWS Cloud Intelligence Dashboards involves a systematic process to ensure seamless integration and optimal performance. Below is a detailed breakdown of the deployment process:
Setup Permissions:
Management/Payer Account Permissions: Ensure that appropriate permissions are granted in the Management/Payer Account to access AWS services required for data collection, processing, and visualization. This includes permissions for AWS CloudFormation, AWS Cost & Usage Reports, AWS IAM, AWS Lambda, and Amazon S3.
- Data Collection Account Permissions: Similarly, in the Data Collection Account, grant permissions for accessing Amazon Athena, AWS CloudFormation, AWS Directory Service, Amazon EventBridge, AWS Glue, AWS IAM, AWS Lambda, Amazon QuickSight, and Amazon S3 via both the console and the Command Line Tool.
Deployment Architecture:
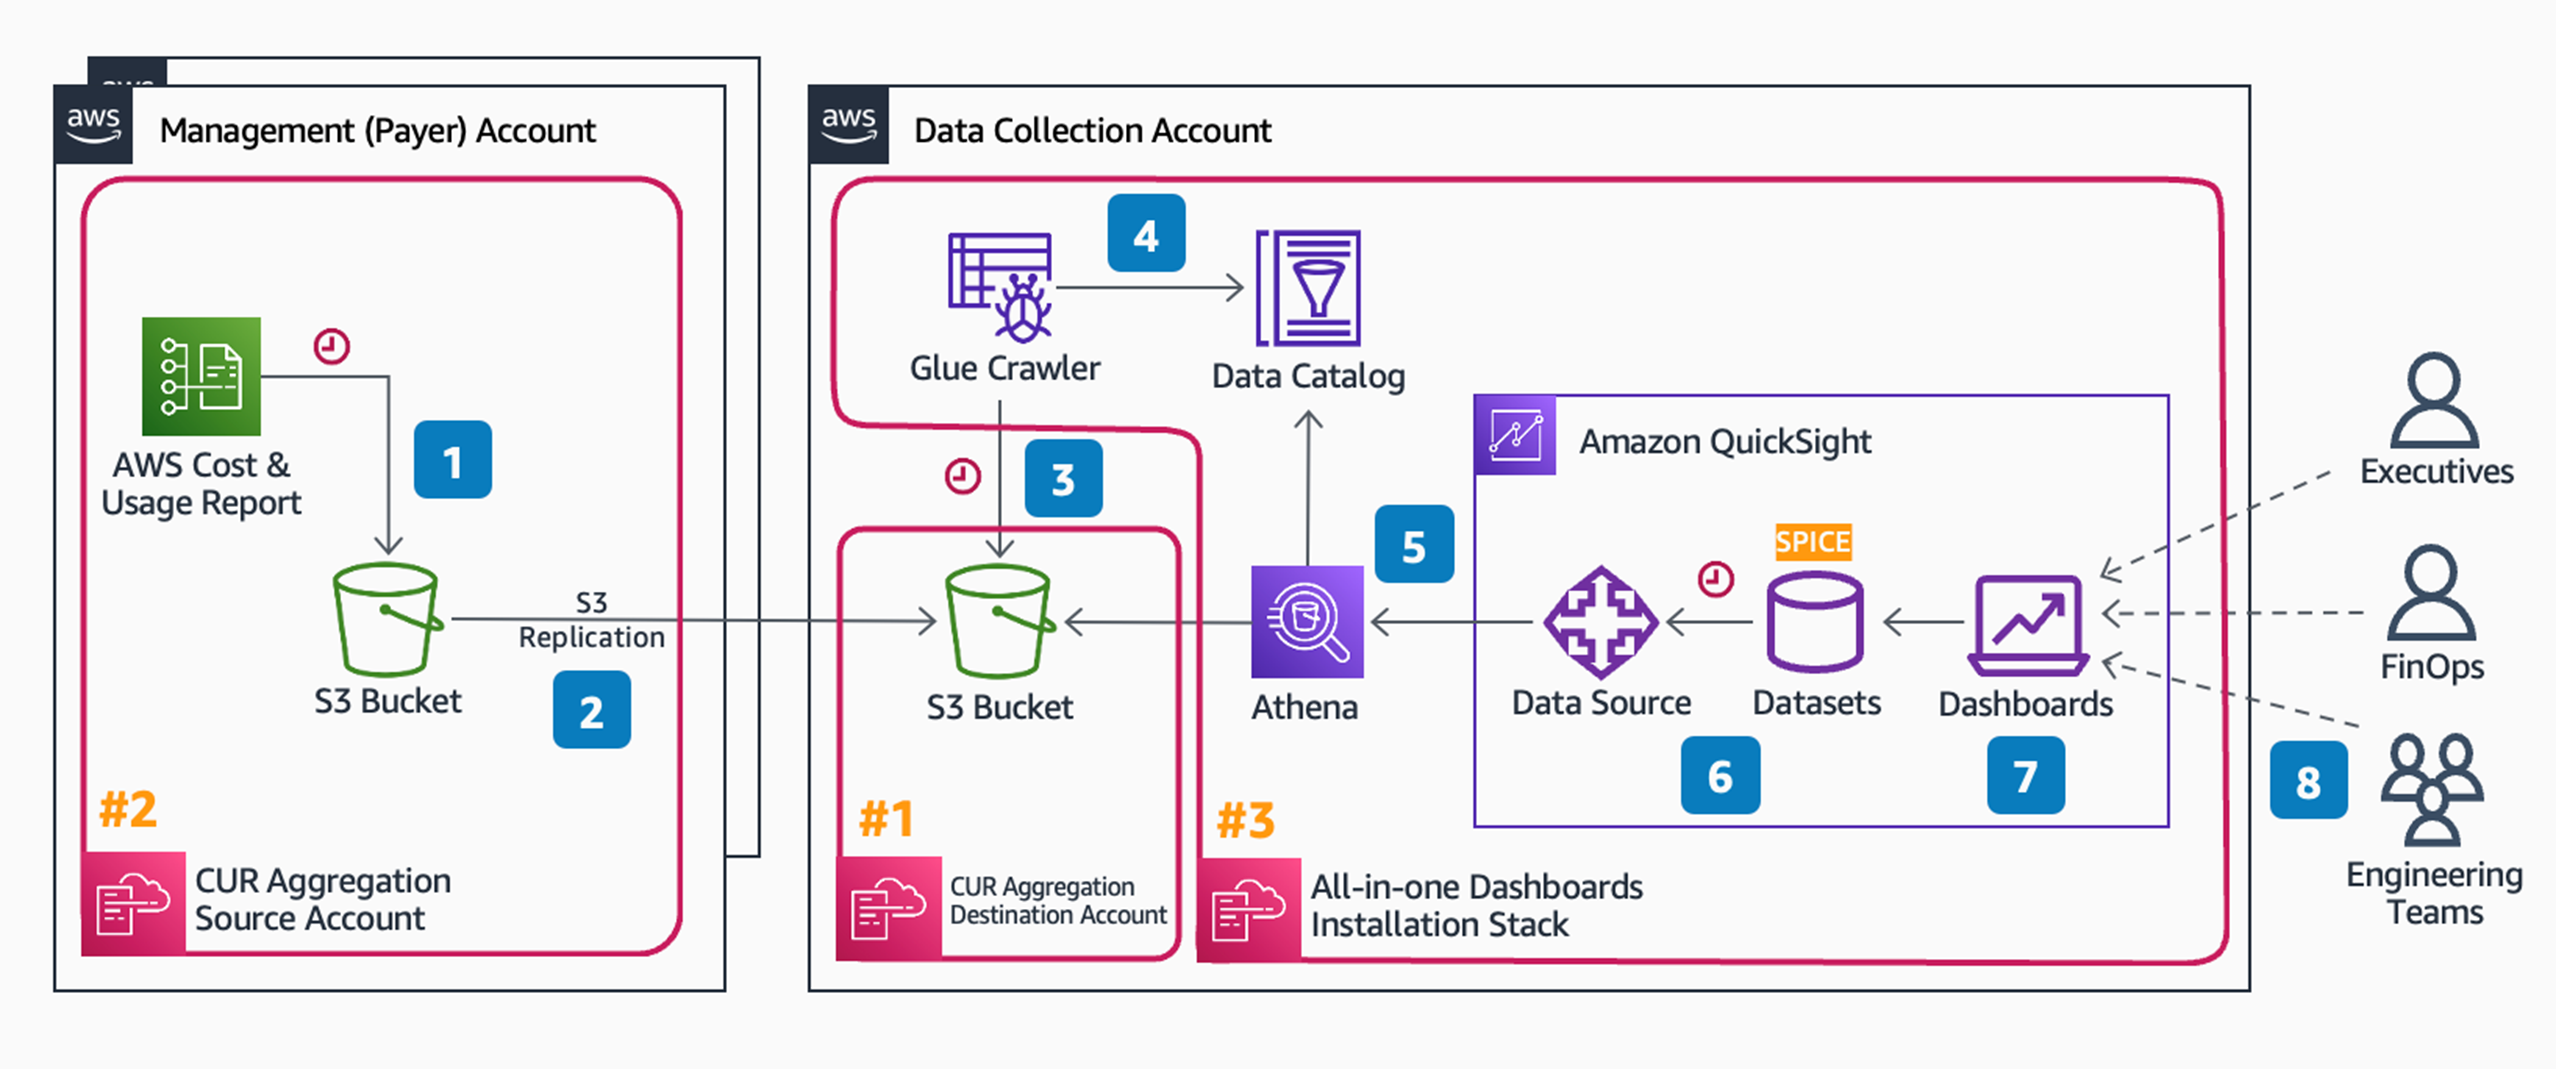
Follow a recommended deployment architecture that involves aggregating AWS Cost & Usage Reports (CURs) from multiple sources into a dedicated Data Collection Account.
- This architecture supports centralized monitoring and analysis across multiple Management (Payer) Accounts or linked accounts.
Deployment Steps:
Deployment Process for AWS Cloud Intelligence Dashboards
The deployment process for AWS Cloud Intelligence Dashboards involves several steps to ensure seamless integration and optimal performance. Below is a detailed guide on how to deploy these dashboards effectively:
Step 1: Deploy a Bucket for Aggregated CUR in the Data Collection Account
In this step, you will set up a bucket in the Data Collection Account for aggregating Cost and Usage Reports (CURs). Follow these steps:
Log into the Data Collection Account in the desired Region.
Click the Launch Stack button provided to open the pre-populated CloudFormation template in your CloudFormation console.
Select the Region where you want to deploy your resources.
Enter your Data Collection Account ID (the current account where the dashboards will be deployed).
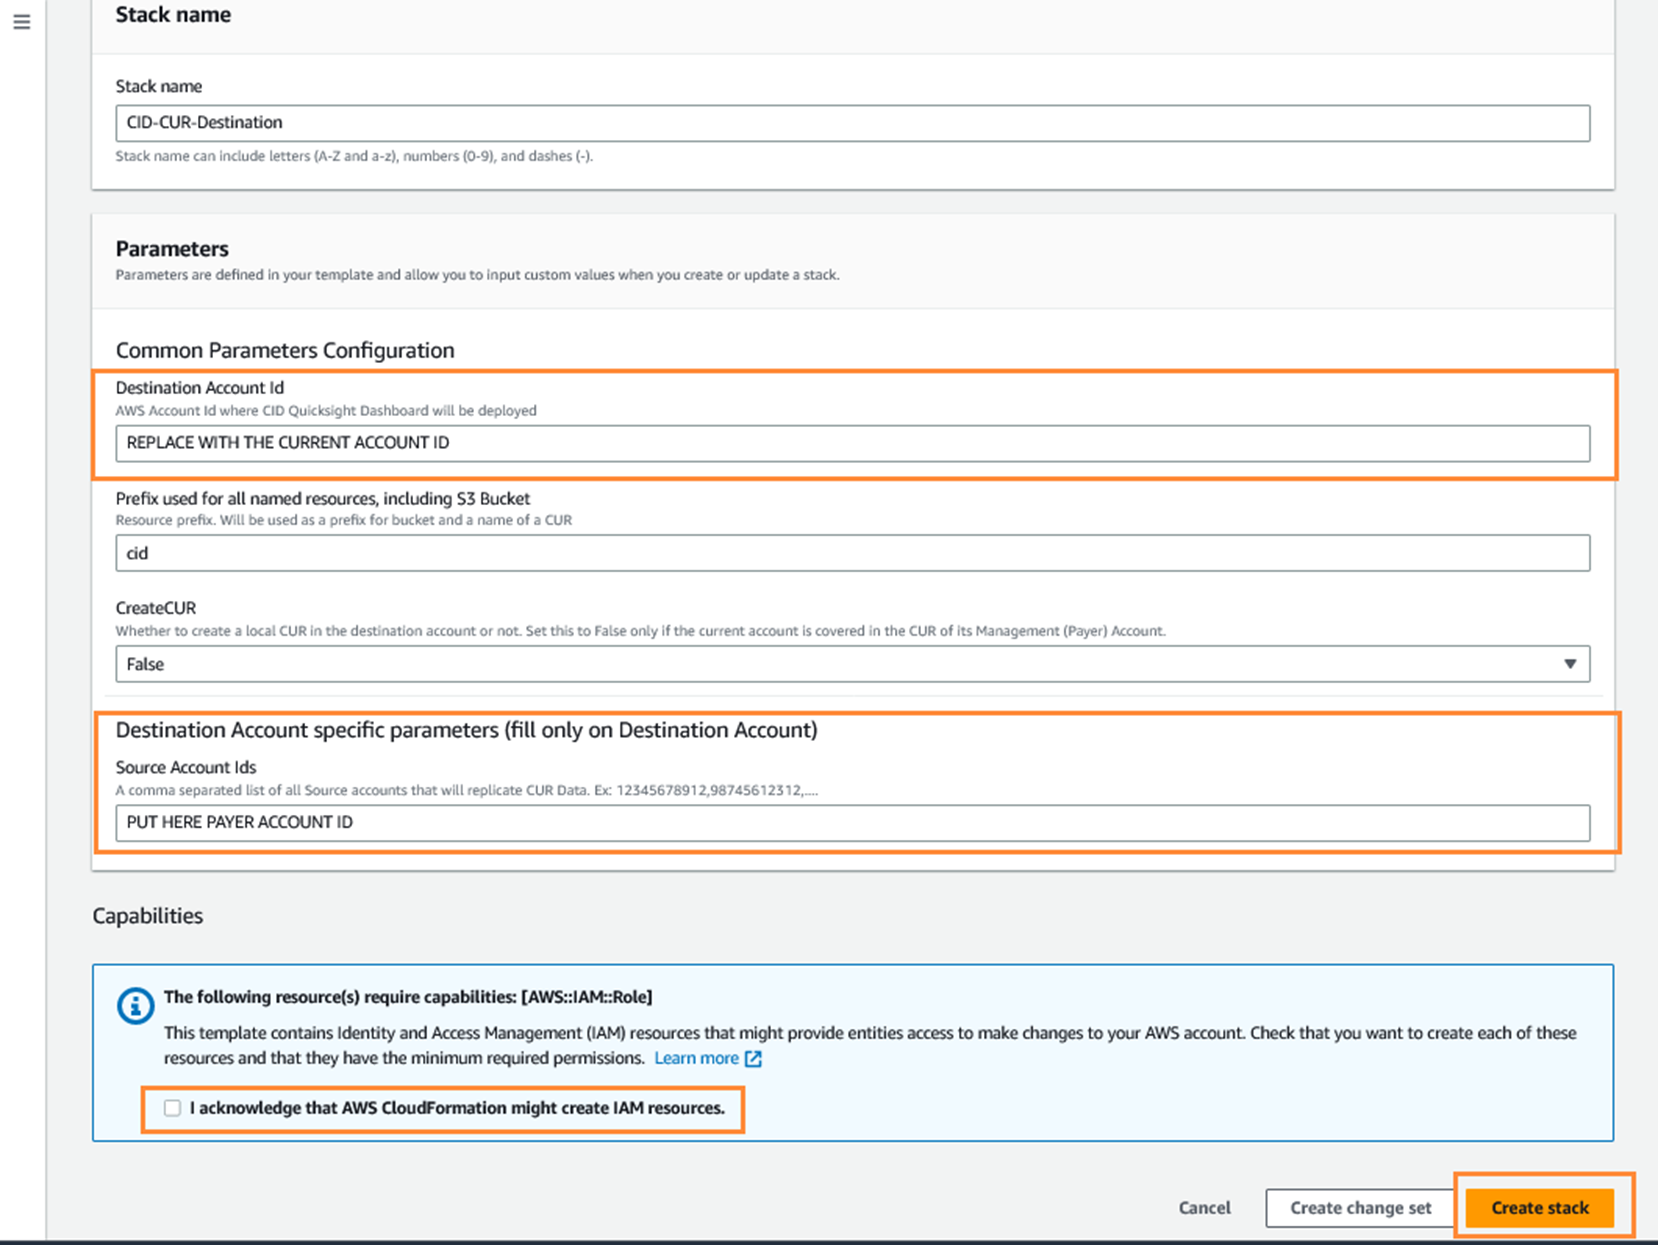
Choose whether to enable or disable CUR creation based on your scenario.
Enter the Account IDs of your Source Accounts, separated by commas.
Review the configuration and acknowledge the creation of IAM resources.
Click Create stack and wait for the stack to complete (usually 5 - 15 mins).
Once complete, the stack status will show as CREATE_COMPLETE.
Step 2: Deploy CUR and Replication Rules in Management/Payer/Source Account(s)
If your Management/Payer/Source Account(s) are different from your Data Collection Account, follow these steps:
Log into your Management/Payer/Source Account.
Click the Launch Stack button to open the stack template in your CloudFormation console.
Enter a Stack name for your template (e.g., CID-CUR-Replication).
Enter your Data Collection AWS Account ID as a parameter
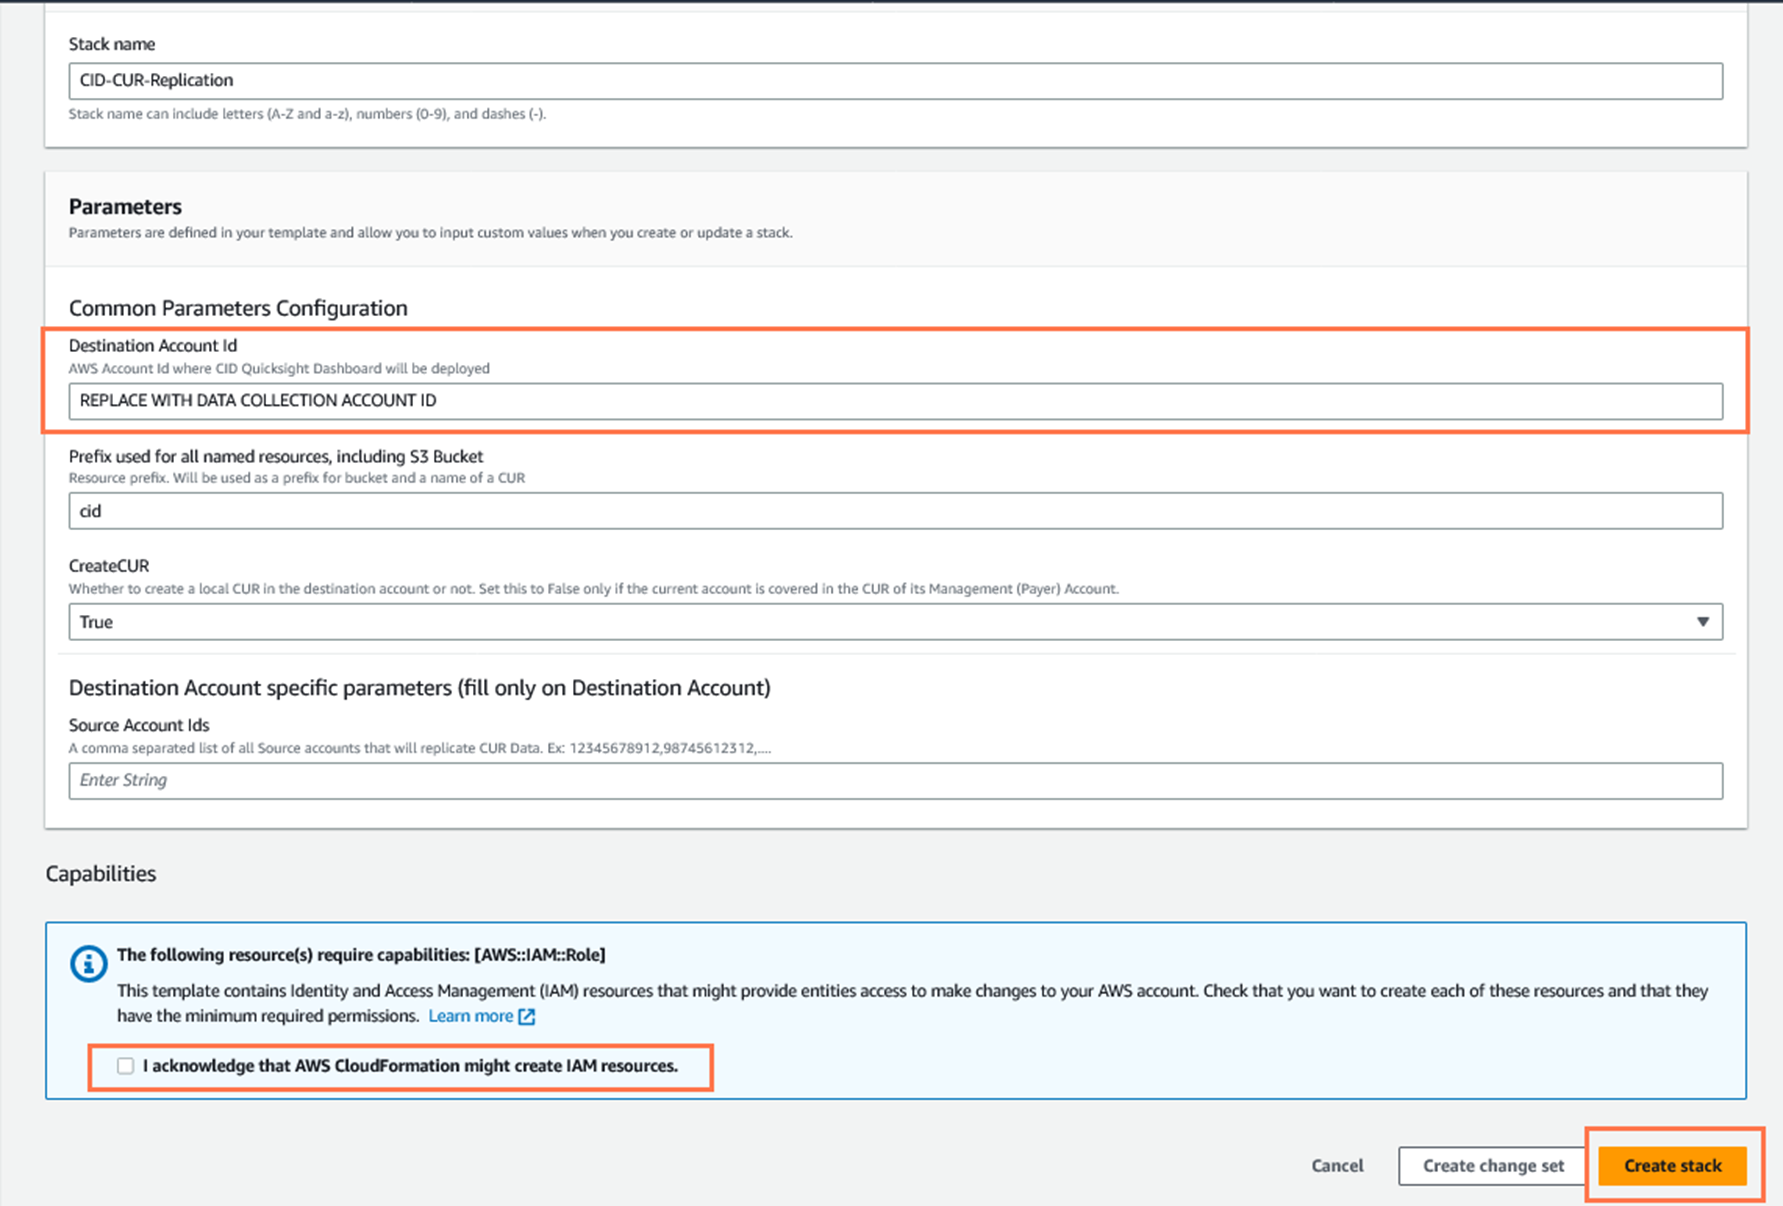
.
Review the configuration and acknowledge the creation of IAM resources.
Click Create stack and wait for the stack to complete (usually ~5 mins).
Once complete, the stack status will show as CREATE_COMPLETE.
Step 3: Deploy Dashboards in the Data Collection Account
In this final step, you will deploy the Cloud Intelligence Dashboards in the Data Collection Account:
Prepare Amazon QuickSight if you haven't already. Skip this step if you're already a regular QuickSight user.
Deploy the Dashboards CloudFormation template in your Data Collection Account.
Log in to your Data Collection Account.
Click the Launch Stack button to open the CloudFormation template.
Enter a Stack name for your template (e.g., Cloud-Intelligence-Dashboards).
Review Common Parameters and confirm prerequisites.
Copy and paste your QuickSight Username into the parameter text box

.
Update your CURBucketPath if needed.
Select the Dashboards you want to install.
Review the configuration and acknowledge the creation of IAM resources.
Click Create stack and wait for the stack to complete (~15-20 mins).
Once complete, the stack status will show as CREATE_COMPLETE.
Navigate back to CloudFormation Outputs tab to check dashboard URLs. Click on a URL to open the dashboards.
Troubleshooting
If you encounter issues with data not appearing in QuickSight Dashboards, follow these troubleshooting steps:
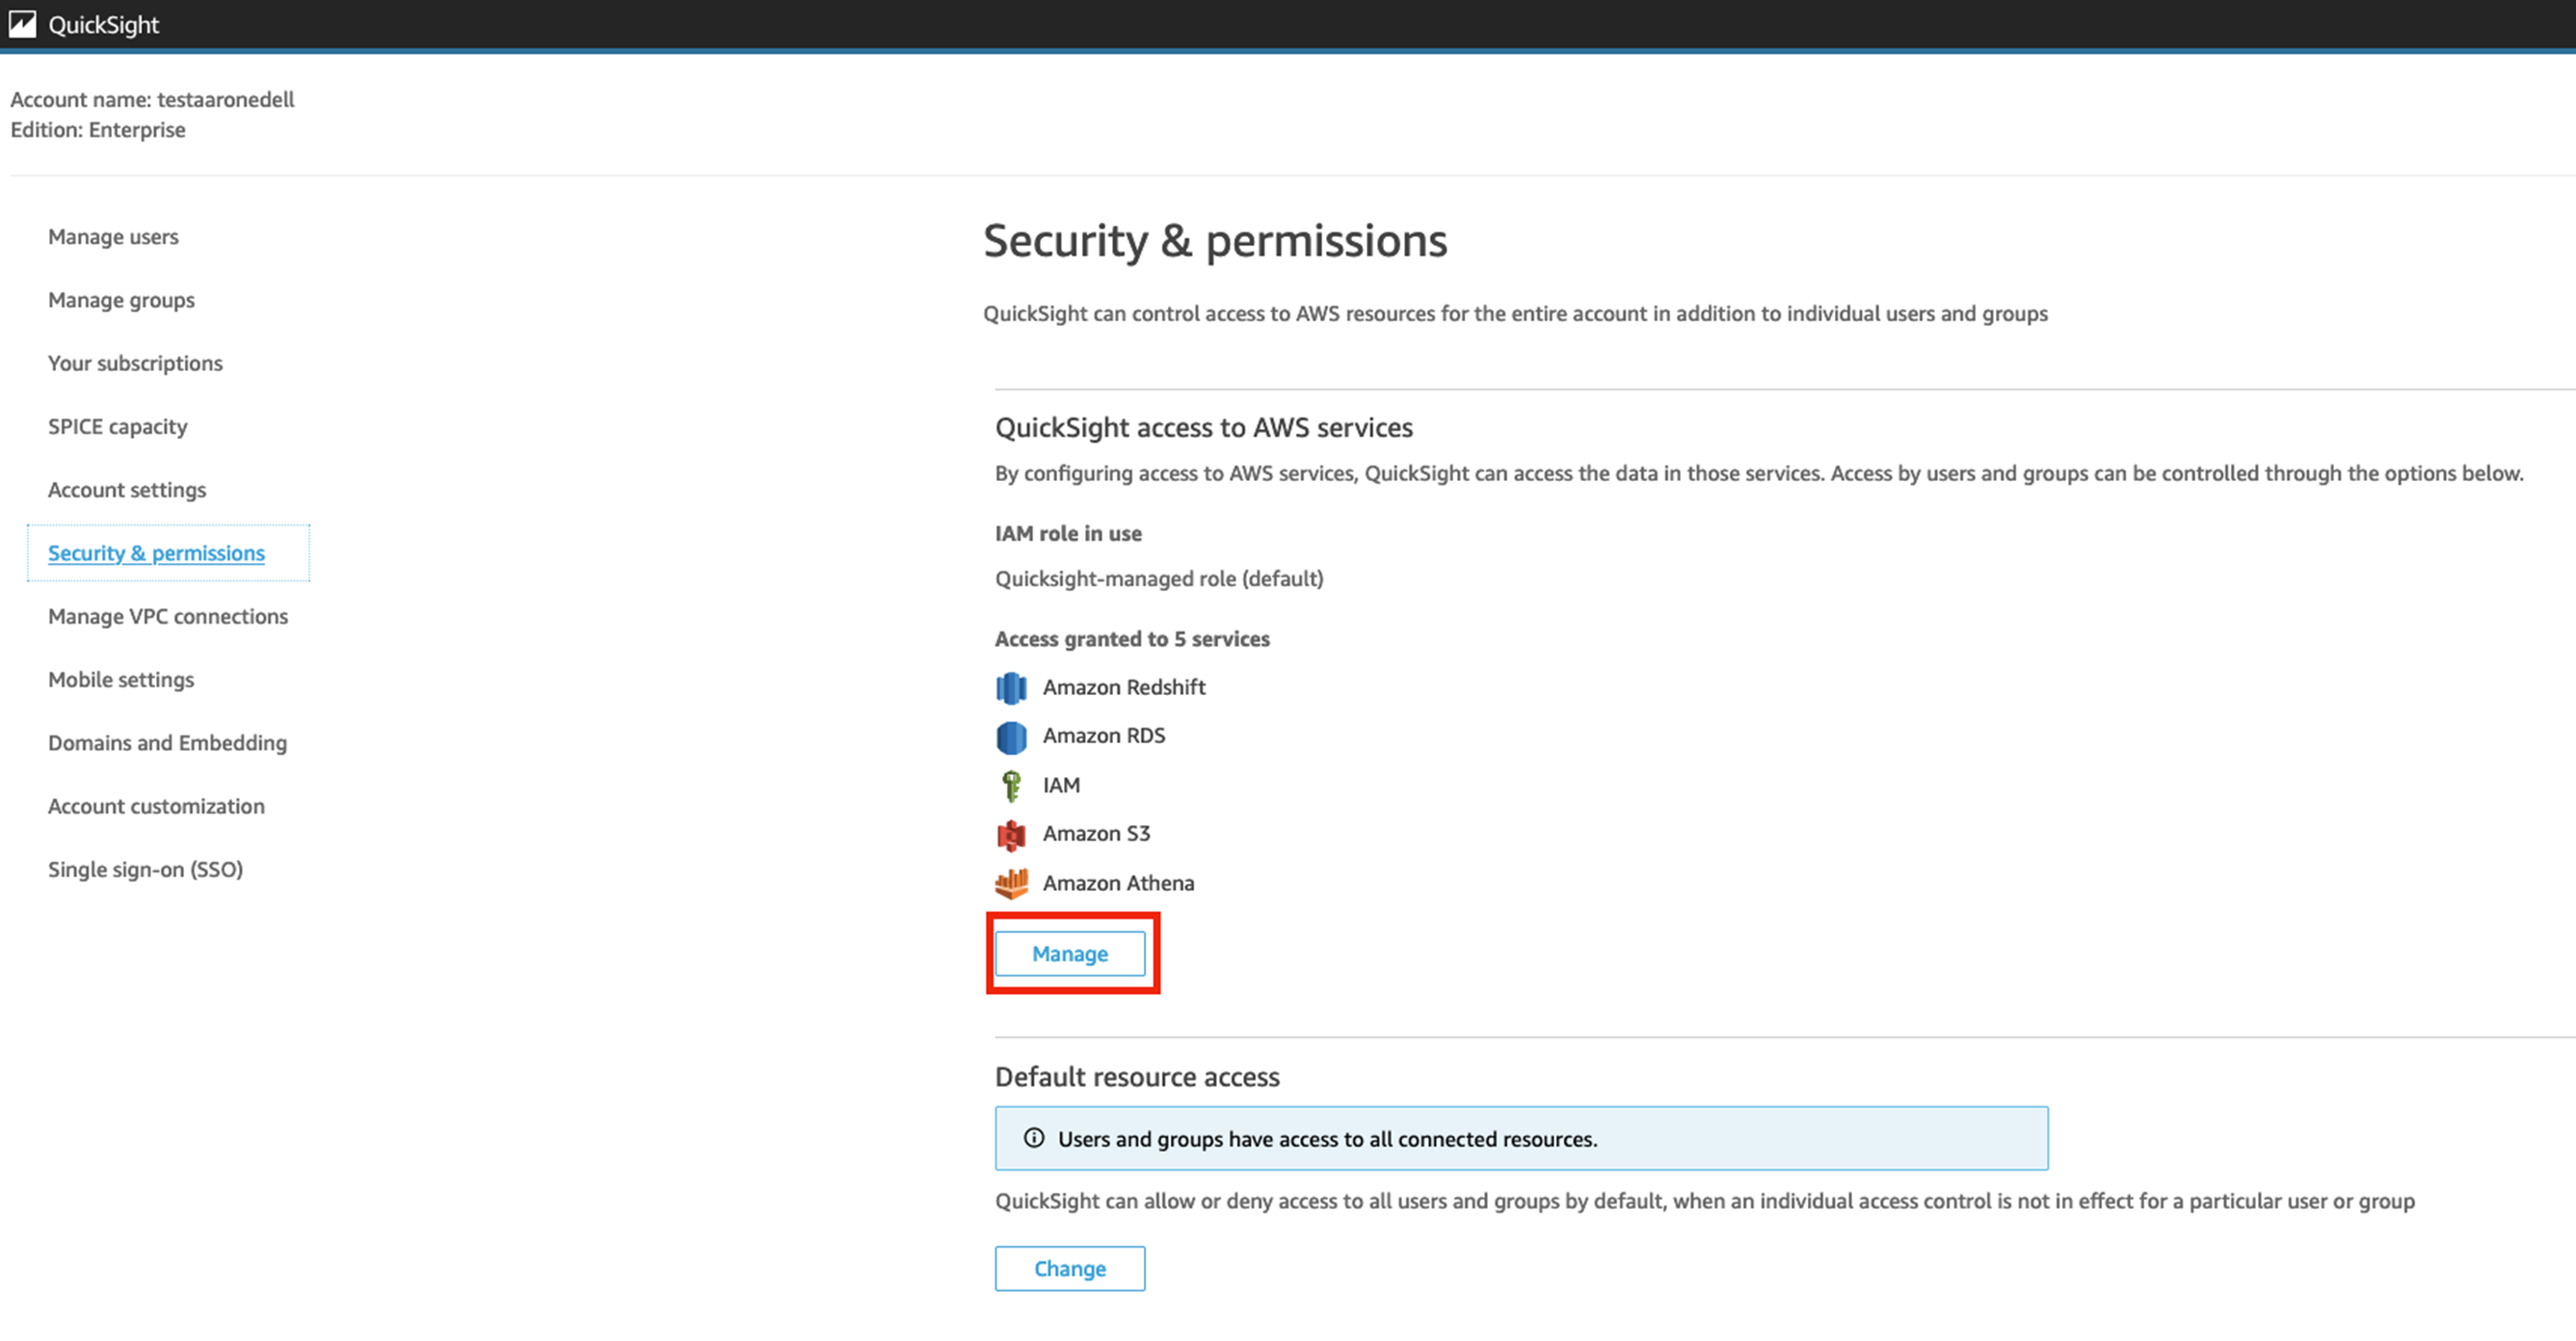
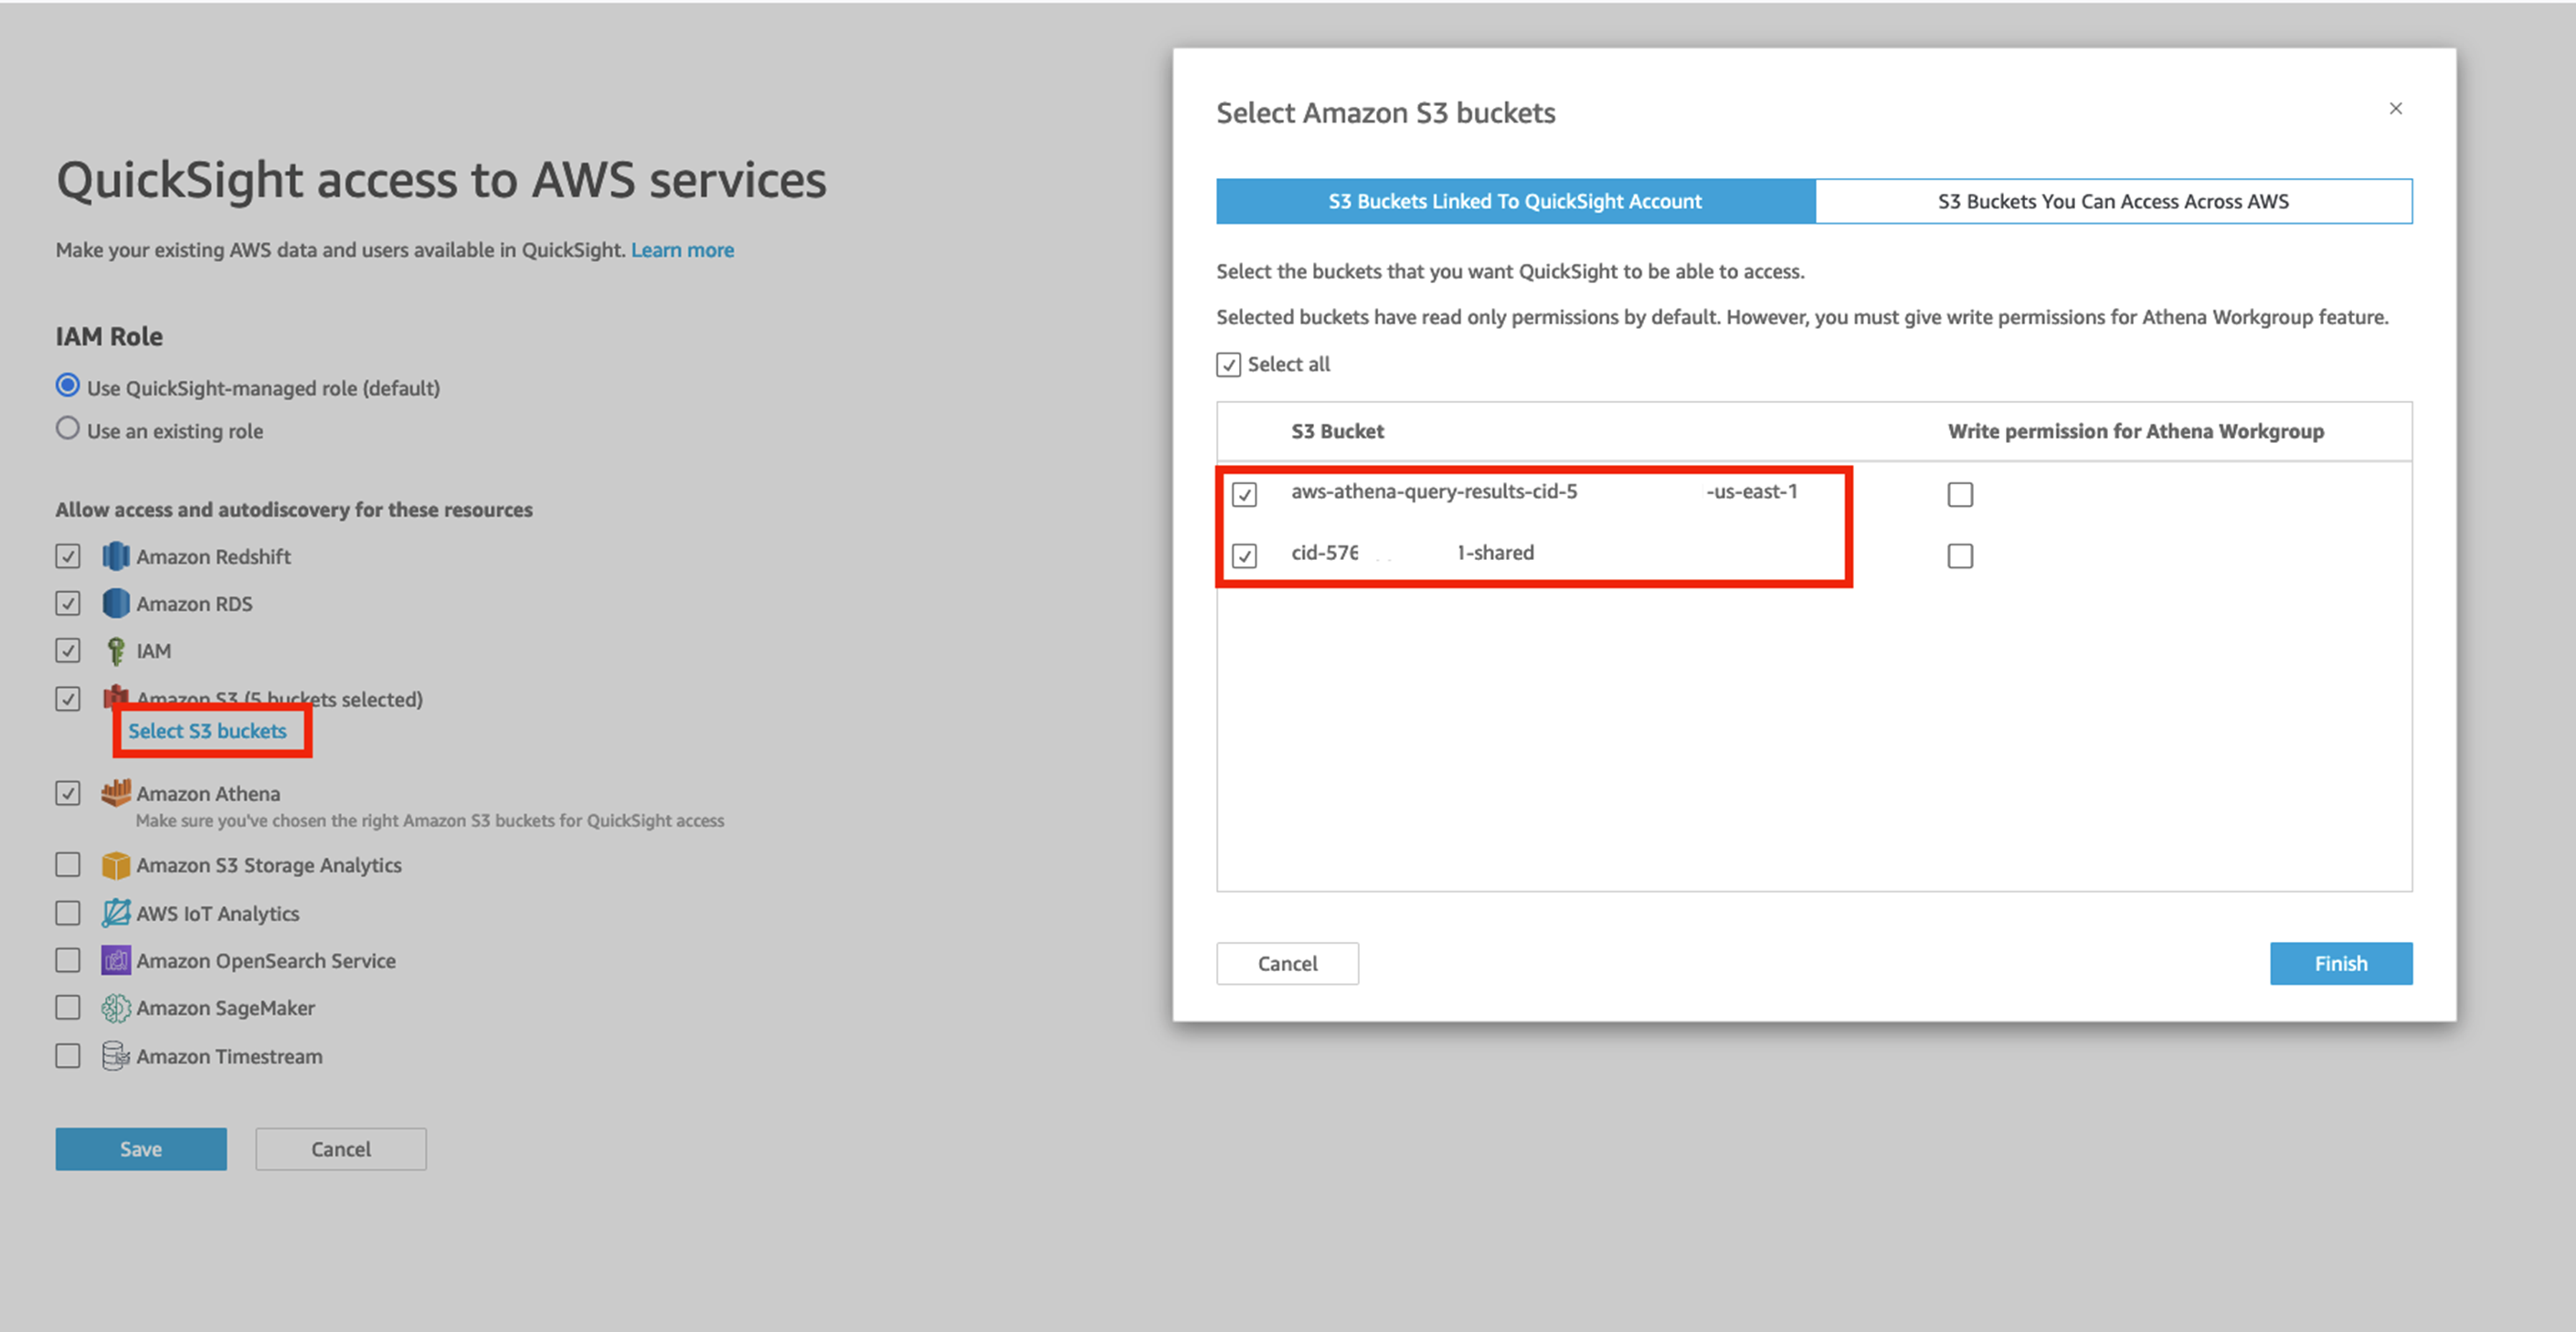
Ensure QuickSight has permissions to read from your CUR bucket.
Check for errors in QuickSight Datasets.
Verify if CUR data has arrived in the S3 bucket.
If necessary, create a Support Case requesting backfill of CUR with 12 months of data.
Final Steps
After updating and testing the account_map view in Athena, make sure QuickSight has access to the bucket containing Optimization Data Collection data and then refresh summary_view dataset in QuickSight. If needed, add Account Names using one of the provided options.
By following these steps carefully, you can successfully deploy AWS Cloud Intelligence Dashboards and leverage their capabilities for optimizing your cloud infrastructure.
Conclusion
AWS Cloud Intelligence Dashboards empower organizations to optimize their cloud infrastructure, enhance cost efficiency, and drive innovation. By providing real-time insights, actionable recommendations, and customizable dashboards, these tools enable businesses to make informed decisions and stay ahead in today's competitive landscape. Embrace the power of AWS Cloud Intelligence Dashboards and unlock the full potential of your cloud environment.
References
Well-Architected Labs. Cloud Intelligence Dashboards. [Online].
Available: https://www.wellarchitectedlabs.com/cloud-intelligence-dashboards/
AWS Cloud Financial Management Blog. A Detailed Overview of the Cost Intelligence Dashboard. [Online].
Available: https://aws.amazon.com/blogs/aws-cloud-financial-management/a-detailed-overview-of-the-cost-intelligence-dashboard/
Legal Disclaimer:
The opinions expressed in this blog are solely those of the author, and do not necessarily reflect the views or opinions of Amazon Web Services (AWS) or any other referenced organizations. The content, links, and images provided in this blog post are used for educational purposes only. All trademarks, service marks, and logos used in this blog are the property of their respective owners.
Readers are encouraged to verify the information provided and conduct their own research before making decisions based on the content of this blog. The author shall not be liable for any errors or omissions in the information provided or for any damages arising from its use.
Please share your thoughts and opinions on this topic in the comments section below.
The information provided above is based on the author's understanding and learning experience. Suggestions and corrections are always welcome.
~Abhiraj Kharbade
#DevOps #AWS #Cloud-Computing
Connect with me :
Subscribe to my newsletter
Read articles from Abhiraj Kharbade directly inside your inbox. Subscribe to the newsletter, and don't miss out.
Written by

Abhiraj Kharbade
Abhiraj Kharbade
I am an electrical engineer with a passion for DevOps and Cloud Engineering, I bring a unique perspective to the world of technology. My expertise includes a wide range of skills including DevOps methodologies, AWS Cloud, Jenkins, CI/CD, MAVEN, Linux, Shell Scripting, Python, YAML scripts, Groovy Scripts, Assembly language, Ansible, Docker, Kubernetes, Grafana, Tomcat, GitHub, Git, Docker Swarm, Terraform IaC, Cloud Engineering, and Networking. With a deep understanding of these technologies, I am able to design and implement complex systems that are both efficient and scalable. Whether working with large-scale enterprise systems or small startups, I am dedicated to delivering innovative solutions that drive success.


