How I Used Python and Folium to Visualize My Outdoor Activities
 Lukas Krimphove
Introduction
I dream of hiking from Munich to Venice, trekking across the beautiful Alps. But as I still have to live my everyday life, my journey has to consist of multiple stages, with weeks, months, or even years between each adventure. That is ok, as it’s more about the journey than the destination. However, I always wanted a way to visually retrace these paths, to see how far I’ve come and how close I am to my goal. I wanted a way to celebrate the progress I’ve made and to motivate myself to take the journey further.
Fortunately, many outdoor and sports apps, like Adidas Running, Komoot, Strava, and others, graciously allow us to export our activities as GPX files. However, there’s nowhere to go with those GPX files.
That is where Python and Folium come into play. I recently stumbled upon Folium, a powerful Python library for creating interactive maps. It can easily incorporate geographic data, such as the GPX files, and allows for customization and exploration. Drawing upon the wealth of GPS data I’ve gathered, I started experimenting with Folium to craft a map that brings my outdoor excursions to life.
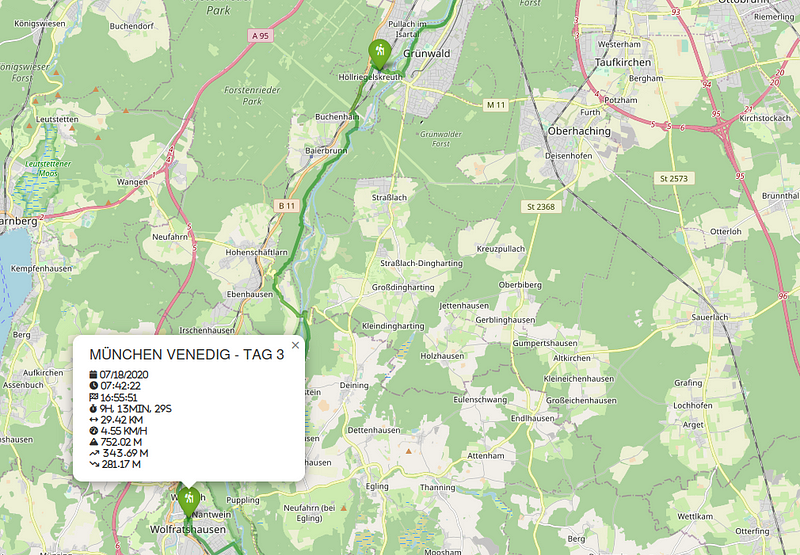
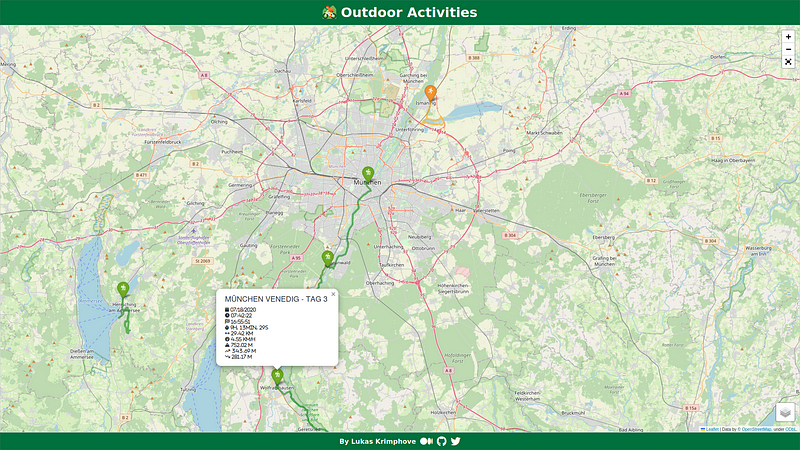
After some research and a lot of testing, I came up with a map that allows me to revisit my past outdoor activities:
So, if you are anything like me and have a treasure trove of GPS data without any purpose, you may wonder how I got there. So in this story, I will explain how to breathe life into your GPX files. Let’s embark on an expedition of exploration and mapping!
Getting Started with Jupyter Notebook
To begin this adventure, we’ll be using Jupyter Notebook. Why Jupyter Notebook? It’s a fantastic interactive computing environment that allows us to combine code, visualizations, and text, making it perfect for experimenting with our data and the Folium library.
If you haven’t installed Jupyter Notebook yet, follow the instructions on their official website. Once installed, you can create a new Jupyter Notebook and get ready for your journey.
Parsing GPX Files for Trail Data
Next, we need the raw material for our map — the GPX files. GPX (GPS Exchange Format) is a widely used file format that stores location data, such as latitude, longitude, elevation, and time, making it ideal for tracking outdoor activities.
If you’re an avid hiker, runner, cyclist, or skier, chances are you already have tracked various excursions using an outdoor or sports app. Plenty of those apps allow you to export your activities in GPX format. So gather those GPX files, and let’s get started!
In our Python code, we’ll use the gpxpy library to parse the GPX files and extract the essential trail data, such as latitude, longitude, elevation, speed, and distance. The parse_gpx() function will do all the heavy lifting for us:
### READ GPX FILES

import gpxpy
import pandas as pd
import numpy as np
import haversine as hs
from pathlib import Path


def parse_gpx(file_path):
    # parse gpx file to pandas dataframe
    gpx = gpxpy.parse(open(file_path), version='1.0')

    data = []
    points = []
    for track in gpx.tracks:
        for segment in track.segments:
            for point_idx, point in enumerate(segment.points):
                points.append(tuple([point.latitude, point.longitude]))

                # calculate distances between points
                if point_idx == 0:
                    distance = np.nan
                else:
                    distance = hs.haversine(
                        point1=points[point_idx-1],
                        point2=points[point_idx],
                        unit=hs.Unit.METERS
                    )

                data.append([point.longitude, point.latitude,point.elevation, point.time, segment.get_speed(point_idx), distance])

    columns = ['Longitude', 'Latitude', 'Elevation', 'Time', 'Speed', 'Distance']
    gpx_df = pd.DataFrame(data, columns=columns)

    return points, gpx_df


activities = {}
frames = []
for activity_type in ACTIVITY_TYPES:
    activities[activity_type] = {}

    pathlist = Path(activity_type).glob('**/*.gpx')
    for path in pathlist:
        # exclude hidden directories and files
        # will lead to performance issues if there are lots of hidden files
        if any(part.startswith('.') for part in path.parts):
            continue

        activity_group = path.parts[1]
        activity_name = path.parts[2]

        if activity_group not in activities[activity_type]:
            activities[activity_type][activity_group] = []

        points, gpx_df = parse_gpx(path)

        gpx_df['Elevation_Diff'] = np.round(gpx_df['Elevation'].diff(), 2)
        gpx_df['Cum_Elevation'] = np.round(gpx_df['Elevation_Diff'].cumsum(), 2)
        gpx_df['Cum_Distance'] = np.round(gpx_df['Distance'].cumsum(), 2)
        gpx_df['Gradient'] = np.round(gpx_df['Elevation_Diff'] / gpx_df['Distance'] * 100, 1)

        activities[activity_type][activity_group].append({
            'name': activity_name.replace('.gpx', '').replace('_', ' '),
            'points': points,
            'gpx_df': gpx_df
        })
        frames.append(gpx_df)

df = pd.concat(frames)
df
That leaves us with all the necessary data of an activity: a list of all the GPS coordinates and a Pandas DataFrame containing all kinds of metrics.
Plotting GPX Trails on the Interactive Map
With our GPS data now organized in a Pandas DataFrame, we can visualize our outdoor activities on an interactive map. Folium makes this task a breeze:
### CONFIG

# LOCATION = None
LOCATION = [48.13743, 11.57549] # latitude, longitude
ZOOM_START = 10

ACTIVITY_TYPES = {
    'Hiking': {
        'icon': 'person-hiking',
        'color': 'green'
    },
    'Running': {
        'icon': 'person-running',
        'color': 'orange'
    },
    'Biking': {
        'icon': 'person-biking',
        'color': 'red'
    },
    'Skiing': {
        'icon': 'person-skiing',
        'color': 'blue'
    }
}
We’ll create a map centered at a specific location (you can choose one or let the code determine the center based on your data).
We’ll assign unique colors and icons to each activity type, such as hiking, running, biking, or skiing. The
ACTIVITY_TYPESdictionary will help us with this.
### CREATE MAP

import folium
from folium import plugins as folium_plugins

if LOCATION:
    location = LOCATION
else:
    location=[df.Latitude.mean(), df.Longitude.mean()]

map = folium.Map(location=location, zoom_start=ZOOM_START, tiles=None)
folium.TileLayer('OpenStreetMap', name='OpenStreet Map').add_to(map)
folium.TileLayer('Stamen Terrain', name='Stamen Terrain').add_to(map)


### MAP TRAILS

def timedelta_formatter(td):
    td_sec = td.seconds
    hour_count, rem = divmod(td_sec, 3600)
    hour_count += td.days * 24
    minute_count, second_count = divmod(rem, 60)
    return f'{hour_count}h, {minute_count}min, {second_count}s'

def create_activity_popup(activity):
    df = activity['gpx_df']
    attributes = {
        'Date': {
            'value': df['Time'][df.index[0]].strftime("%m/%d/%Y"),
            'icon': 'calendar'
        },
        'Start': {
            'value': df['Time'][df.index[0]].strftime("%H:%M:%S"),
            'icon': 'clock'
        },
        'End': {
            'value': df['Time'][df.index[-1]].strftime("%H:%M:%S"),
            'icon': 'flag-checkered'
        },
        'Duration': {
            'value': timedelta_formatter(df['Time'][df.index[-1]]-df['Time'][df.index[0]]),
            'icon': 'stopwatch'
        },
        'Distance': {
            'value': f"{np.round(df['Cum_Distance'][df.index[-1]] / 1000, 2)} km",
            'icon': 'arrows-left-right'
        },
        'Average Speed': {
            'value': f'{np.round(df.Speed.mean() * 3.6, 2)} km/h',
            'icon': 'gauge-high'
        },
        'Max. Elevation': {
            'value': f'{np.round(df.Elevation.max(), 2)} m',
            'icon': 'mountain'
        },
        'Uphill': {
            'value': f"{np.round(df[df['Elevation_Diff']>0]['Elevation_Diff'].sum(), 2)} m",
            'icon': 'arrow-trend-up'
        },
        'Downhill': {
            'value': f"{np.round(abs(df[df['Elevation_Diff']<0]['Elevation_Diff'].sum()), 2)} m",
            'icon': 'arrow-trend-down'
        },
    }
    html = f"<h4>{activity['name'].upper()}</h4>"
    for attribute in attributes:
        html += f'<i class="fa-solid fa-{attributes[attribute]["icon"]}" title="{attribute}">  {attributes[attribute]["value"]}</i></br>'
    return folium.Popup(html, max_width=300)

feature_groups = {}
for activity_type in activities:
    color = ACTIVITY_TYPES[activity_type]['color']
    icon = ACTIVITY_TYPES[activity_type]['icon']

    for activity_group in activities[activity_type]:
        # create and store feature groups
        # this allows different activity types in the same feature group
        if activity_group not in feature_groups:
            # create new feature group
            fg = folium.FeatureGroup(name=activity_group, show=True)
            feature_groups[activity_group] = fg
            map.add_child(fg)
        else:
            # use existing
            fg = feature_groups[activity_group]

        for activity in activities[activity_type][activity_group]:
            # create line on map
            points = activity['points']
            line = folium.PolyLine(points, color=color, weight=4.5, opacity=.5)
            fg.add_child(line)

            # create marker
            marker = folium.Marker(points[0], popup=create_activity_popup(activity),
                                   icon=folium.Icon(color=color, icon_color='white', icon=icon, prefix='fa'))
            fg.add_child(marker)

map.add_child(folium.LayerControl(position='bottomright'))
folium_plugins.Fullscreen(position='topright').add_to(map)
map
We’ll use Foliums
FeatureGroupconcepts to group the trails based on their group name. That will allow us to show and hide certain activity groups later.Now, we’ll iterate through our parsed data and plot each trail on the map using Folium’s
PolyLineandMarkerobjects. ThePolyLinewill represent the actual trail, while theMarkerwill act as a starting point for each activity. When you click on a marker, a popup will display relevant information about the corresponding trail.
Conclusion
In this journey of exploration and mapping, we’ve learned how to use Python and Folium to transform mundane GPX files into a dynamic and interactive map. Now you can relive your outdoor adventures, celebrate your progress, and stay motivated for the next stage of your journey.
However, there are many ways to customize, extend, and improve your map. So grab your GPX files, fire up Jupyter Notebook, and let your past outdoor activities come to life on the map!
Happy mapping!
What’s next?
Stay tuned because there is much more to come:
deploying a website with your map using AWS
plotting elevation and speed profiles using Python and Plotly
enhancing trails with pictures taken on the way
and much more
References
All the code, including the Jupyter Notebook, is on my GitHub.
While doing my research on Folium, I found a great story by Patrick, who did the same thing I planned to do. His work was a great base to build upon my solution, so please check it out and leave some claps.
Subscribe to my newsletter
Read articles from Lukas Krimphove directly inside your inbox. Subscribe to the newsletter, and don't miss out.
Written by

Lukas Krimphove
Lukas Krimphove
I‘m working as a software engineer and consultant and love to do all kinds of tech projects in my spare time. I'm always up for a coding adventure and I love to share those adventures with you.
