Mastering Monitoring: A Deep Dive into Sending Docker Logs to Grafana Day - 75
 Vishal Shekokar
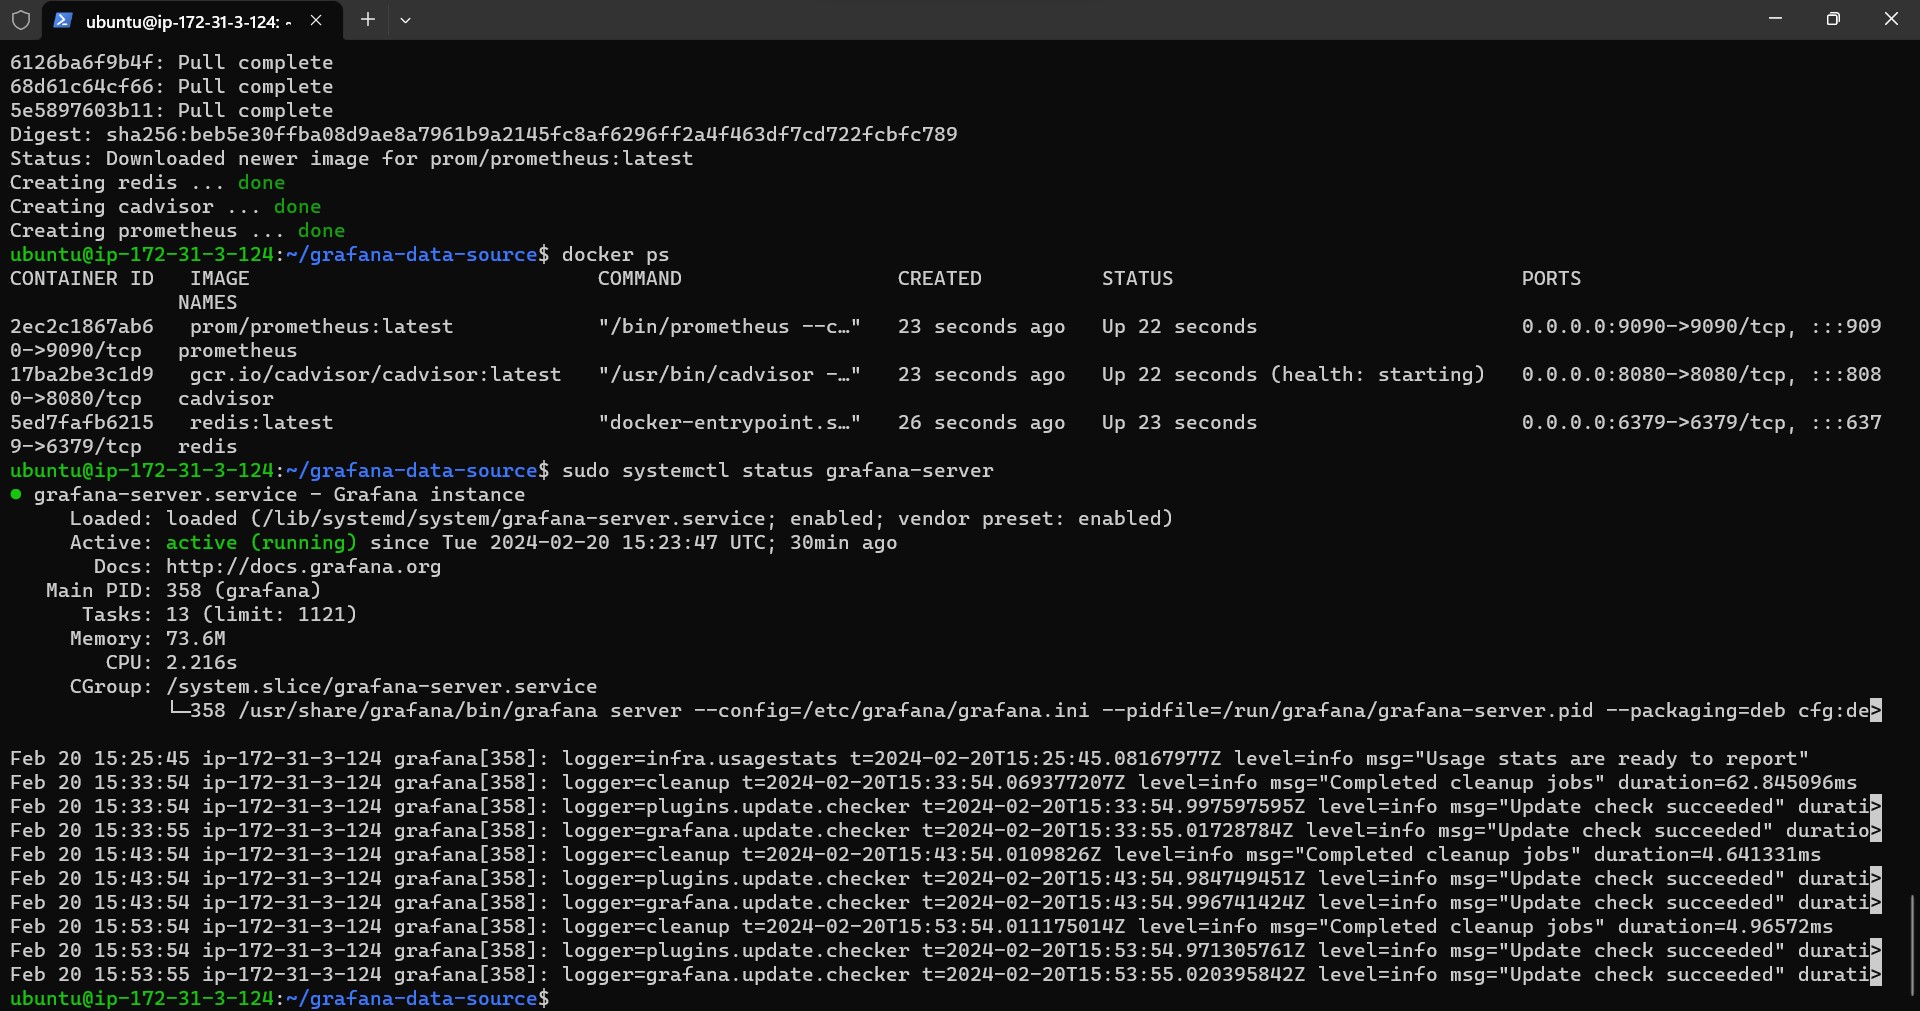
Introduction: In the ever-evolving landscape of monitoring tools, mastering Docker and Grafana integration adds a powerful dimension to your skill set. Today, we're embarking on a comprehensive journey, covering the installation of Docker on a Linux EC2 instance, containerizing a practical application, and seamlessly integrating real-time Docker logs with Grafana. Let's break down each step to ensure a thorough understanding.
Step 1: Setting Up Docker on a Linux EC2 Instance
Launch a Linux EC2 Instance:
Navigate to your AWS Management Console.
Choose the desired Amazon Machine Image (AMI) for your EC2 instance.
Configure instance details, including security groups.
Installing Docker:
Update the package repositories:
sudo apt-get update(for Ubuntu).Install Docker using the package manager:
sudo apt-get install docker-ce.
Launching Docker with USER DATA:
Leverage the USER DATA feature for an automated start of Docker on instance launch.
Add a script to execute Docker-related commands during instance initialization.
Step 2: Containerizing a Todo App
Pulling Todo App Image:
- Pull a Docker image for a simple todo application from a reputable registry:
docker pull todo-app-image.
- Pull a Docker image for a simple todo application from a reputable registry:
Creating Docker Containers:
- Use the pulled image to create two Docker containers:
docker create --name container-1 todo-app-image(repeat for container-2).
- Use the pulled image to create two Docker containers:
Running the Containers:
Start the containers:
docker start container-1anddocker start container-2.Verify accessibility by accessing the todo app in a web browser.
Step 3: Integrating Docker with Grafana
Connecting to Grafana:
Install Grafana on a separate machine or the same EC2 instance.
Access Grafana through the web interface.
Enabling Docker Plugin:
In Grafana, navigate to "Configuration" and select "Data Sources."
Add Docker as a data source and enable the Docker plugin.
Step 4: Configuring Grafana Dashboard for Docker Logs
Logging into Grafana:
- Access Grafana using the provided URL and credentials.
Dashboard Creation:
- Create a new dashboard: Click on the "+" icon and select "Dashboard."
Adding Docker Log Panel:
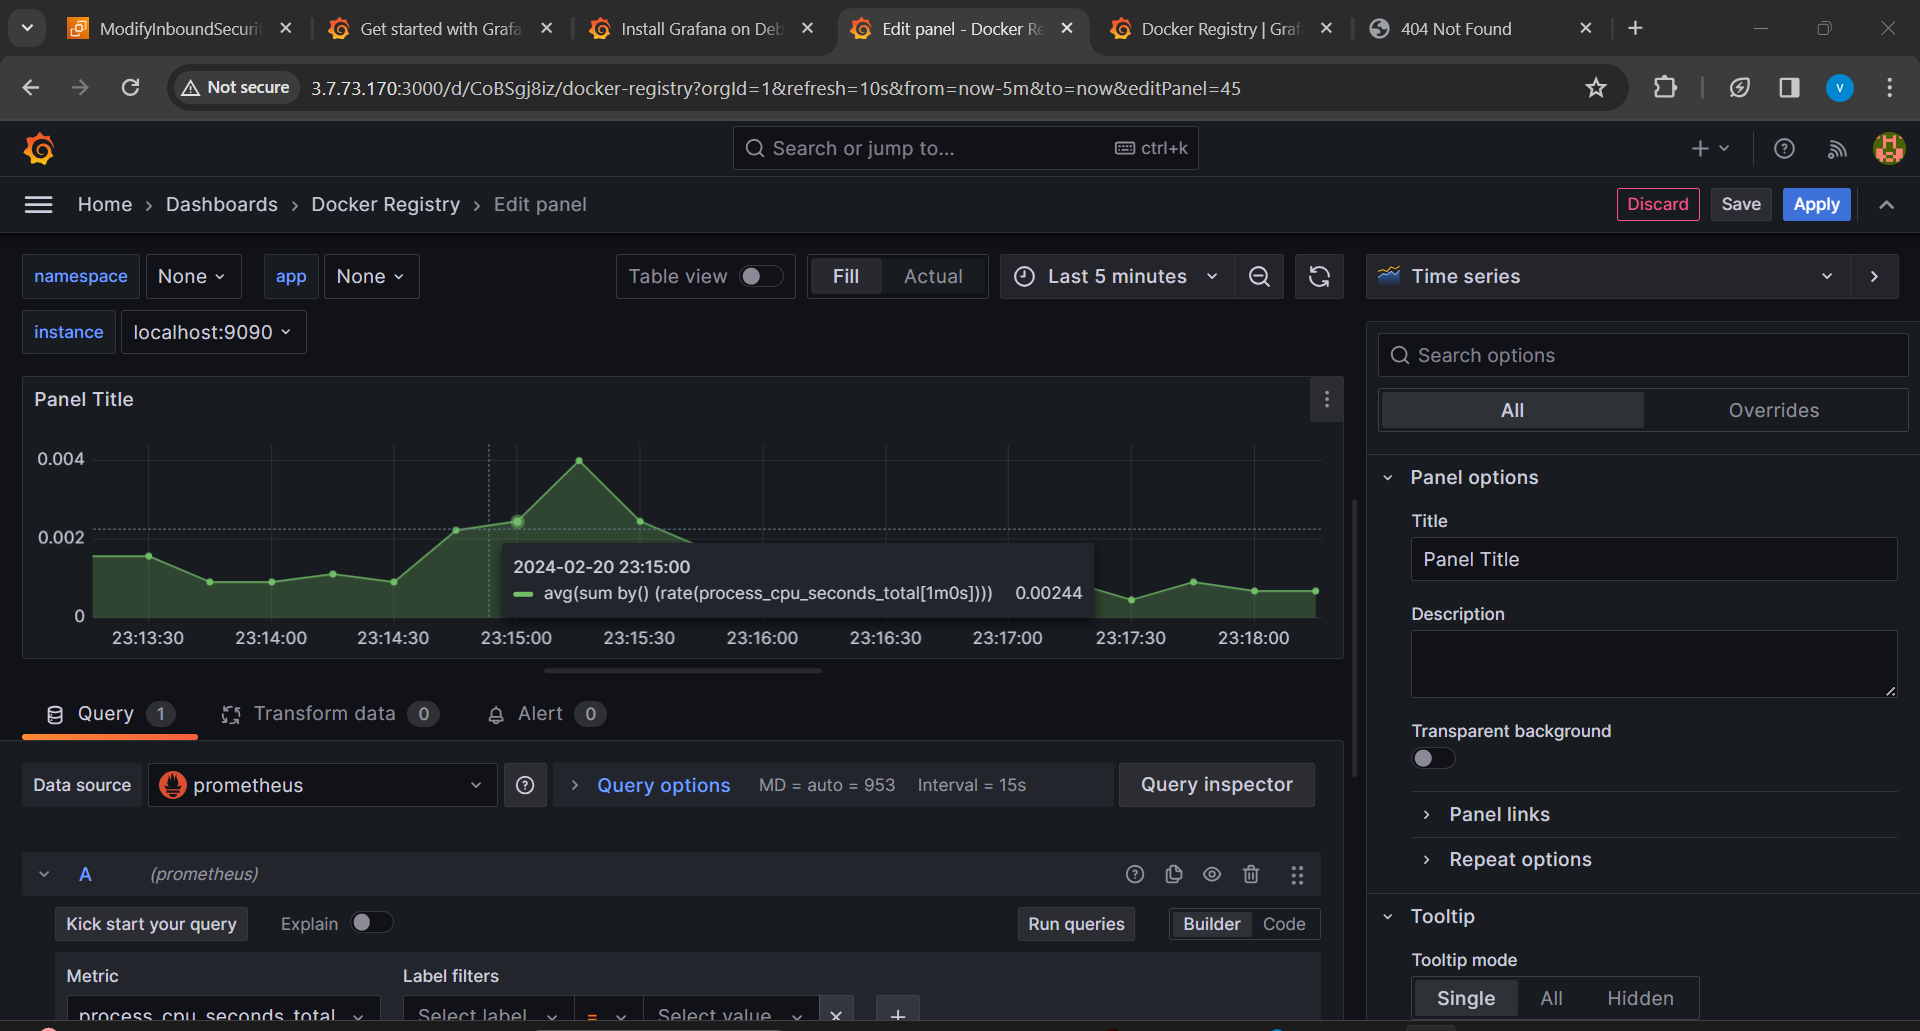
Add a panel for Docker logs: Click on "Add Panel" -> "Query" -> Select "Docker" as the data source.
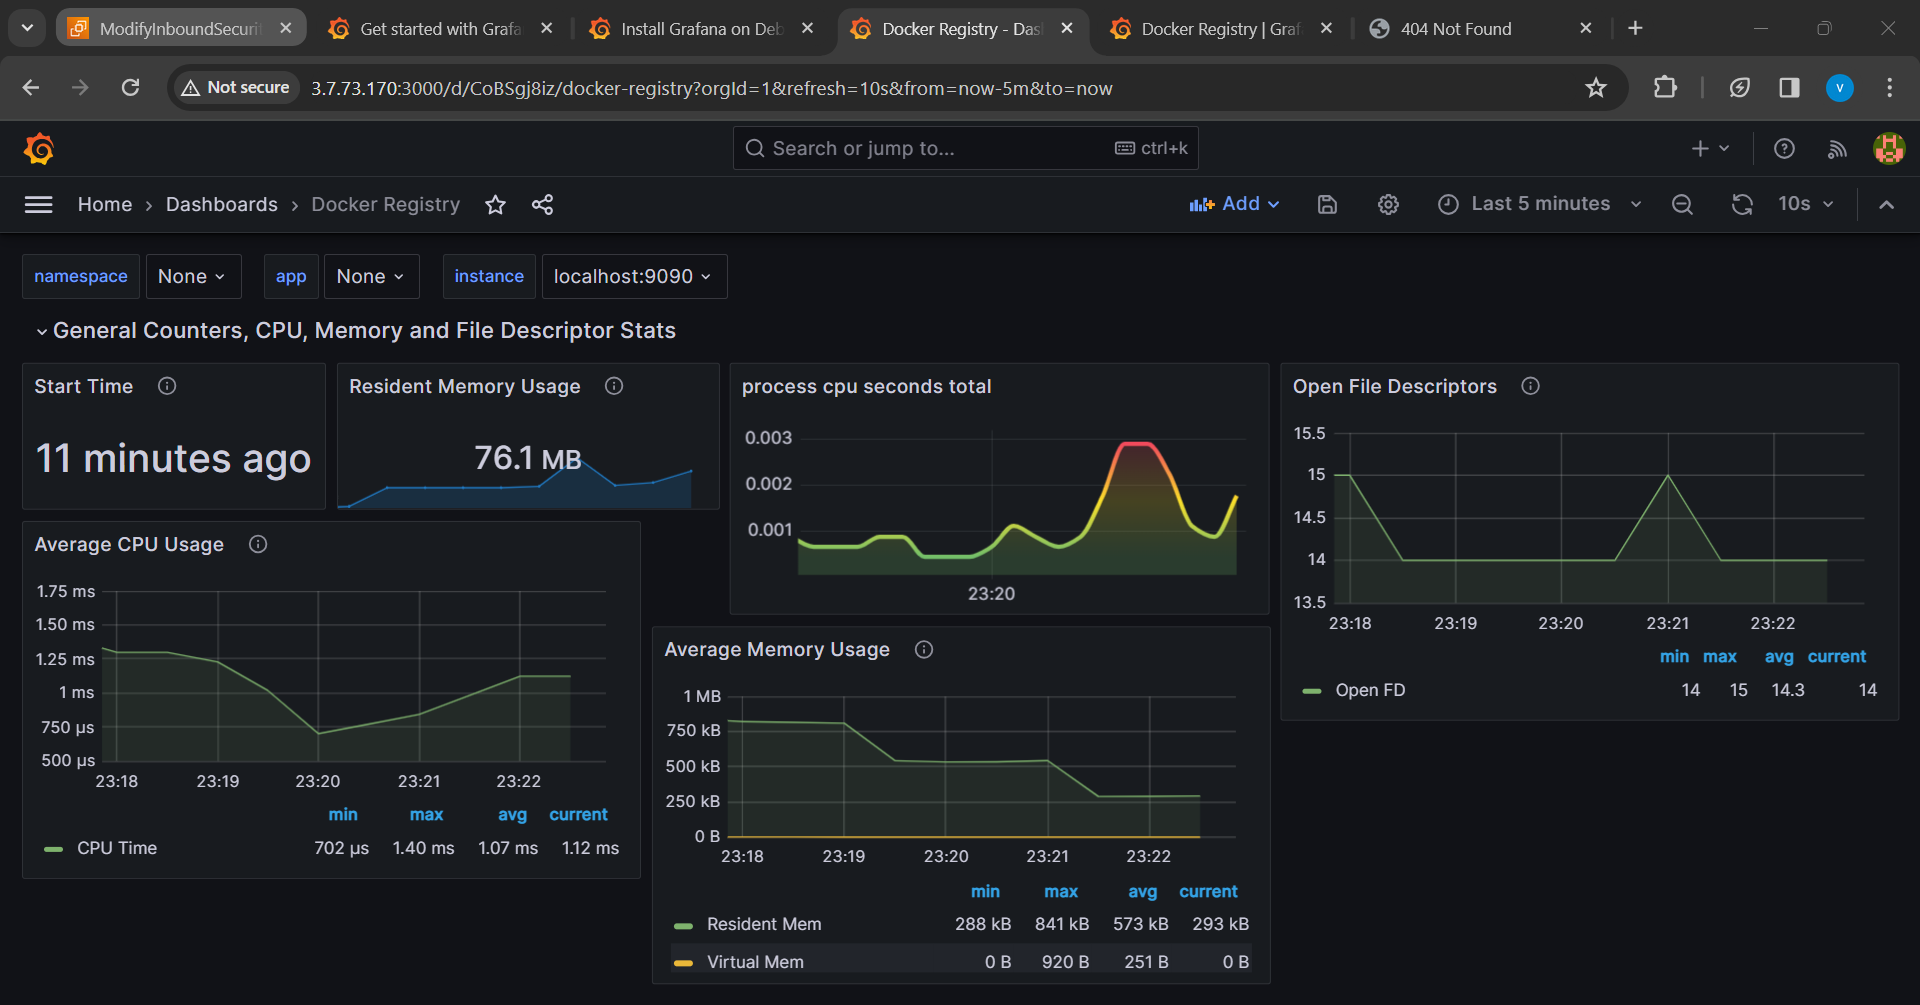
Configure the panel to display relevant information, such as container names and real-time logs.
Monitoring Your Containers:
- Observe real-time logs or use Grafana's search functionality to locate specific Docker container names.
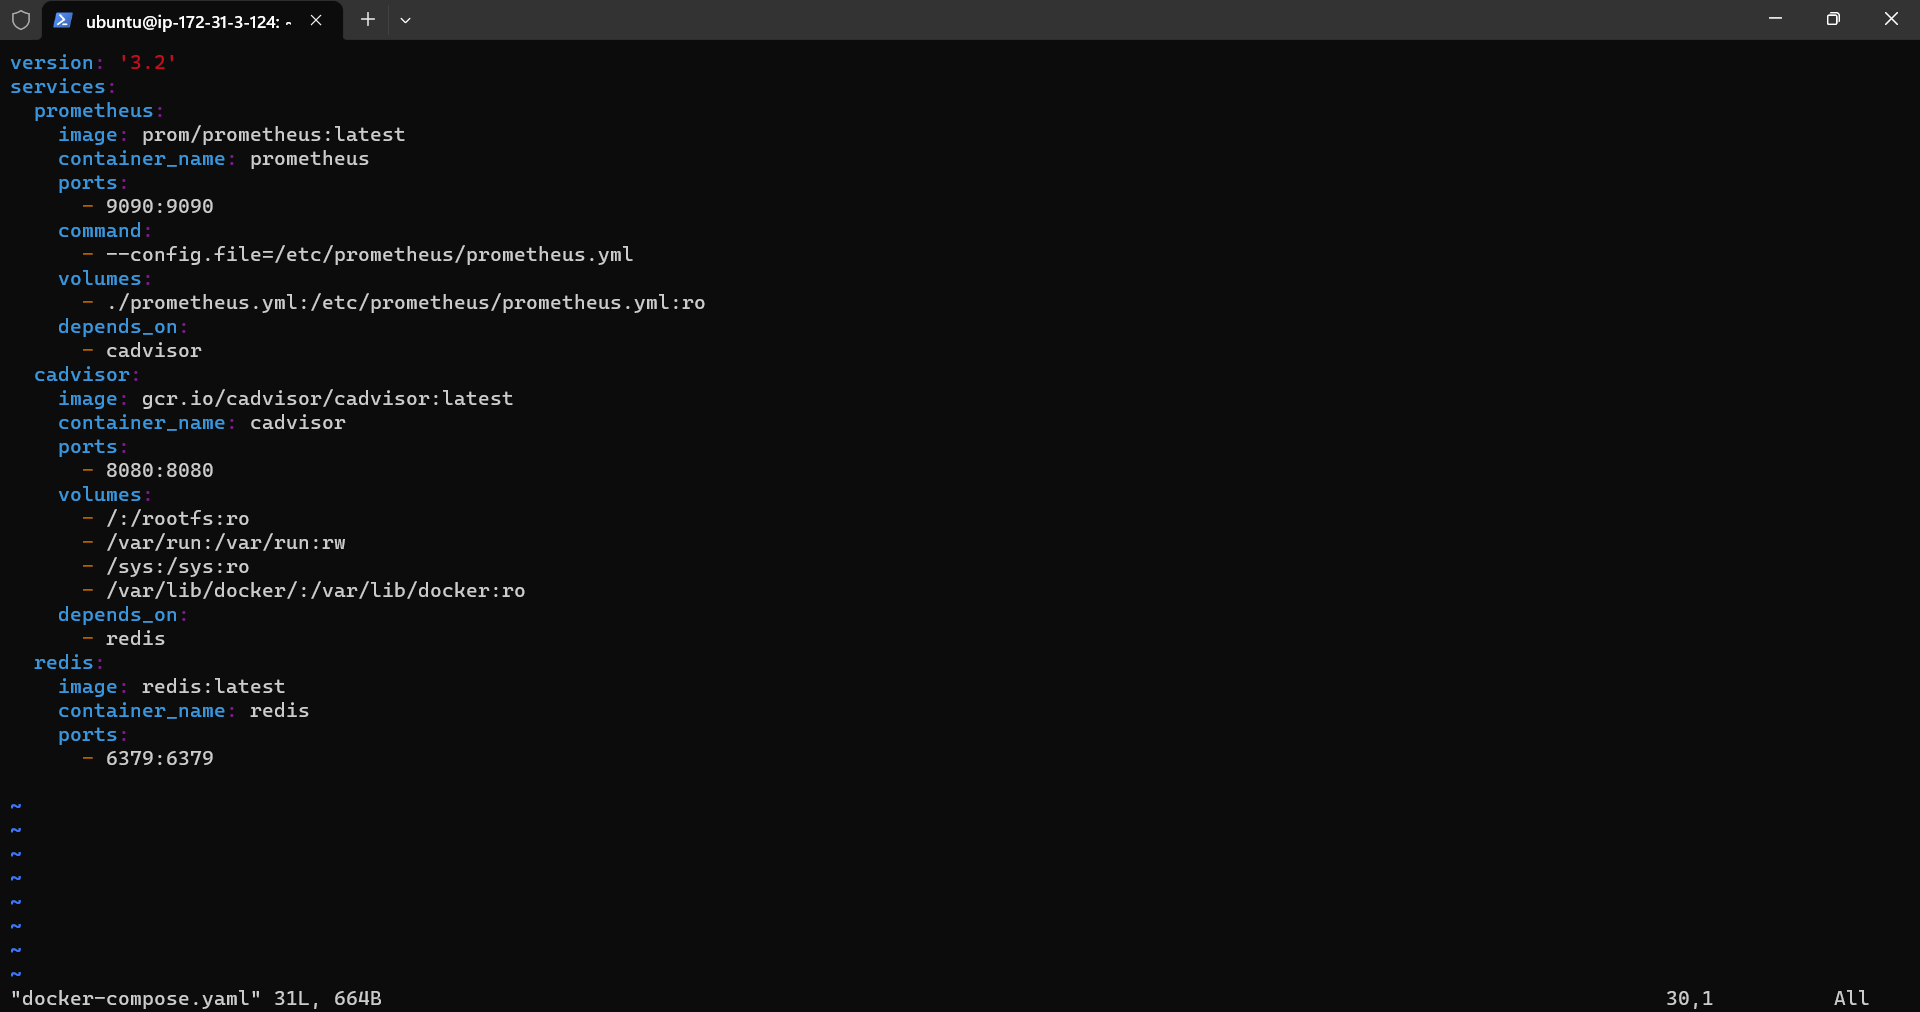
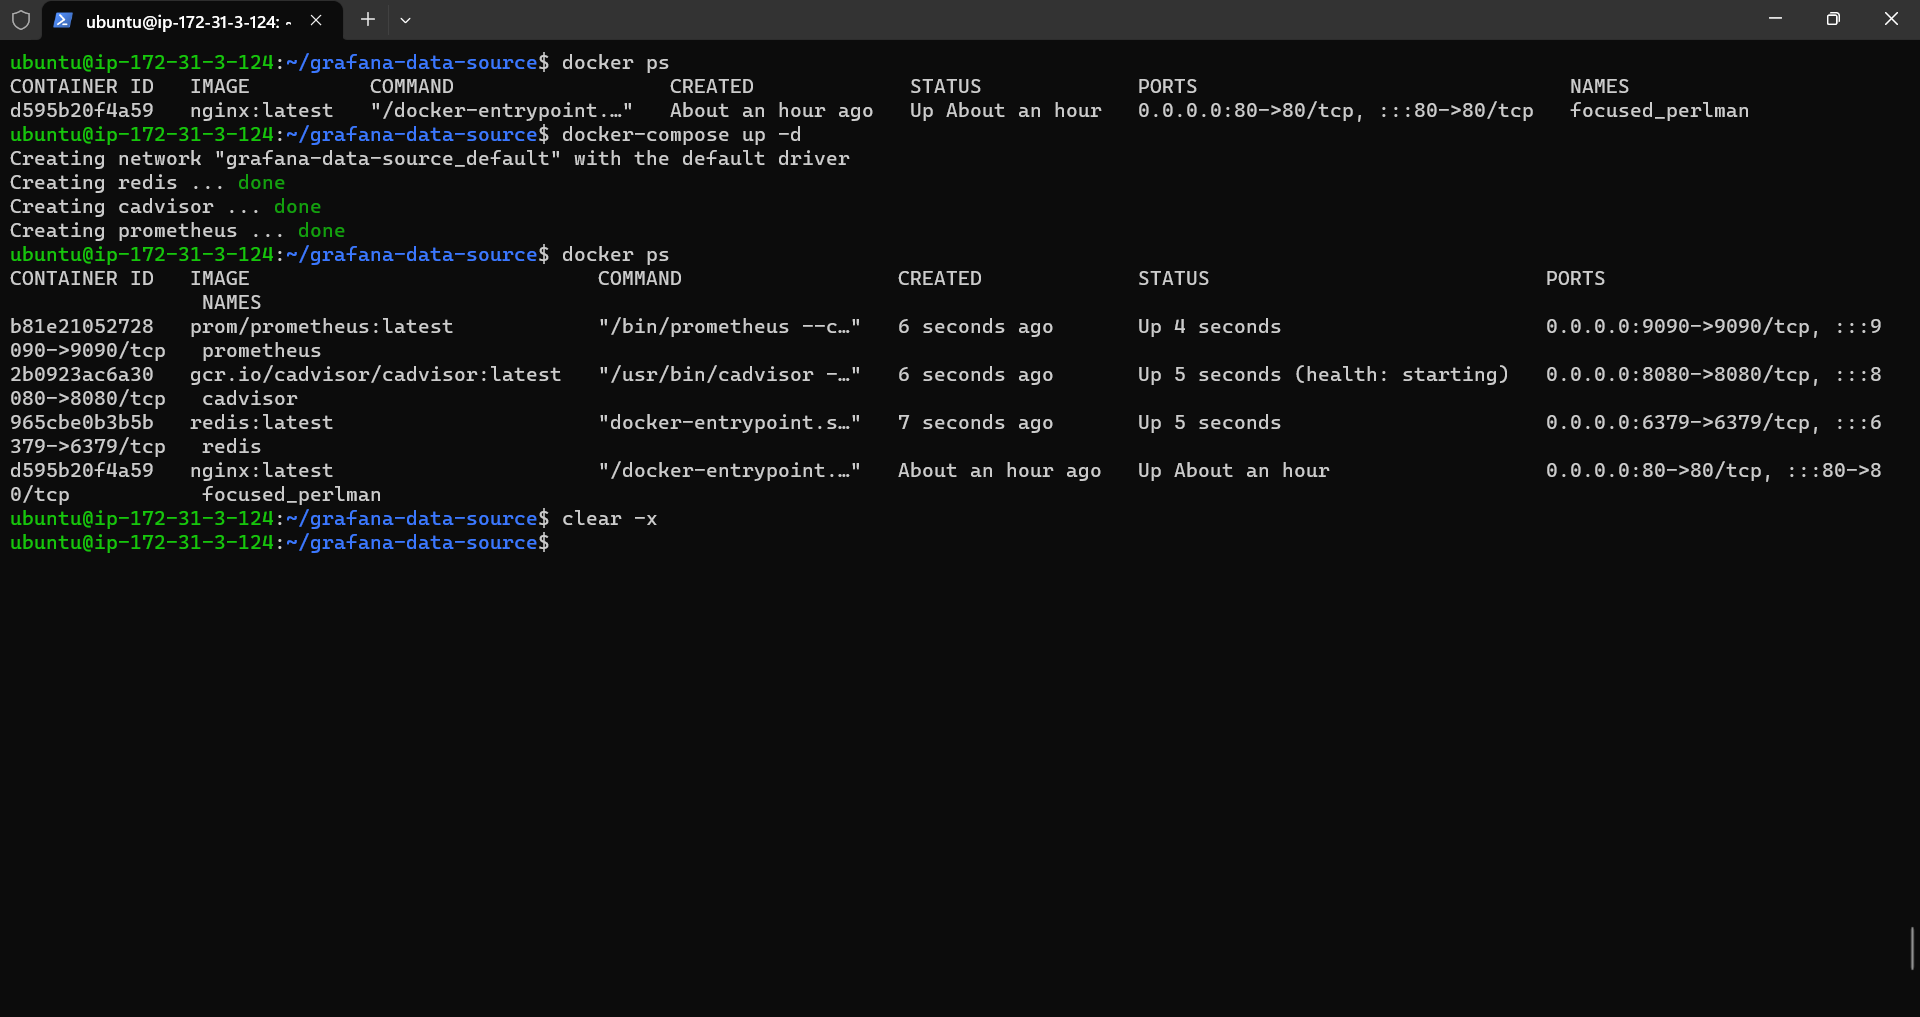
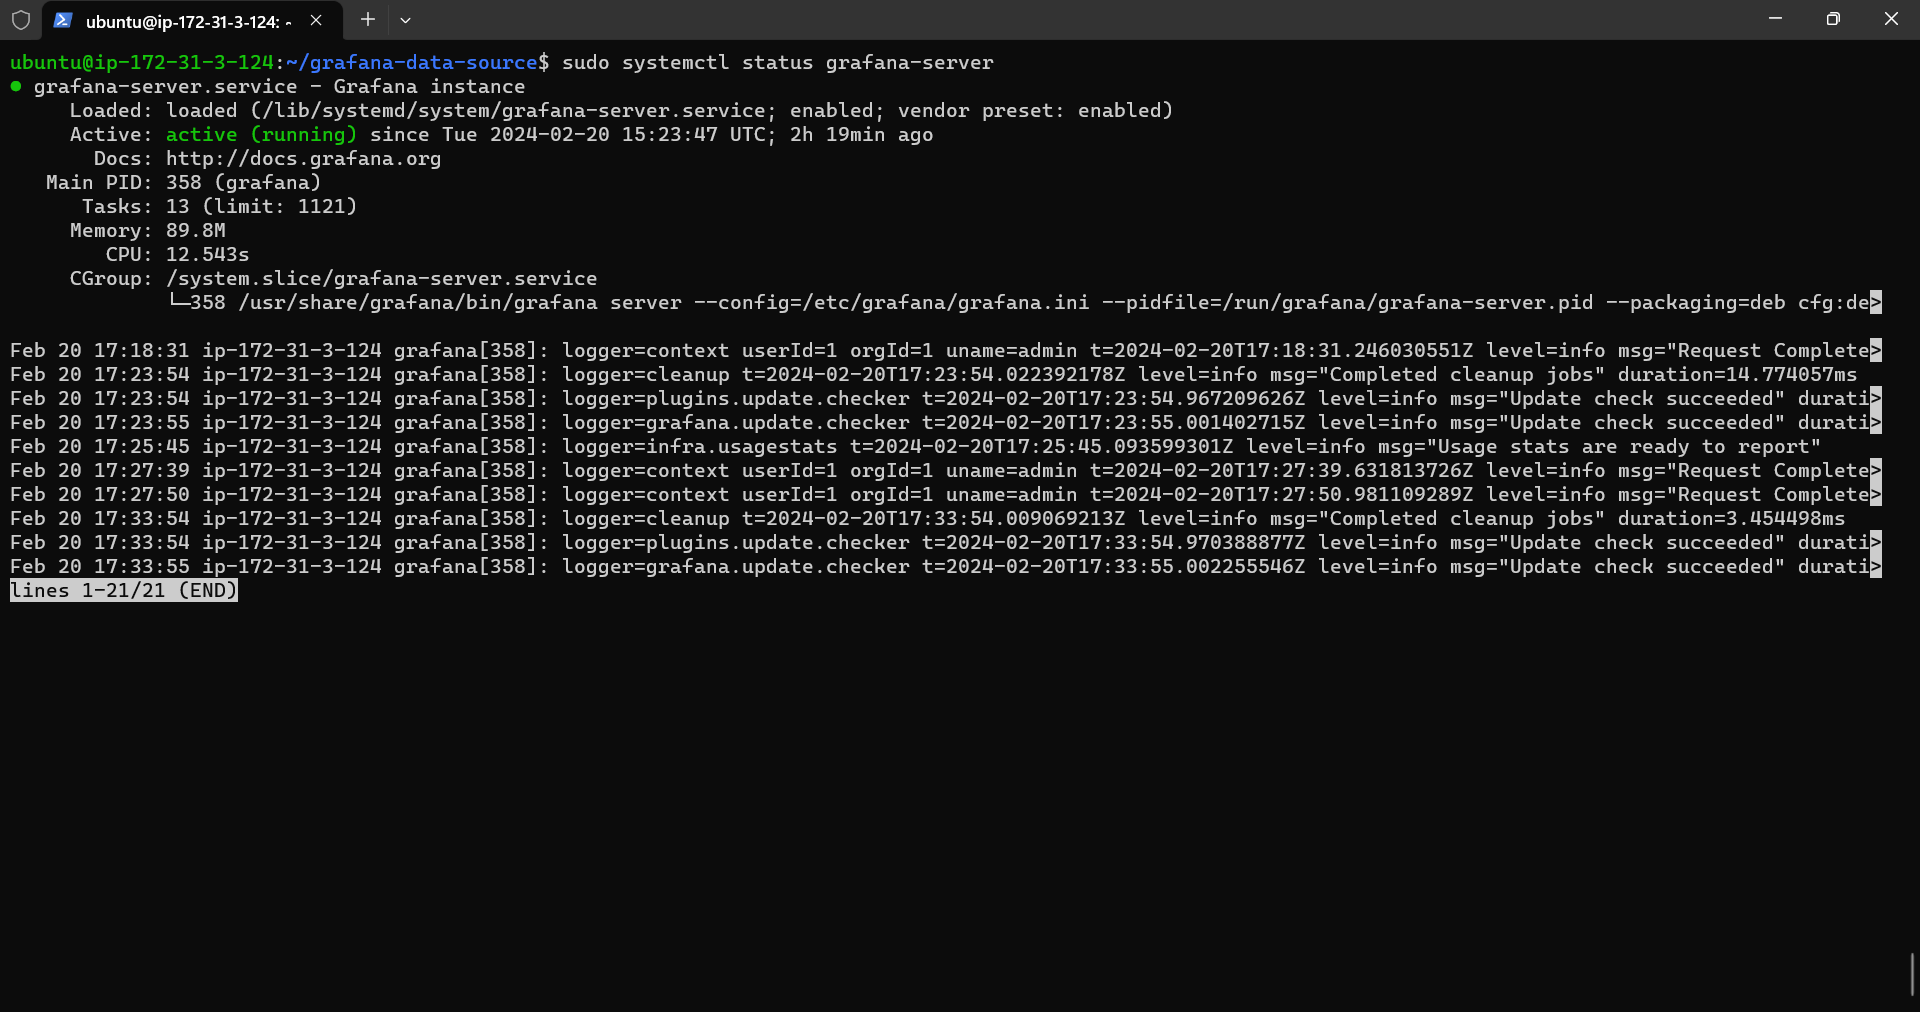
Conclusion:
By meticulously following these steps, you've not only set up Docker on a Linux EC2 instance and containerized a practical application but also seamlessly integrated Docker logs with Grafana. This hands-on experience not only boosts your monitoring capabilities but also provides valuable insights into managing and visualizing logs effectively. Update your resume with this comprehensive project and confidently stride forward in your mastery of monitoring tools. Happy monitoring! 🚀
Subscribe to my newsletter
Read articles from Vishal Shekokar directly inside your inbox. Subscribe to the newsletter, and don't miss out.
Written by

Vishal Shekokar
Vishal Shekokar
👋 Hello, I'm Vishal, an aspiring Information Technology enthusiast currently embarking on a journey towards a Bachelor's degree in Engineering. My passion lies in exploring the dynamic realms of cloud computing and DevOps technologies, where I constantly strive to bridge the gap between innovation and practical implementation. 💡 As a student of Information Technology, I'm on a mission to absorb knowledge, solve real-world problems, and contribute to the tech community. My academic pursuits fuel my curiosity, and my hands-on experience with cloud and DevOps tools empowers me to navigate the evolving landscape of modern technology. 🚀 Join me as I share insights, discoveries, and challenges encountered on this exciting educational and professional adventure. Let's connect, collaborate, and grow together in the ever-expanding world of IT. 🔗 Connect with me on social media and let's build a network that fosters learning, sharing, and innovation. Happy coding! 🌟