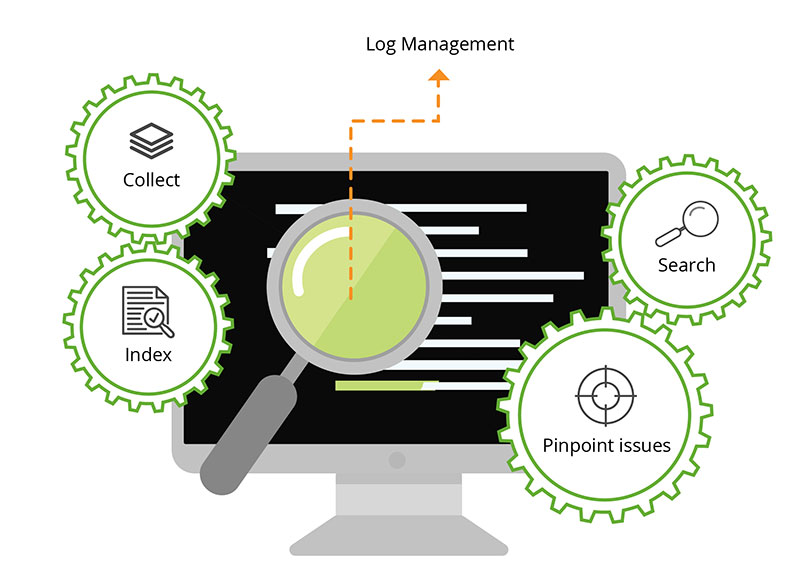
Exploring Log Monitoring in Kubernetes
 Cloud Tuned
Exploring Log Monitoring in Kubernetes
Log monitoring is a critical aspect of managing applications running on Kubernetes (K8s) clusters. It involves collecting, analyzing, and visualizing logs generated by containers, pods, and other Kubernetes resources to gain insights into the behavior, performance, and health of your applications and infrastructure. In this article, we'll delve into the importance of log monitoring in Kubernetes, explore the challenges of log management in containerized environments, and discuss popular tools and techniques for implementing log monitoring in K8s environments.
Importance of Log Monitoring in Kubernetes
In Kubernetes, applications are typically deployed as microservices running across multiple containers and nodes within a cluster. Monitoring logs generated by these distributed, dynamic environments is crucial for several reasons:
Troubleshooting and Debugging: Logs provide valuable insights into the runtime behavior of applications and help diagnose issues such as errors, failures, and performance bottlenecks.
Root Cause Analysis: Detailed log data allows operators to trace the root cause of incidents and understand the sequence of events leading up to an issue, facilitating effective incident response and resolution.
Auditing and Compliance: Log monitoring enables organizations to track and audit system activity, monitor compliance with regulatory requirements, and detect security threats and unauthorized access attempts.
Performance Optimization: Analyzing logs helps identify opportunities to optimize application performance, resource utilization, and efficiency by uncovering inefficiencies, redundant operations, and areas for improvement.
Challenges of Log Management in Kubernetes
Log management in Kubernetes presents several challenges due to the distributed, ephemeral nature of containerized environments:
Volume and Velocity: Kubernetes environments generate large volumes of log data from multiple sources, including containers, pods, nodes, and Kubernetes components. Managing and analyzing this data at scale can be challenging, particularly in dynamic, high-velocity environments.
Diversity of Sources: Logs in Kubernetes come from diverse sources, each with its own format, structure, and verbosity level. Consolidating and normalizing logs from different sources to gain a unified view of the system can be complex and time-consuming.
Ephemeral Nature of Containers: Containers in Kubernetes are ephemeral, meaning they can be created, destroyed, and replaced frequently. Capturing and retaining logs from short-lived containers poses challenges for traditional log management approaches.
Implementing Log Monitoring in Kubernetes
Several tools and techniques can be used to implement log monitoring in Kubernetes environments:
Logging Agents: Logging agents such as Fluentd, Fluent Bit, and Filebeat are lightweight, daemon-like processes deployed as sidecar containers or as part of the logging infrastructure within Kubernetes clusters. These agents collect, parse, and forward logs from containers to centralized logging systems for storage and analysis.
Centralized Logging Platforms: Centralized logging platforms such as Elasticsearch, Splunk, and Loki provide scalable, distributed storage and indexing for log data. These platforms ingest logs from logging agents and provide powerful querying and visualization capabilities for searching, analyzing, and alerting on log data.
Kubernetes Native Logging: Kubernetes provides native support for logging through the
kubectl logscommand, which allows operators to retrieve logs from individual containers and pods directly. However, this approach is limited in scalability and lacks advanced features such as log aggregation, retention, and analysis.Log Forwarding and Aggregation: Kubernetes clusters can be configured to forward logs from containers to centralized logging endpoints using logging drivers such as Fluentd or Fluent Bit. These logs can then be aggregated, filtered, and enriched before being stored in a centralized logging system for further analysis.
Log Analysis and Visualization: Tools such as Kibana, Grafana, and Loki can be used to visualize and analyze log data in Kubernetes clusters. These tools provide intuitive dashboards, charts, and graphs for monitoring application and infrastructure logs, identifying trends, and detecting anomalies.
Conclusion
Log monitoring is a critical component of managing applications and infrastructure in Kubernetes environments. By collecting, analyzing, and visualizing logs, operators gain insights into the behavior, performance, and health of Kubernetes resources, enabling proactive troubleshooting, incident response, and performance optimization. With a robust log monitoring solution in place, organizations can improve operational visibility, enhance system reliability, and deliver a superior user experience for Kubernetes-based applications.
Subscribe to my newsletter
Read articles from Cloud Tuned directly inside your inbox. Subscribe to the newsletter, and don't miss out.
Written by
