Daily Portfolio Summarizer with Langchain, Qdrant, and Mistral AI
 Ritobroto Seth
Today's Investors are bombarded with news, reports, statistics, and more information. AI cuts through this noise, analyzes vast datasets to unearth hidden patterns and trends, and offers insights that human minds might miss. While AI brings immense power, human judgment, and emotional intelligence play a vital role. The future lies in collaboration, where AI empowers investors with data-driven insights, while humans make informed decisions based on their values and long-term goals.
In this blog, we dive into the development of a Stock Portfolio Summarizer app. This RAG application analyzes user’s stock portfolios by offering valuable insights into the performance of their holdings.
The app delves into the quarterly reports of companies, offering a thorough analysis of their future performance. Additionally, it fetches the latest stock prices by delivering a daily performance overview to the user.
To develop this app, we'll utilize an open-source Large Language Model (LLM) called Mistral AI. Its primary task is to analyze a company's quarterly reports and extract key financial information such as Revenue, Earnings, Net Income, Expenses, and more. The goal is to furnish users with comprehensive information, enabling them to make well-informed decisions.
Technological Components
This app is built using Python, and for the user interface, we've employed Streamlit. The LLM framework utilized is LangChain. Qdrant is our Vector store, and Mistral AI is the LLM chosen. To operate Mistral AI locally, we’ll utilize the Ollama Platform.
Ollama is a tool that allows users to run open-source LLMs locally on their machines. It supports a variety of LLMs including Llama 2, Falcon, Mistral, etc. Ollama provides a simple API for creating, running, and managing models, as well as a library of pre-built models that can be easily used in a variety of applications. More instructions on how to use Ollama can be found here.
Other than these tools, we are also using the yfinance library to fetch the historical price of the stocks.
Python Dependencies
pip install langchain
pip install langchain_community
pip install langchain_core
pip install yfinance
pip install streamlit
pip install qdrant_client
App Demo
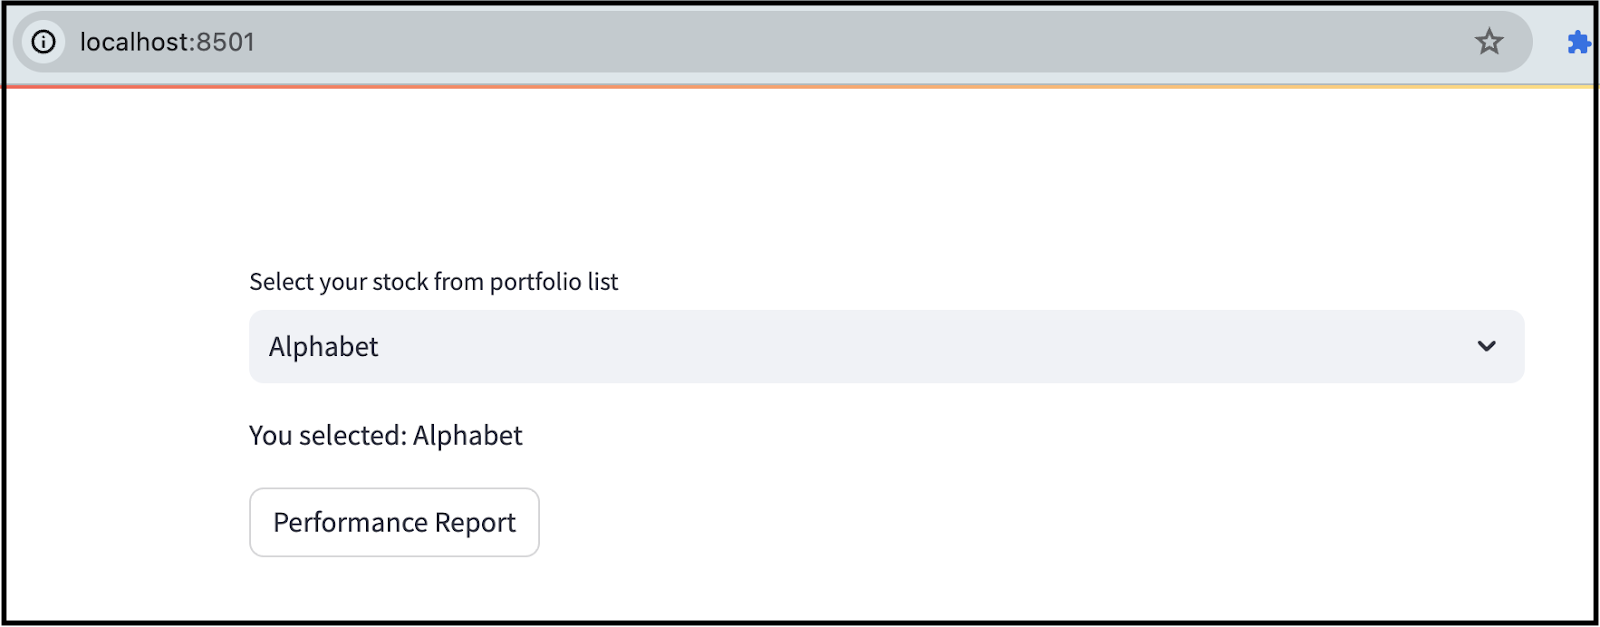
The screenshot below illustrates the appearance of our app. In this interface, we've included a dropdown menu by offering a list of companies within the user's portfolio. Users can select a specific company and click the "Performance Report" button, which promptly delivers the performance report tailored to the selected company.

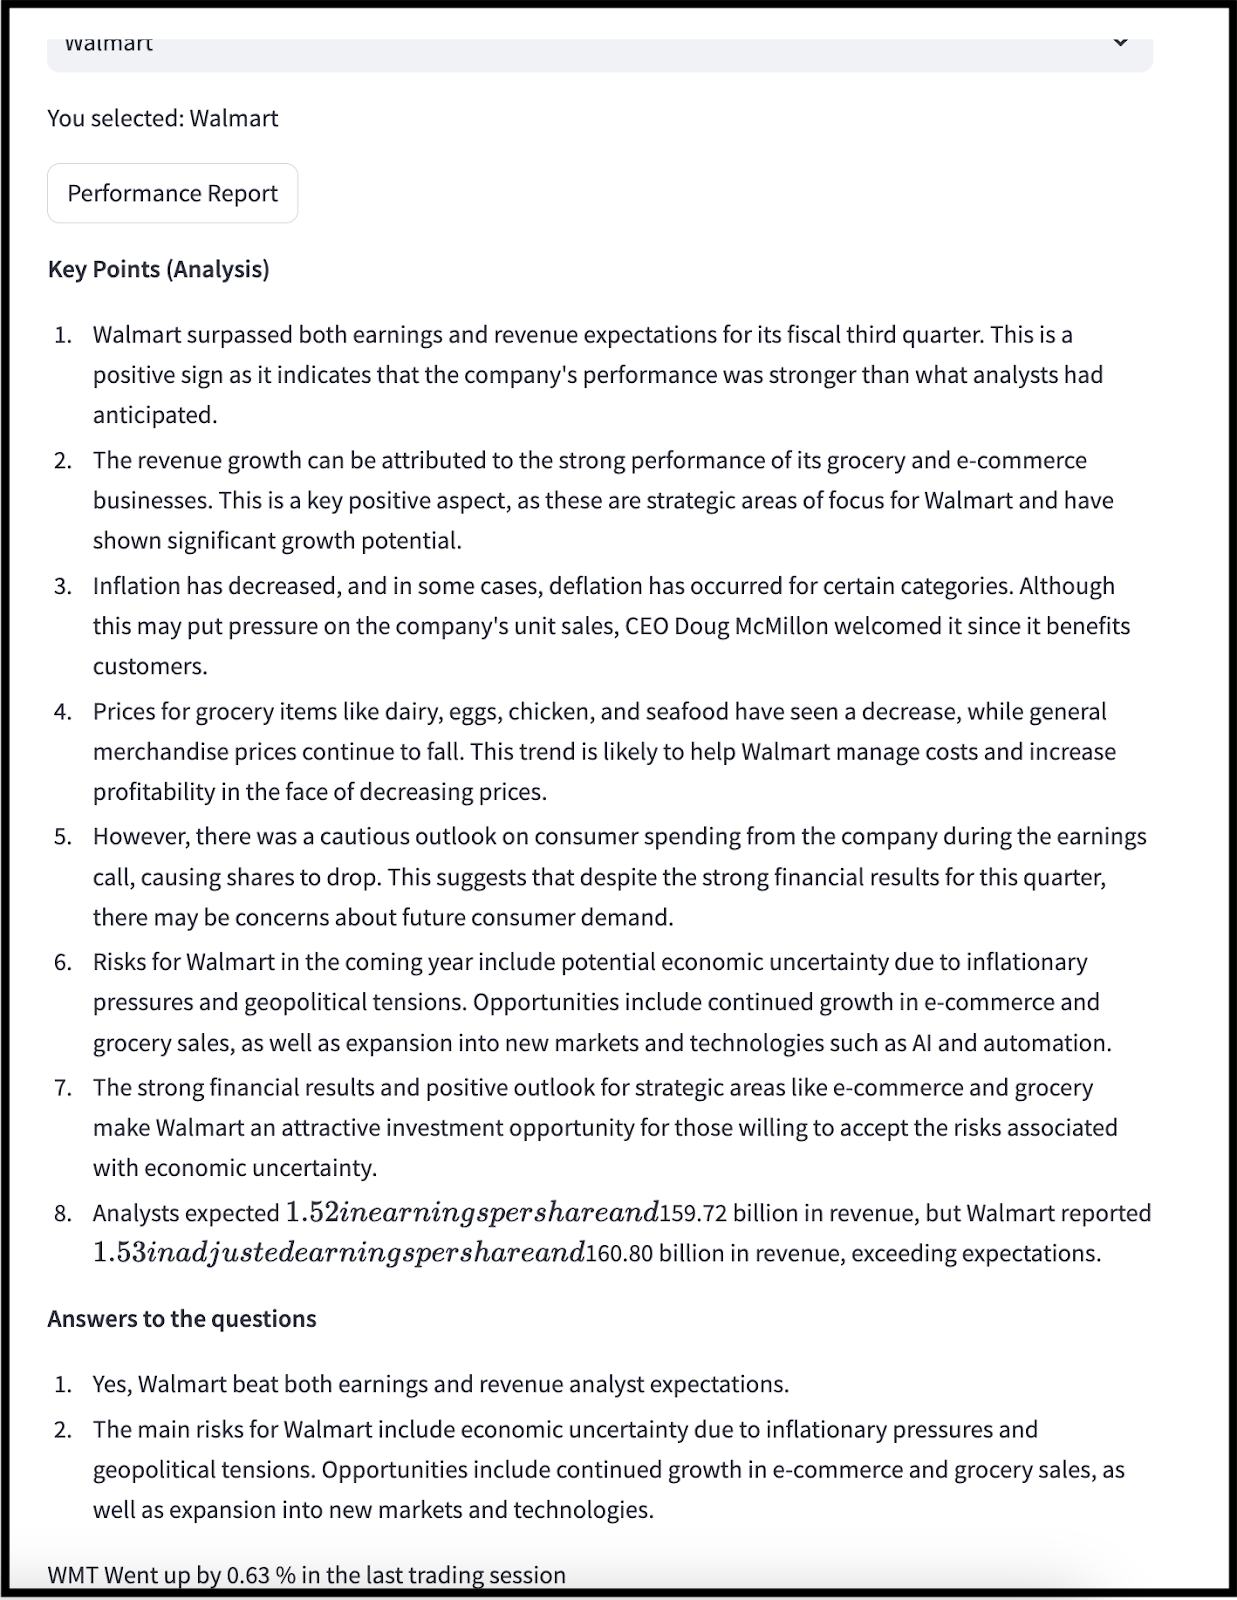
Here's an example illustrating the generation of the analysis report for Walmart.

The initial part of the report focuses on key highlights from the earnings report, outlining both positive and negative aspects. Following this, the report addresses two crucial questions based on the earnings report:
Meeting or Exceeding Analyst Expectations: It evaluates whether the company meets or surpasses the expectations set by analysts.
Identifying Risks and Opportunities: The report delves into the main risks and opportunities the company may encounter in the upcoming year.
Concluding the report, we present the day's price performance and specify the percentage gain or loss in the stock price during the last trading session.
Design and Code Walkthrough
The application is structured into two distinct components. The first part involves collecting and storing data, where we obtain quarterly reports from websites and store them in the Vector DB. In the second part, we focus on retrieval and analysis by fetching pertinent information from the Vector store and presenting a detailed report analysis to the user.
Data Collection and Storage in Vector Store
Acquiring Earnings Report: Initially, our task is to retrieve the earnings report, and in this scenario, we will obtain the company's quarterly results from the CNBC website. Following are a few quarterly report URLs from CNBC: Google Q3 Results, Tesla Q3 Results, Microsoft Q3 Results, etc.
Extracting Content: After obtaining the content, the next step involves parsing it to extract the pertinent information.
Storing in Vector Store: The extracted content is then stored in the Vector store, facilitating easy retrieval during the assessment of earnings.
In the scrape_content function, we provide the URL we wish to scrape. The content is then divided into chunks, which makes it manageable for the LLM during the extraction process. For content extraction, we employ the following prompt:
You are an experienced equity research analyst and you do a fantastic
job of extracting the company's earning information from the
`company's earning report`.

You are instructed that, if the given text does not belong to
`company's earning report` then ignore the text and return only the
text `**NA**`.

You are instructed to extract the exact lines from the
`company's earning report` as it is. Don't update or modify the
extracted lines.

Below is the `company's earning report:
When scraping content from a website, it's normal to encounter different types of noise such as navigation menus, page reference links, banner ads, social media widgets, contact information, and legal disclaimers. To guarantee the cleanliness and relevance of our data, we utilize the LLM. The extract_content function is specifically designed to handle the responsibility of cleaning the data.
The cleaned data, now in the form of a string, undergoes further segmentation into chunks before being inserted into the Qdrant DB. During the creation of these chunked documents, source metadata is added to each document. The source metadata value is generated from the stock ticker symbol, the quarter number, and the year of the report. This proves beneficial when retrieving the report from the vector store. The chunk_text_data function takes charge of constructing the document with metadata, while the insert_data_to_vector_store function is employed to insert the data into the Vector store.
import os

from langchain_core.prompts import ChatPromptTemplate
from langchain.schema.document import Document

from langchain.text_splitter import RecursiveCharacterTextSplitter

from langchain_community.document_loaders import SeleniumURLLoader
from langchain_community.embeddings import OllamaEmbeddings
from langchain_community.llms import Ollama
from langchain_community.vectorstores import Qdrant


# portfolio_summarizer_constants is the constants file which contains
# these 2 variables. The constants file can be found below.
from chat.portfolio_summarizer.portfolio_summarizer_constants import VECTOR_DB_COLLECTION, portfolio

QDRANT_URL = os.getenv("QDRANT_URL")
QDRANT_API_KEY = os.getenv("QDRANT_API_KEY")


CHUNK_SIZE = 1000
CHUNK_OVERLAP = 75

llm = Ollama(model="mistral")
ollamaEmbeddings = OllamaEmbeddings(model="mistral")

cnbc_quarter_report = {
    'GOOGL': {"report_link": 'https://www.cnbc.com/2023/10/24/alphabet-googl-earnings-q3-2023.html', "quarter": "Q3", "year": "2023"},
    'AAPL': {"report_link": 'https://www.cnbc.com/2023/11/02/apple-aapl-earnings-report-q4-2023.html', "quarter": "Q3", "year": "2023"},
    'TSLA': {"report_link": 'https://www.cnbc.com/2023/10/18/tesla-tsla-earnings-q3-2023.html', "quarter": "Q3", "year": "2023"},
    'MSFT': {"report_link": 'https://www.cnbc.com/2023/10/24/microsoft-msft-q1-earnings-report-2024.html', "quarter": "Q3", "year": "2023"},
    'WMT': {"report_link": 'https://www.cnbc.com/2023/11/16/walmart-wmt-earnings-q3-2024-.html', "quarter": "Q3", "year": "2023"}
}


# To locate the earning report, we're meticulously extracting relevant information like financial data,
# key metrics, and analyst commentary from this webpage, while discarding distractions such as navigation menus,
# page reference links, banner ads, social media widgets, contact information, and legal disclaimers.
def extract_content(url):
    template = """You are an experienced equity research analyst and you do a fantastic job of extracting company's earning information from the `company's earning report`.

        You are instructed that, if the given text doesnot belong to `company's earning report` then ignore the text and return only the text `**NA**`.

        You are instructed to extract the exact lines from the `company's earning report` as it is. Don't update or modify the extracted lines.

        Below is the `company's earning report`:
        {earning_report}
    """

    chunked_docs = chunk_web_data(url)
    extracted_text_content = "";
    for doc in chunked_docs:
        prompt = ChatPromptTemplate.from_template(template)
        chain = prompt | llm
        data = chain.invoke({"earning_report": doc}).strip()
        if "**NA**" in data:
            continue
        extracted_text_content += data

    return extracted_text_content


# Breaking down the webpage content into small documents so that it can be passed to the LLM to remove the noise
# from the financial data
def chunk_web_data(url):
    documents = scrape_content(url)
    text_splitter = RecursiveCharacterTextSplitter(
        chunk_size=CHUNK_SIZE, chunk_overlap=CHUNK_OVERLAP)
    return text_splitter.split_documents(documents)


# We are using Selenium to scrape the webpage content of the given URL
def scrape_content(url):
    urls = [url]
    loader = SeleniumURLLoader(urls=urls)
    return loader.load()


# The LLM filtered data is now broken down smaller documents before storing them in the Qdrant Vector store. In the
# metadata we are passing the company ticker, and the quarter and the year of the earning report. This will help in
# fetching the relevant information.
def chunk_text_data(text, ticker, quarter, year):
    text_splitter = RecursiveCharacterTextSplitter(
        chunk_size=CHUNK_SIZE, chunk_overlap=CHUNK_OVERLAP)
    metadata_source = ticker + "-" + quarter + "-" + year
    document = Document(page_content=text, metadata={"source": metadata_source})
    return text_splitter.split_documents([document])


# Using this function we are inserting the docs in the Qdrant DB
def insert_data_to_vector_store(docs):
    Qdrant.from_documents(
        docs,
        ollamaEmbeddings,
        url=QDRANT_URL,
        prefer_grpc=True,
        api_key=QDRANT_API_KEY,
        collection_name=VECTOR_DB_COLLECTION,
    )


# This is the main function which orchestrates the entire flow from fetching content to storing them in the vector store.
def main():
    for entry in portfolio:
        ticker = entry["ticker"]
        company_name = entry["company_name"]

        report_dict = cnbc_quarter_report[ticker]
        report_link = report_dict["report_link"]
        year = report_dict["year"]
        quarter = report_dict["quarter"]

        print("Extracting content for: ", company_name)
        extracted_text_content = extract_content(report_link)

        print("Chunking document for " + ticker + "-" + quarter + "-" + year)
        chunked_docs = chunk_text_data(extracted_text_content, ticker, quarter, year)

        print("Inserting Report to Qdrant for " + company_name)
        insert_data_to_vector_store(chunked_docs)
The name of the database is read from the constants file, which also includes the list of users' stock portfolios. Here is a glimpse of our constants file:
VECTOR_DB_COLLECTION = "stock_earnings_report"

portfolio = [
    {"company_name": "Alphabet", "ticker": "GOOGL"},
    {"company_name": "Apple", "ticker": "AAPL"},
    {"company_name": "Tesla", "ticker": "TSLA"},
    {"company_name": "Microsoft", "ticker": "MSFT"},
    {"company_name": "Walmart", "ticker": "WMT"}
]
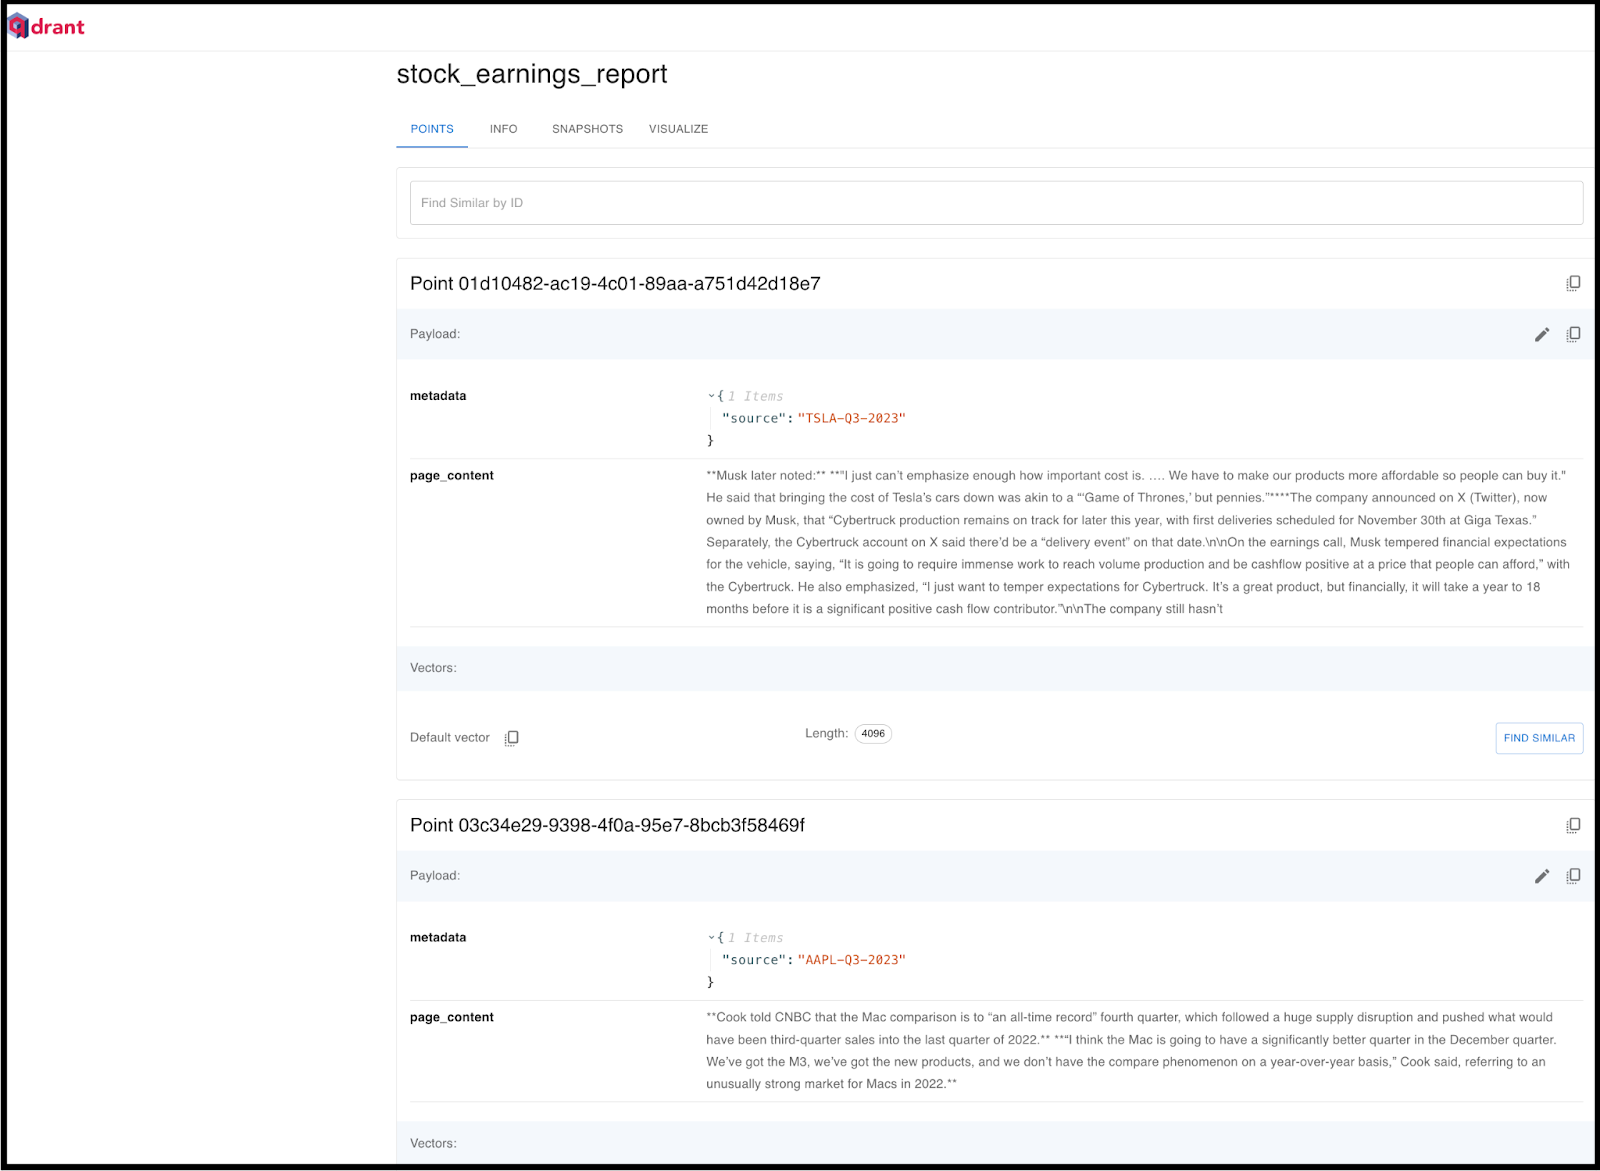
After executing the script, you can verify the successful insertion of all data by accessing the Qdrant DB dashboard. Below, I've included a screenshot from the Qdrant portal, specifically from the stock_earnings_report collection, demonstrating the populated report entries.

Data Retrieval and Analysis
Fetching Information from Qdrant DB: To initiate the process, we retrieve relevant information from the Qdrant DB about the given stock.
Passing Information through LLM: Subsequently, we pass this information through the LLM to obtain an analysis of the company's performance.
Fetching Company Price History: To calculate the day's performance, we acquire the price history of the company.
Merging Analysis and Stock Price Data: Finally, we merge the company performance analysis information with the day's stock price data, presenting a comprehensive overview to the user.
In this section of the code, our focus is on analyzing sentiments towards the company. Initially, we employ the get_earnings_from_vector_store function to retrieve the earnings report from the Vector DB. We pass the specified prompt to the Vector store to extract the relevant documents.
Get the quarterly earning report of {company_name}. Get information
like Revenue, Earnings, Net Income, Expenses, Cash Flow, Guidance,
Market Conditions, Growth Drivers, Challenges, and Management Outlook.
Once we get the documents from the DB, we concatenate them and pass them to the LLM for analysis. Following is the prompt we are using:
You are a stock analyst analyzing {company_name}'s quarterly
earnings report.


Based on the report summarize the sentiment towards the company
and its performance. Identify key positive and negative aspects,
focusing on financial results, future outlook, and investment potential.

Additionally, answer the following questions:
  1/ Does the company meet or exceed analyst expectations?
  2/ What are the main risks and opportunities facing the company
     in the coming year?

Below is the earnings report:
The report_analysis function acts as an orchestrator, guiding the sequence of operations. Initially, it calls the Qdrant vector store to obtain the earnings report of the company. Then it transfers the retrieved earnings report to the LLM for analysis. The complete code can be found below:
import os

from langchain_core.prompts import ChatPromptTemplate

from langchain_community.llms import Ollama
from langchain_community.embeddings import OllamaEmbeddings
from langchain_community.vectorstores import Qdrant

import qdrant_client


# portfolio_summarizer_constants is the constants file which contains
# these 2 variables.
from portfolio_summarizer_constants import VECTOR_DB_COLLECTION, portfolio

QDRANT_URL = os.getenv("QDRANT_URL")
QDRANT_API_KEY = os.getenv("QDRANT_API_KEY")

CHUNK_SIZE = 1500
CHUNK_OVERLAP = 300
LATEST_EARNINGS_QUARTER = "Q3"
LATEST_EARNINGS_YEAR = "2023"

ollamaEmbeddings = OllamaEmbeddings(model="mistral")
llm = Ollama(model="mistral")


# Queries the database to fetch the earnings report of the company
def get_earnings_from_vector_store(portfolio_stock):
    company_name = portfolio_stock["company_name"]
    question = "Get the quarterly earning report of " + company_name + """ Get the information like Revenue,
            Earnings, Net Income, Expenses, Cash Flow, Guidance, Market Conditions, Growth Drivers,
            Challenges and Management Outlook"""

    source_info = generate_db_source_info(portfolio_stock)
    qdrant_retriever = get_qdrant_retriever(source_info);
    result_docs = qdrant_retriever.get_relevant_documents(question)
    print("Number of documents found: ", len(result_docs))

    retrieved_text = ""
    for i in range(len(result_docs)):
        retrieved_text += result_docs[i].page_content

    return retrieved_text


# Generating the source filter which will be used as filter when querying the vector store for better query results
def generate_db_source_info(entry):
    ticker = entry["ticker"]
    return ticker + "-" + LATEST_EARNINGS_QUARTER + "-" + LATEST_EARNINGS_YEAR


# Generates the Qdrant retriever object
def get_qdrant_retriever(source_info):
    qdrant_client_obj = qdrant_client.QdrantClient(
        url=QDRANT_URL,
        prefer_grpc=True,
        api_key=QDRANT_API_KEY)
    qdrant = Qdrant(qdrant_client_obj, VECTOR_DB_COLLECTION, ollamaEmbeddings)
    return qdrant.as_retriever(search_kwargs={'filter': {'source': source_info}, 'k': 2})


# This function is an orchestrator function which controls the flow, first it calls the Qdrant vector store to get
# earnings report of the company. Next it passes the fetched earning report to the LLM to perform analysis.
def report_analysis(portfolio_stock):
    company_name = portfolio_stock["company_name"]
    template = "You are a stock analyst analyzing " + company_name + "'s quarterly earnings report." + """
        Based on the report summarize the sentiment towards the company and its performance. Identify key positive and negative aspects, focusing on financial results, future outlook, and investment potential.

        Additionally, answer the following questions:
        1/ Does the company meet or exceed analyst expectations?
        2/ What are the main risks and opportunities facing the company in the coming year?

        Below is the earnings report:

        {earnings_report}
    """

    earnings_report = get_earnings_from_vector_store(portfolio_stock)
    print("Generating Analysis for " + company_name)

    prompt = ChatPromptTemplate.from_template(template)
    chain = prompt | llm
    return chain.invoke({"earnings_report": earnings_report})


# Performs Earning Analysis of a single company
def get_company_analysis(company_name):
    print("Selected company: ", company_name)
    portfolio_stock = None
    for entry in portfolio:
        if entry["company_name"] == company_name:
            portfolio_stock = entry
            break
    analysed_report = report_analysis(portfolio_stock)
    print("Analysis by LLM: ", analysed_report)
    return analysed_report
From the UI, the get_company_analysis function is invoked with the company_name parameter. This function internally triggers the report_analysis function to generate the analysis and then returns the result in the form of a string.
In this section, we'll delve into the code responsible for fetching the historical price of the company and calculating the price performance. The following code illustrates this process:
import yfinance as yf
from datetime import datetime, timedelta

from portfolio_summarizer_constants import portfolio


def get_daily_price_performance(company_name):
    portfolio_stock = None
    for entry in portfolio:
        if entry["company_name"] == company_name:
            portfolio_stock = entry
            break

    stock_symbol = portfolio_stock["ticker"]
    today = datetime.now()  # Get today's date
    start_date = today - timedelta(days=4)  # Calculate the start date
    start_date_str = start_date.strftime('%Y-%m-%d')

    end_date_str = today.strftime('%Y-%m-%d')

    # Fetch stock data for the given ticker
    stock_data = yf.download(stock_symbol, start=start_date_str, end=end_date_str)

    if not stock_data.empty:
        current_close_price = stock_data['Close'][-1]
        previous_close_price = stock_data['Close'][-2]

        daily_profit_loss = current_close_price - previous_close_price
        profit_loss_percentage = (daily_profit_loss / previous_close_price) * 100

        if daily_profit_loss > 0:
            return f"{stock_symbol} Went up by {profit_loss_percentage:.2f} % in the last trading session"
        elif daily_profit_loss < 0:
            return f"{stock_symbol} Went down {abs(profit_loss_percentage):.2f} % in the last trading session"
        else:
            return "No change in the stock price in the last trading session"
    else:
        print(f"No data available for {stock_symbol} on {end_date_str}")
The above code is straightforward, featuring a singular function named get_daily_price_performance, which is also invoked from the Streamlit UI. This function is designed to retrieve the latest historical price of the company, leveraging the yfinance library. Post that, it compares the prices of the last two days to determine whether the stock's price has risen or fallen. The function then communicates this outcome back to the UI.
Integrating with the Streamlit UI
The final segment involves the integration of backend functions with the Streamlit UI. We've established a dropdown menu featuring the names of various companies from the user’s portfolio. The User can select a company from the dropdown and proceed by clicking the "Performance Report" button. Upon button click, two backend functions, namely get_company_analysis and get_daily_price_performance, are invoked. Subsequently, the responses from both functions are concatenated and presented to the user.
import streamlit as st
import earning_report_analysis
import stock_price_evaluator

selected_company = st.selectbox(
    'Select your stock from portfolio list',
    ('Alphabet', 'Apple', 'Tesla', 'Microsoft', 'Walmart'))

st.write('You selected:', selected_company)
if st.button('Performance Report'):
    analysed_report = earning_report_analysis.get_company_analysis(selected_company)
    price_performance = stock_price_evaluator.get_daily_price_performance(selected_company)
    final_user_report = analysed_report + "\n\n" + price_performance
    st.write(final_user_report)
Summary
In this blog, we endeavored to construct a RAG app utilizing Langchain, Qdrant, and Mistral AI. We aimed to explore the utilization of LLMs for a more profound comprehension of a company's performance, cutting through the noise prevalent in the market. The demonstrated app is intended to showcase the potential of LLMs, serving as a foundation for further refinement to yield more targeted and optimized results.
The system has significant potential for expansion, allowing the incorporation of additional information such as news, analyst prediction, global market trends, etc., which would help with more in-depth analysis. Exploring avenues like peer comparison could provide a broader market perspective, aiding decision-making based on both overall sectoral trends and the performance of competitor companies.
Your input on potential enhancements to the application is highly valued. Please share your ideas in the comment section below; I am eager to learn about your thoughts and suggestions for further improvements.
Additionally, if you have any questions regarding the topic, please don't hesitate to ask in the comment section. I will be more than happy to address them. You can find the code of this application in Github.
I regularly create similar content on LangChain, LLMs, and related AI topics. If you'd like to read more articles like this, consider subscribing to my blog.
If you're in the Langchain space or LLM domain, let's connect on Linkedin! I'd love to stay connected and continue the conversation. Reach me at: linkedin.com/in/ritobrotoseth
Subscribe to my newsletter
Read articles from Ritobroto Seth directly inside your inbox. Subscribe to the newsletter, and don't miss out.
Written by
