Candlestick Pattern
 Bijay Tamang
WHAT IS CANDLESTICK?(क्यान्डलस्टिक भनेको के हो ?)
A candlestick is a type of price chart used in technical analysis to depict the price movements of a financial instrument, such as stocks, currencies, or commodities. It comprises individual "candlesticks" representing trading activity over a specific period, such as minutes, hours, days, or weeks.
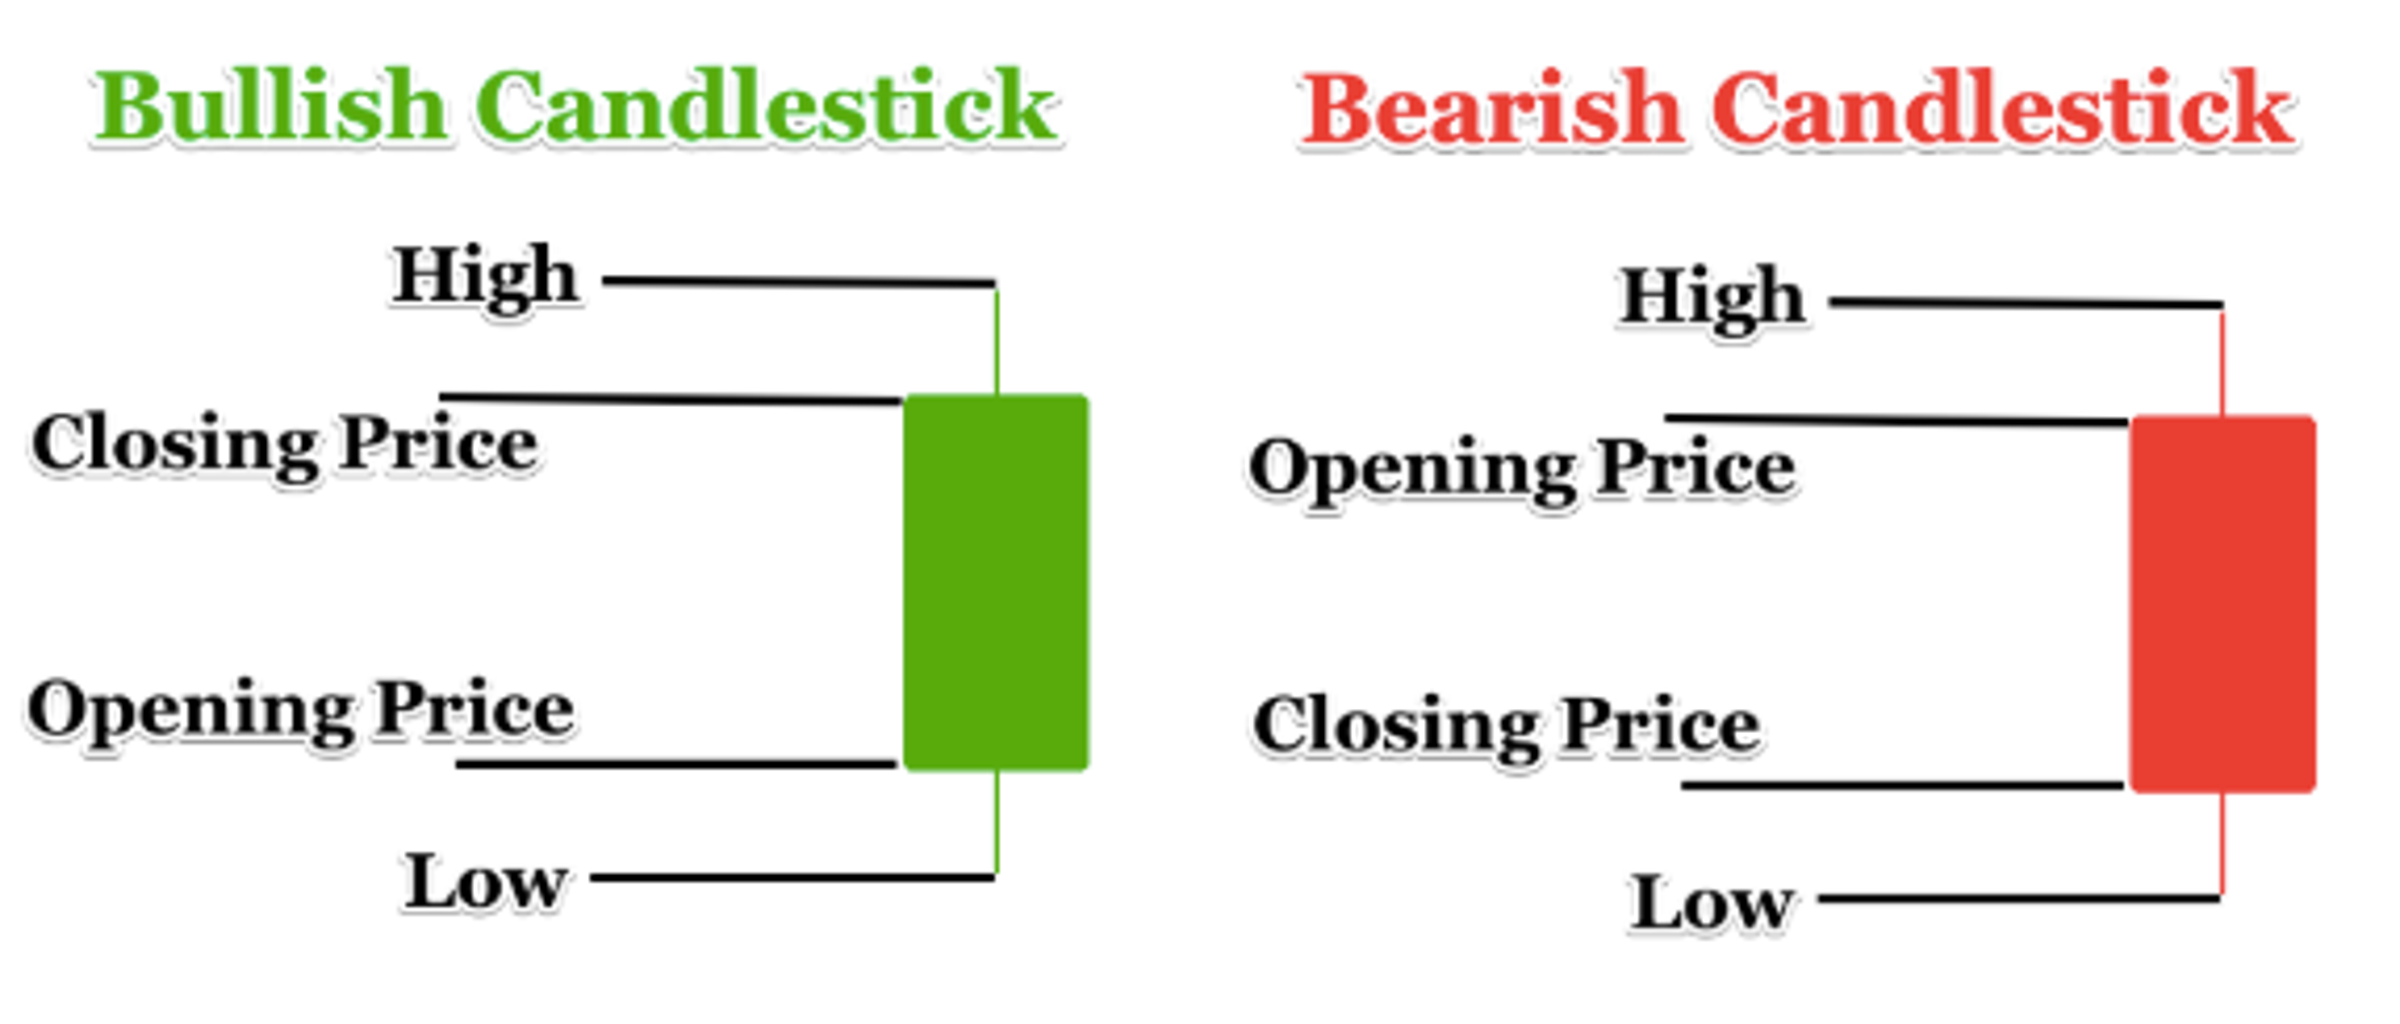
Each candlestick typically has four main components:
Open: The price at which the trading period began.
High: The highest price reached during the trading period.
Low: The lowest price reached during the trading period.
Close: The price at which the trading period concluded.
The body of the candlestick represents the price range between the open and close prices, with the color of the body typically indicating whether the closing price was higher (bullish, often depicted as white or green) or lower (bearish, often depicted as black or red) than the opening price. The thin lines extending from the top and bottom of the body, called "wicks" or "shadows," represent the high and low prices for the period, respectively.
Traders and analysts widely use candlestick charts to identify patterns and trends in price movements and make predictions about future price movements based on historical data. There are numerous candlestick patterns, each with its interpretation and significance in technical analysis.
IN NEPALI:
क्यान्डलस्टिक तकनिकी विश्लेषणमा प्रयोग गरिने एक प्रकारको मूल्य चार्ट हो जुन आर्थिक साधन, जस्तै कि स्टक, मुद्रा, वा कमोडिटीहरूको मूल्य गतिहरू दर्शाउँछ। यसमा विशिष्ट कालावधिमा व्यापारिक गतिविधि प्रतिनिधित्व गर्दछन् "क्यान्डलस्टिक" हुन्छन्, जस्तै मिनेट, घण्टा, दिन, वा सातहरू।
प्रत्येक क्यान्डलस्टिकमा सामान्यतया चार मुख्य घटकहरू छन्:
खुला: व्यापारको कालावधि सुरु भएको मूल्य।
उच्च: व्यापारको कालावधि दर्ता गरिएको सबैभन्दा उच्च मूल्य।
निम्न: व्यापारको कालावधि दर्ता गरिएको सबैभन्दा निम्न मूल्य।
बन्द: व्यापारको कालावधि समाप्त भएको मूल्य।
क्यान्डलस्टिकको शरीरले खुला र बन्द मूल्यहरू बीचको मूल्य श्रेणी दर्शाउँछ, जसमा शरीरको रंग सामान्यतया देखाउँछ कि बन्द मूल्य खुल्ने मूल्यभन्दा उच्च (बुलिस, साधारणतः सेतो वा हरियो रूपमा देखाइन्छ) वा कम (बियरिश, साधारणतः कालो वा रातो रूपमा देखाइन्छ) हो। शरीरको बाटोबाट फैलिएका पतली लाइनहरू, "झुल्का" वा "छायांहरू" भनिन्छ, तोप र तल्लो दर्ता, व्यापारको कालावधिका लागि उच्च र निम्न मूल्यहरूको प्रतिनिधित्व गर्दछ।
व्यापारी र विश्लेषकहरू क्यान्डलस्टिक चार्टहरू प्रयोग गर्छन् ताकि मूल्य गतिहरूमा पैटर्न र रुचिहरूलाई पहिचान गर्न सकून र ऐतिहासिक आंकडामा आधारित भविष्यका मूल्य गतिहरूको अनुमान गर्न सकून्। केहि नेपाली मान्यताहरू, व्याख्या र तकनिकी विश्लेषणमा आफ्नो अर्थ छन्।


In candlestick charting, a hammer is a bullish reversal pattern that forms after a decline in price. It is characterized by a single candlestick with a small body near the top of the price range and a long lower shadow, resembling a hammer. The hammer pattern indicates that despite the initial selling pressure, buyers managed to push the price back up, usually signaling a potential reversal from a downtrend to an uptrend.
Key features of a hammer pattern include:
Small Body: The body of the candlestick is typically small, indicating a narrow trading range between the open and close prices.
Long Lower Shadow: The most distinctive feature of a hammer is its long lower shadow, which extends below the body of the candlestick. This long lower shadow suggests that sellers drove the price significantly lower during the trading session, but buyers managed to regain control by pushing the price back up to close near the high of the session.
No or Small Upper Shadow: Ideally, a hammer should have little to no upper shadow, but in some cases, a small upper shadow may be present.
The hammer pattern is considered more reliable when it appears after a prolonged downtrend and is often interpreted as a bullish signal. However, traders typically look for confirmation from subsequent price action, such as a higher close on the following trading day, to confirm the reversal signal.
It's worth noting that while the hammer pattern can indicate a potential reversal, like any technical analysis tool, it is not foolproof and should be used in conjunction with other indicators and analysis techniques for making trading decisions.
IN NEPALI:ह्यामर (Hammer) एक बुलिस रिभर्सल प्याटर्न हो जुन घट्यो बजारमा मूल्यमा कमी आएको पछि बन्दैछ। यसको विशेषता छ एक मात्रा क्यान्डलस्टिक हुँदैछ जसमा लामो तल्लो सारी र सीमाना निकट मार्जिन भएको छ, जसले ह्यामरको सार्ट कोर्दिन्छ। ह्यामर प्याटर्नले देखाउँछ कि प्रारंभिक बेच्ने दबाव पनि, खरिददारहरूले मूल्यलाई फेरि उच्चतर मार्जिनमा उठाएका छन्, झट्टै घट्यो बजारमा उल्टाएको चिन्ह हो, जसले सामान्यतया निम्नता भट्किएको बाजारबाट बढी मूल्य लिने संकेत गर्दछ।
ह्यामर प्याटर्नको मुख्य विशेषताहरू शामिल हुन्छन्:
सानो शरीर: क्यान्डलस्टिकको शरीर सामान्यतया सानो हुन्छ, जसले खुल्दा र बन्द हुने मूल्यमा सार्वजनिक व्यापारिक सीमाना देखाउँछ।
लामो तल्लो सारी: ह्यामरको सबैभन्दा पहिलो विशेषता छ लामो तल्लो सारी, जो क्यान्डलस्टिकको शरीरबाट तल्लो फर्किएको छ। यो लामो तल्लो सारीले सुझाव दिन्छ कि विक्रेताहरूले व्यापारिक कार्यको दौरान मूल्यलाई काफी धेरै कम गरेका छन्, तर खरिददारहरूले मूल्य फेरि उच्चतर मार्जिनमा उठाएका छन्, सार्वजनिक खरिद गर्ने संकेत दिन्छ।
कुनै उपरको सारी छैन वा सानो सारी: पर्याप्त बोल्नुपर्छ, ह्यामरमा कुनै उपरको सारी छैन, तर केहि मामिलामा, सानो उपरको सारी उपस्थित हुन सक्छ।
ह्यामर प्याटर्न आउने पछि एकल दिनको बजारी कार्यक्रमबाट उच्च मूल्यबाट पुष्टि पाइएको बिर्सनै हुन्छ, त्यसैले बजारी पुन: फेरि आउने किसिमको रुखको पुष्टि गर्दछ।
ह्यामर प्याटर्नले संकेत गर्दछ कि संभावित उल्टाएको बाजारबाट उच्च मूल्यमा फिर्ता प्रतिवर्तन हुँदैछ, तर सबै तकनिकी विश्लेषण औजारहरूको जस्तै, यो पनि पूरा भएको होइन र वित्तीय निर्णय गर्नका लागि अन्य संकेतिकहरू र विश्लेषण उपयोग गर्नुपर्छ।
Subscribe to my newsletter
Read articles from Bijay Tamang directly inside your inbox. Subscribe to the newsletter, and don't miss out.
Written by
