Six month blog "performance review"
 Chris Chapman
This is a Friday "bonus" post for newsletter subscribers. Thank you for being subscribers!
I started this blog six months ago — and it is a good milestone to review how the blog is performing. In this short post, I review performance with an eye to UX metrics.
Top Goals
I had three goals for the blog:
Add content of interest to Quant UXRs, especially readers of the Quant UX book. I wanted the blog posts to: (1) add content following the style of the Quant UX book (and R book), combining method discussions and R code; and (2) discuss other current topics of general interest. I think the blog has accomplished that with posts like this one on sentiment analysis.
Score: OK.Advance best practices in research. Quant UX Research is a new field and I hope that I can add a social science perspective that helps to ground it in best practices. Examples include my two series on pseudoscience and LLMs.
Score: OK.Stop myself from writing another book. I'm serious! In 2023, I had many ideas for a "next book" and would have started it ... but didn't welcome a commitment of 2+ years. I hoped a blog would save me from starting a new book prematurely.
Score: Good so far (LOL) ... but that may change.
HEART UX Metrics
I'm a long-time fan of the HEART metrics framework. It was described and promoted by Kerry Rodden and others at Google before I worked there. In my time at Google, I ran many HEART workshops with many product teams (my teams and others).
Here's how I see the HEART Framework aligned to this blog.
Happiness. I have no systematic data about happiness for the blog. The comments I receive are almost all positive ... which makes me happy, but may be self-selected.
Engagement. The best statistic I have for engagement is time on page, which has been steady for months at ~1:45 (1 min & 45 sec). I don't have comparative data, but at least a large fraction of users are reading posts and are not immediately fleeing!
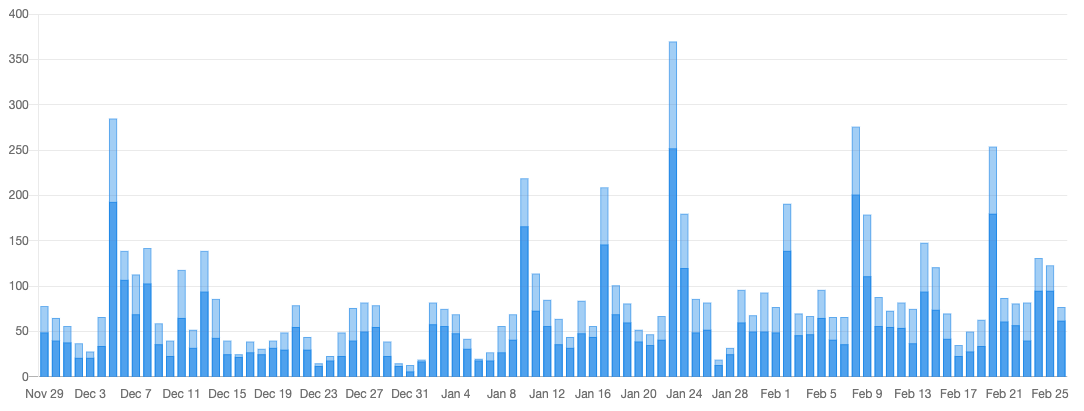
Adoption. Just this week, the blog passed 20,000 views. The number of views has been growing steadily every month, with gradually higher peak views and an overall increasing trend of daily and unique viewers. Here are the last 3 months (views are in light blue, and daily unique visitors in dark blue):

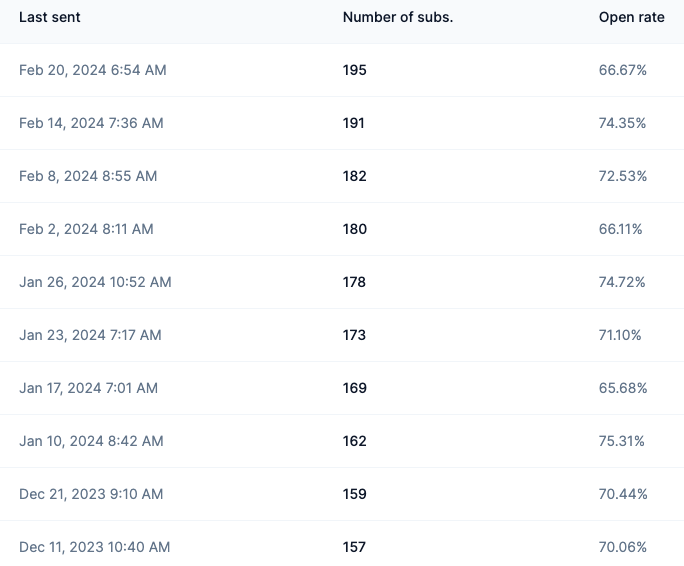
- Retention. As shown in the chart above, unique visitors read more than 1 post, on average (total views > unique visitors), and that is one sign of retention. But the best retention stat I have is the number of subscribers — readers who not only visit but then sign up for the newsletter. That is growing and approaching 200 subscribers. The open rate is around 70% for each newsletter. Here are stats for the past 10 newsletters (posts):

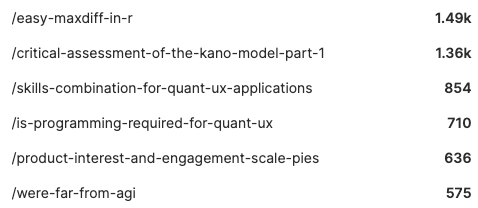
Task Success. For task success, I have no data ... apart from the fact that the views and open rates are consistent with success. Posts typically get 500+ views, indicating success. FWIW, here are the current top 6 posts. They reflect interested in my diverse set of topics, ranging from R to LLMs to methods.

Takeaways
The blog goals are being met — especially the goal of "no book". I'll keep writing!
Readership exceeds expectations. I expected around 50 interested readers, but it's higher. I hope it continues to be of interest!
For this style of blog — that integrates code with markdown — Hashnode hosting has been perfect. I wish it had some extra features, but it is simple.
Thank YOU for reading the blog
I appreciate readers' engagement! If you have comments about what you like or don't like ... I'd love to hear what you like. (I'll tolerate hearing what you don't like!)
Leave comments here, or contact me at the usual places (see here).
Finally, I'll highlight my personal top 3 favorite posts so far:
Why we're far from AGI (draws on my psychology and philosophy background)
Easy MaxDiff in R (promotes MaxDiff surveys, with an R-based demo)
Multidimensional sentiment analysis (R code for a favorite set of methods)
Cheers!
But wait ... there actually is some R code
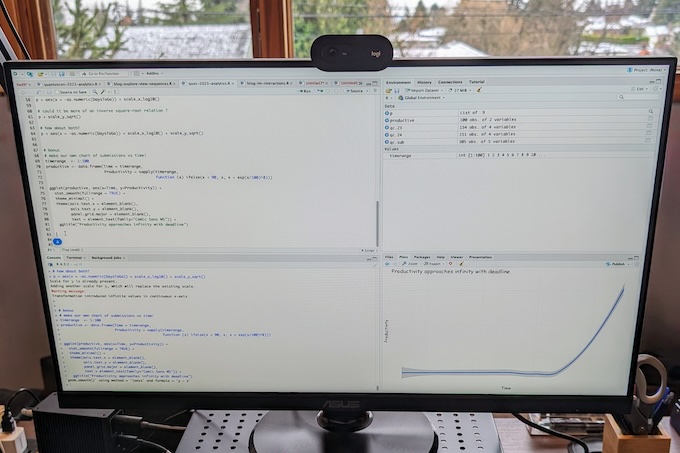
The cover photo for this post shows my RStudio setup when I was working on a recent post about time estimation for Quant projects. The R code is in that post.
Subscribe to my newsletter
Read articles from Chris Chapman directly inside your inbox. Subscribe to the newsletter, and don't miss out.
Written by

Chris Chapman
Chris Chapman
President + Executive Director, Quant UX Association. Previously: Principal UX Researcher @ Google | Amazon Lab 126 | Microsoft. Author of several books, including "Quantitative User Experience Research" and "[R | Python] for Marketing Research and Analytics".