Capturing Performance: JMeter Recorder
 Pankaj Suryavanshi
Introduction
The JMeter Recorder is a vital tool in performance testing, allowing testers to easily record user interactions with web applications. By capturing these interactions, it simplifies the creation of test scripts, making it easier to simulate real-world scenarios accurately.
JMeter Scripting Techniques
JMeter offers various methods for recording scripts to simulate user interactions and conduct performance testing. In this guide, we'll explore three popular approaches: using the JMeter HTTP(S) Test Script Recorder, the BlazeMeter Chrome Extension, and manually creating scripts.
1. JMeter HTTP(S) Test Script Recorder
Step 1: Set Up JMeter
- Ensure JMeter is installed on your machine. Download it from Apache JMeter.
Step 2: Configure Browser Proxy Settings
Open JMeter.
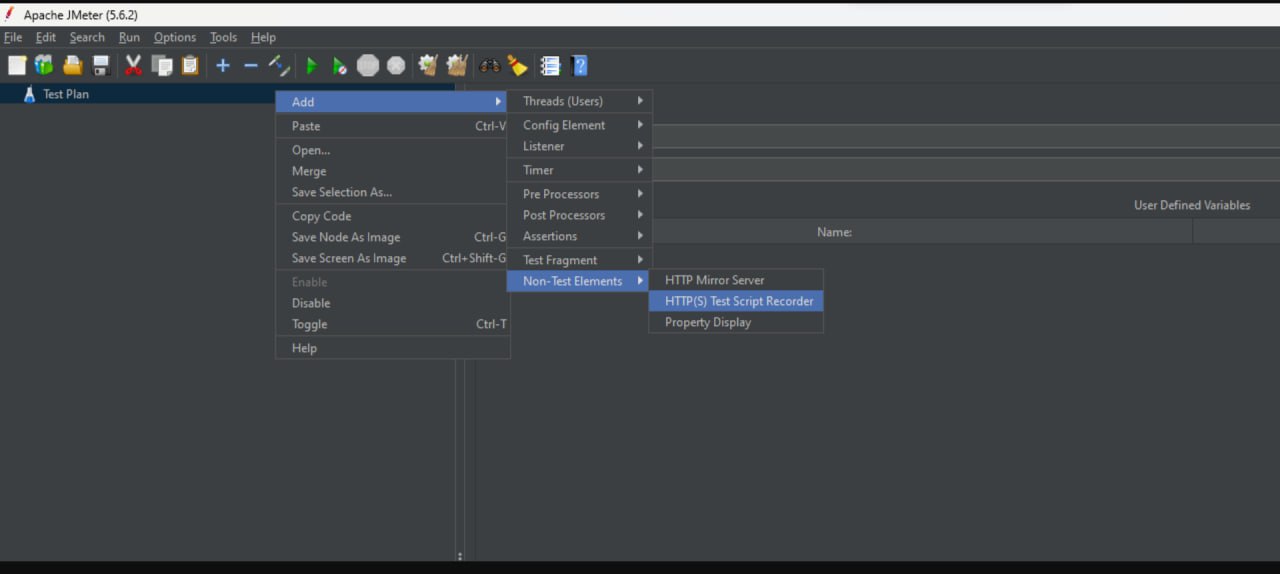
Go to "TestPlan" -> "Non-Test Elements" -> "HTTP(S) Test Script Recorder."

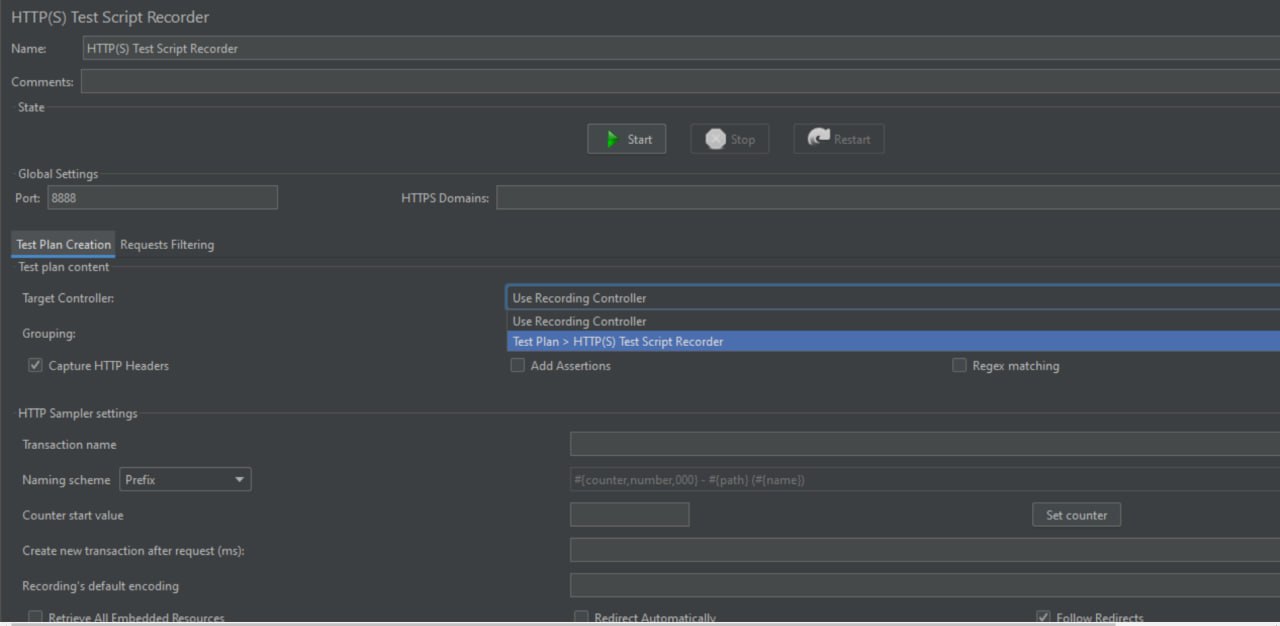
Set the port number and change the transaction controller.

Set the Target controller to Test Plan -> Http(s) Test Script Recorder
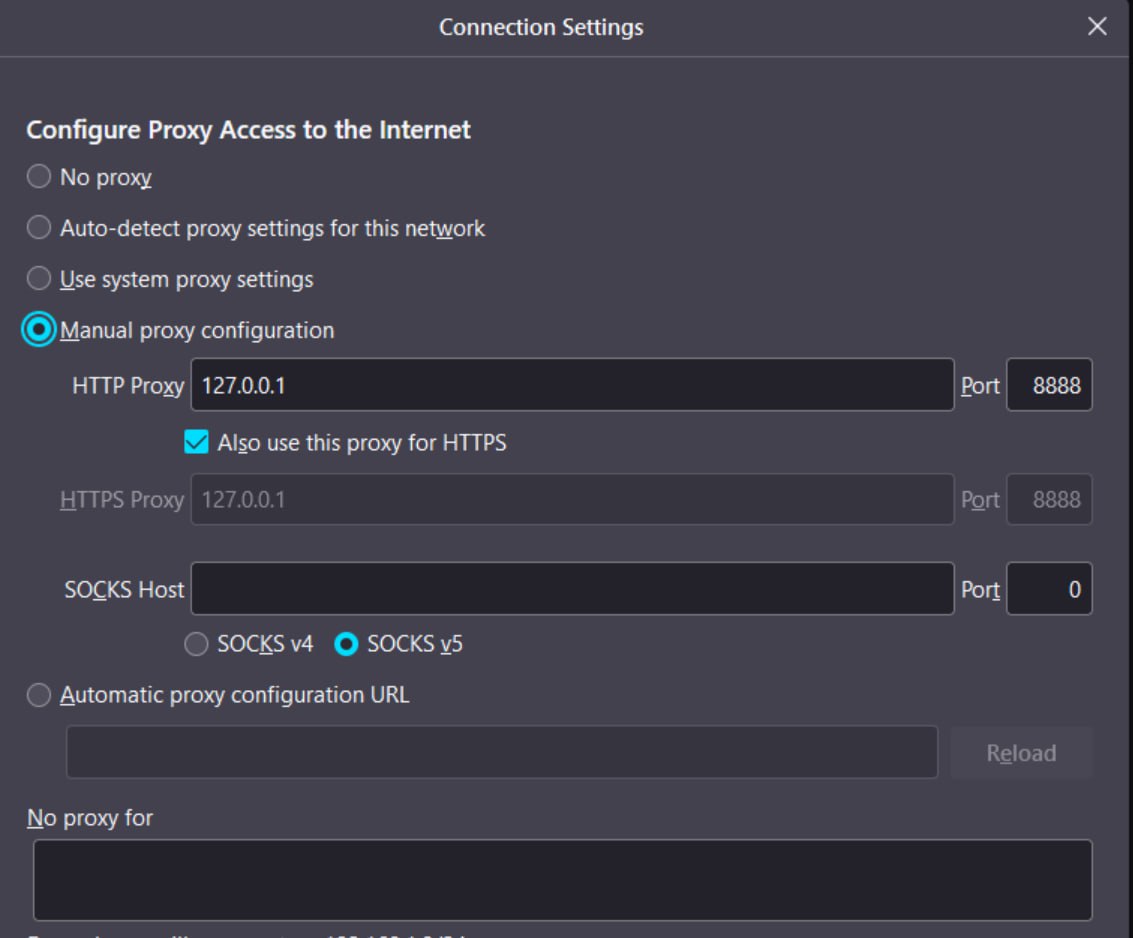
Configure your browser's proxy settings to use the JMeter proxy (localhost:8888).In our case, change the "Network settings" in Firefox browser as shown below.

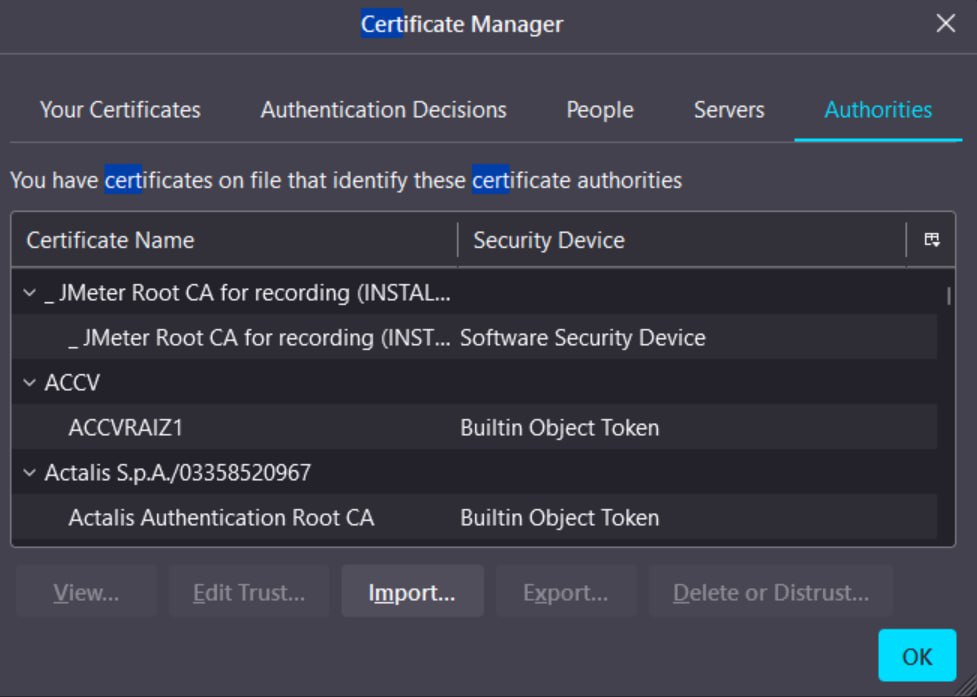
Import the Temporary certificate provided by JMeter from the JMeter/bin folder with "ApacheJMeterTemporaryRootCA" name.

Step 3: Record the Scenario
Start the Recording Button.
Navigate to your application using the browser.
JMeter records the requests and responses in real-time.
Stop the recorder in JMeter when recording is complete.
Step 4: Add Listeners and Run the Test
Add Thread Group And Paste whole Script in thread group.
Add Listeners (e.g., View Results Tree, Summary Report).
Save the test plan.
Run the test to analyze results.
2. BlazeMeter Chrome Extension
Step 1: Install BlazeMeter Chrome Extension
Install the BlazeMeter Chrome Extension from the Chrome Web Store.
Create a BlazeMeter account if you don't have one.
Step 2: Record the Scenario
Open the BlazeMeter Chrome Extension.
Click "Start Recording."
Navigate through your application's workflow.
Stop the recording when done.
Step 3: Export to JMeter
Export the recorded script as a JMeter (.jmx) file.
Open the exported JMX file in JMeter.
3. Manual Script Creation
Step 1: Create a New Test Plan
Open JMeter and create a new test plan:
Navigate to "File" > "New" > "Test Plan."
Provide a name for your test plan and save it: Navigate to "File" > "Save Test Plan As" and specify a file name.
Step 2: Add Thread Group
Right-click on the test plan.
Go to "Add" > "Threads (Users)" > "Thread Group."
Configure the Thread Group:
Set the number of threads (virtual users).
Set the loop count or duration.
Step 3: Add Sampler for HTTP Request
Right-click on the Thread Group.
Go to "Add" > "Sampler" > "HTTP Request."
Configure the HTTP Request:
Provide the server name or IP address.
Set the path.
Configure any necessary parameters.
Step 4: Add Listeners for Viewing Results
Right-click on the Thread Group.
Go to "Add" > "Listeners" and choose the appropriate listener for viewing results, such as "View Results Tree" or "Summary Report."
Step 5: Run the Test
Save your test plan.
Click the "Run" menu and select "Start" or use the "Run" button.
Choose the recording method that best suits your testing needs. Whether using the built-in recorder, BlazeMeter extension, or manual script creation, JMeter provides flexibility for creating effective performance tests.
Conclusion
In conclusion, the JMeter Recorder streamlines script creation for performance testing by accurately capturing user interactions. Its simplicity and effectiveness make it an essential component for ensuring the reliability and efficiency of web applications.
Subscribe to my newsletter
Read articles from Pankaj Suryavanshi directly inside your inbox. Subscribe to the newsletter, and don't miss out.
Written by

Pankaj Suryavanshi
Pankaj Suryavanshi
Experienced QA Automation Engineer with 3.5 years in Ecommerce and Banking, skilled in automation/manual testing, test planning, execution, and end-to-end project delivery. Proficient in Agile, Scrum, performance testing, and SDET practices