A Comprehensive Guide to Handling Missing Values in Data Analysis
 Muhammad Talha
Introduction:
Missing values, often referred to as "missing data," are a prevalent challenge in data analysis. They can arise from various reasons, such as data collection errors, human error during data entry, or incomplete information inherently present in the data source. These missing values can significantly impact the accuracy and reliability of our analytical results if left unaddressed.
This blog post delves into various techniques and provides Python code snippets to effectively identify and handle missing values in a dataset, using the well-known Titanic dataset as a practical example. Through this exploration, we aim to equip you with the knowledge and tools to confidently tackle missing values in your data analysis endeavors.
Identifying Missing Values:
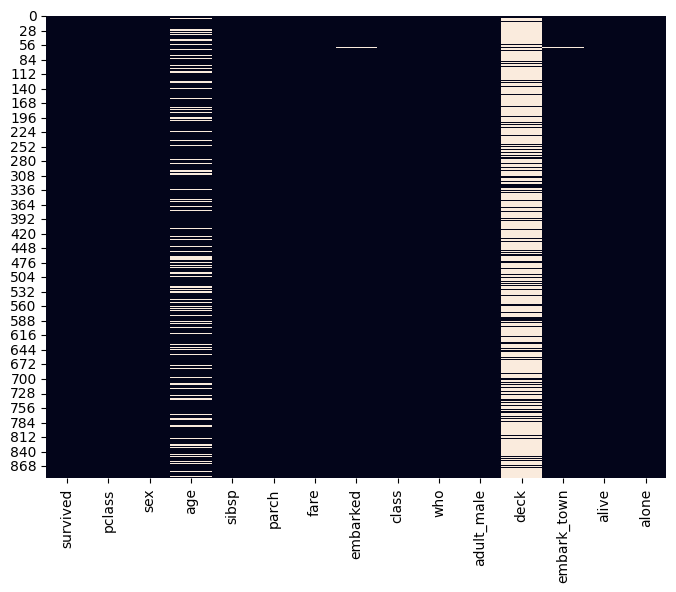
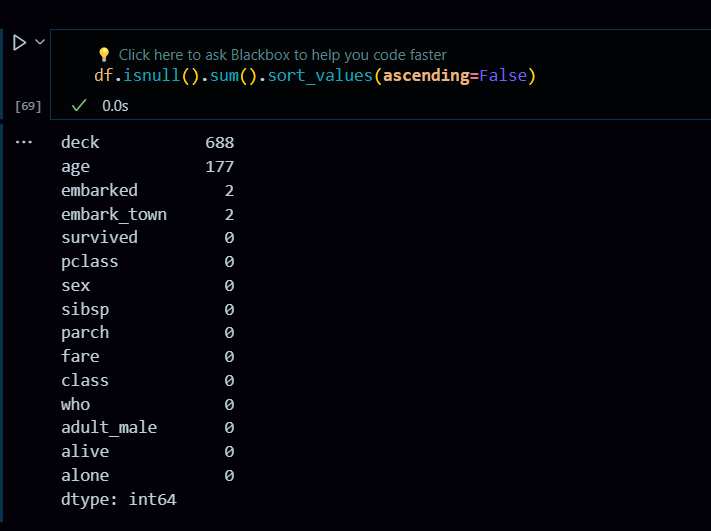
Our journey begins with loading the Titanic dataset using the seaborn library. We then glimpse the initial few rows to gain a preliminary understanding of the data structure and variables present. To uncover the missing value landscape, we utilize seaborn to generate a heatmap. This visual representation offers valuable insights into the distribution and extent of missing values across different columns within the dataset.
Code Snippet:
Python
import pandas as pd
import numpy as np
import matplotlib.pyplot as plt
import seaborn as sns

# Load the Titanic dataset
df = sns.load_dataset("titanic")
df.head()

plt.figure(figsize=(8, 6))
sns.heatmap(df.isnull(), cbar=False)
plt.show()
Output:

Explanation:
The generated heatmap displays each column as a vertical axis and each row as a horizontal axis. The intensity of the colour (typically white for missing values) in each cell signifies the proportion of data points within that specific column-row combination containing missing values. By analyzing the heatmap, we can readily identify columns with significant missing values, guiding our subsequent decisions on handling these crucial data points.

Handling Missing Values:
This section of the blog post delves into various techniques for addressing missing values, each accompanied by a corresponding Python code snippet and detailed explanation. We discuss the following methods, highlighting their applicability and limitations:
Simple Imputation:
This approach replaces missing values with a single value, such as the mean, median, or mode, calculated from the existing data within the same column. While straightforward and applicable to various scenarios, it might introduce bias if the distribution of the data is skewed or the missing values are not randomly distributed (Missing Not At Random - MNAR).
Code Snippet:
Python
from sklearn.impute import SimpleImputer

imputer = SimpleImputer(strategy='median')
df["age"] = imputer.fit_transform(df[["age"]])
df.isnull().sum()
Iterative Imputation:
This method utilizes a more sophisticated approach, iteratively estimating missing values based on the values of other features in the same data point (multivariate imputation). It leverages statistical techniques to predict missing values by considering the relationships between different variables, potentially leading to more accurate imputations compared to simple imputation. However, it can be computationally expensive for large datasets and requires careful consideration of model parameters.
Code Snippet:
Python
from sklearn.experimental import enable_iterative_imputer
from sklearn.impute import IterativeImputer

itr_imputer = IterativeImputer(max_iter=20)
df["age"] = itr_imputer.fit_transform(df[["age"]])
df.isnull().sum()
K-Nearest Neighbors (KNN) Imputation:
This technique identifies the 'k' nearest neighbors (data points most similar to the one with the missing value) based on the available features and uses the average value of those neighbors' corresponding features to estimate the missing value. KNN imputation can be advantageous when dealing with categorical data or non-linear relationships, but it relies heavily on the choice of the 'k' parameter and can be computationally expensive for larger datasets.
from sklearn.impute import KNNImputer

imputer = KNNImputer(n_neighbors = 5)
df["age"] = imputer.fit_transform(df[["age"]])
Dropping Rows or Columns:
This approach involves removing entire rows or columns containing missing values. While seemingly simple, it can lead to significant data loss, potentially impacting the generalizability and representativeness of the remaining data. Dropping rows or columns should be considered only if the proportion of missing values is very high and alternative methods are deemed unsuitable.
df2.dropna(inplace=True)  # drop all the rows  having null values

df2.isnull().sum()
Choosing the Right Technique:
The optimal approach for handling missing values depends on several factors, including:
The nature of the missing data: Are the missing values Missing Completely At Random (MCAR), Missing At Random (MAR), or MNAR? Techniques like simple imputation work best for MCAR data, while iterative imputation or KNN imputation might be better suited for MAR data. Addressing MNAR data often requires more advanced techniques or domain knowledge.
The amount of missing data: If the proportion of missing values
Do let me know if you have any questions
Subscribe to my newsletter
Read articles from Muhammad Talha directly inside your inbox. Subscribe to the newsletter, and don't miss out.
Written by

Muhammad Talha
Muhammad Talha
.root / cs / Frontend Developer / DevOps / Cloud.....