Transcript and slides
 Aleksandr Novikov
How To Catch Graphs With Linked Lists And Generics
It’s great to be with you today. I’m Alexander Novikov. I’ve been fascinated by graphs for many years. They say you can picture anything as a graph. I took this phrase literally. I work on a database where you can put text and video and other information as well.
In this talk I’m going to cover a number of topics. Here is my short plan.
First, I’m going to convince you that graphs are important.
Next, I’ll present to you a data structure that I’ve come up with for graphs.
In the end, you’ll see how a domain can be modeled using Scala generic types. I use this approach in my current project.
So, let’s begin. Why do I think graphs are important for us?
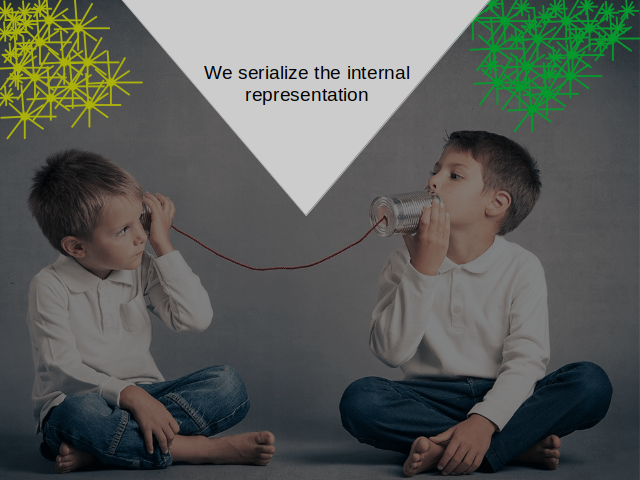
It's pretty obvious that we rely on associations in our mental processes. And associations build a sort of a graph. Our concepts too build an interconnected graph of definitions. Wikipedia is a vivid example of it. In communication though we transform internal representation into a sequence of sounds.

These boys are testing a new communication line. The boy on the right wants to pass a message to his friend. We can’t know what he is about to say. This information is present only in his mind.
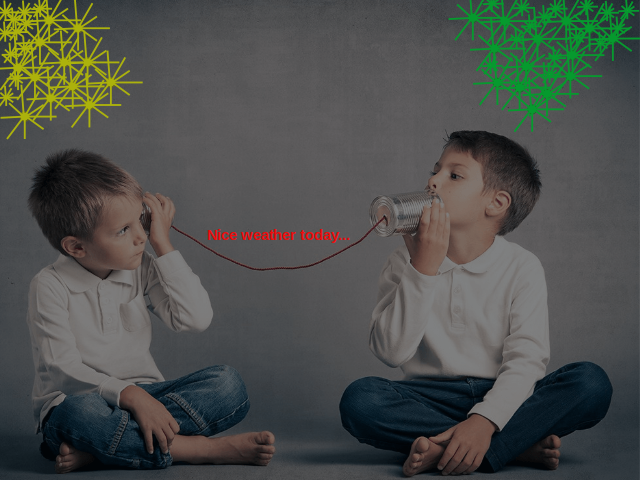
Now he articulates some words. These words come sequentially, one after the other. The relations between words are hidden. They are encoded in a form that is specific to a particular natural language.

The boy on the left knows this language. That’s why he is able to decode the message. And a network of associations lights up in his mind.
So, what is the novelty of the project, that I’m working on? The goal is to keep and to send information in the form of a graph.
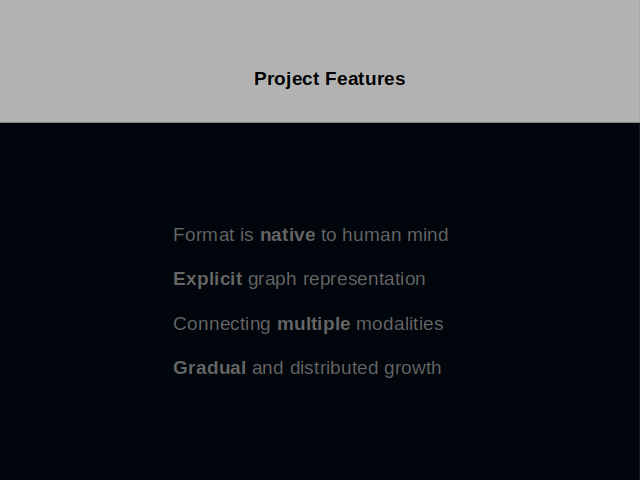
Here I listed the features of the project.
As I’ve shown you, the format is native to human mind. We sometimes borrow inventions of the nature, and it brings new, often unexpected, opportunities. In this project, we explore what we can get.
A crucial decision was to represent all connections explicitly. There is no need to reconstruct them on receiving a message. A machine can compare it to the graph it has already accumulated.
Multiple channels of perception get recorded in one go. Relations between their parts provide meaning to each channel over its bounds. It can solve the problem of naming one thing different names.
It is expected that the amount of data will grow gradually. Fresh data will emerge at a number of unrelated locations. And with time passing these scattered databases will begin contacting each other. There is no centralized board of experts creating an ontology that should be useful for everyone.
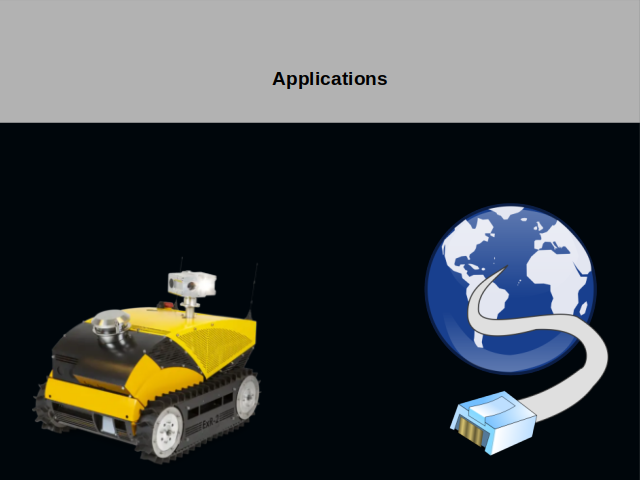
You would agree, the denser the connections between pieces of data the more value it gives us. Possible applications range from creating a new variety of sites on the Internet to robotics.
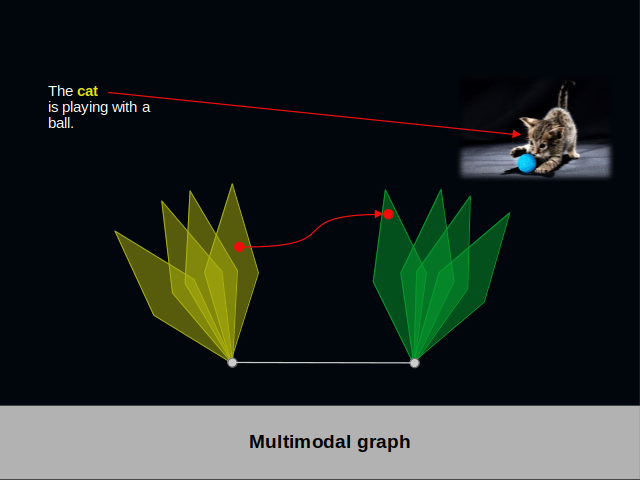
To illustrate what a multimodal graph is, I took textual modality and visual modality.
In this slide you encounter some text about a cat and a picture of this cat. In your mind you associate the letters in the word “cat” to the collection of pixels in the center of the image. In the multimodal graph below we find the word as a red vertex in a yellow pyramid. The collection of pixels is the vertex in a green pyramid. An explicit red edge connects both vertices.
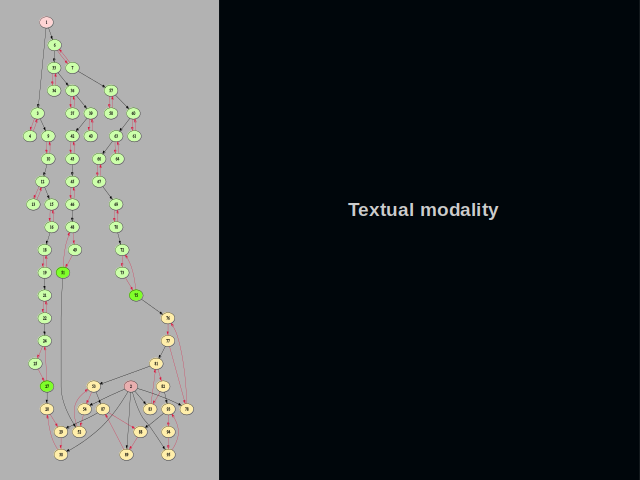
What does a multimodal graph look like? As an example, let’s take the textual modality. This modality keeps connections between letters, words and phrases.
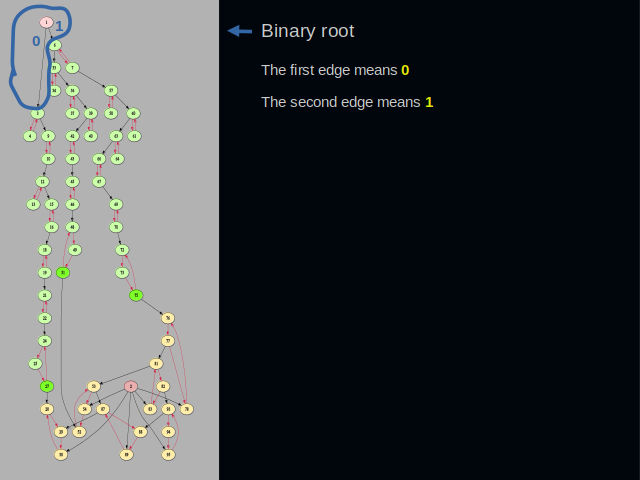
At the top, we have the root vertex of the binary layer. Its first edge means zero. Its second edge means one. The root vertex is the starting point when writing any word. Binary character codes spring off the root vertex. This layer of a graph is idempotent. Character codes don’t get duplicated.
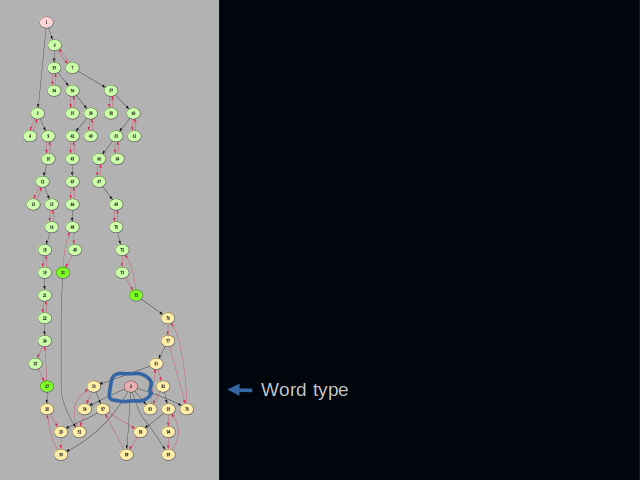
At the bottom of the slide, we have a type vertex. All word clusters get connected to it. The type vertex helps when a vertex ID needs to be converted back into a string. IDs not connected here are not words and must not be processed.
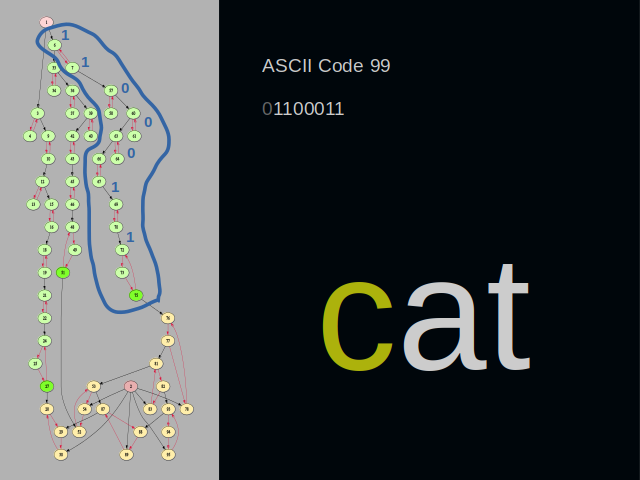
I have drawn a blue line around clusters that represent the letter c. Its ASCII code is ninety-nine. In binary form it’s one, one. Then three zeros. And again one, one at the end. A binary cluster usually consists of two vertices. Zero is encoded by following the edge of the first vertex. One is encoded by following the edge of the second vertex.
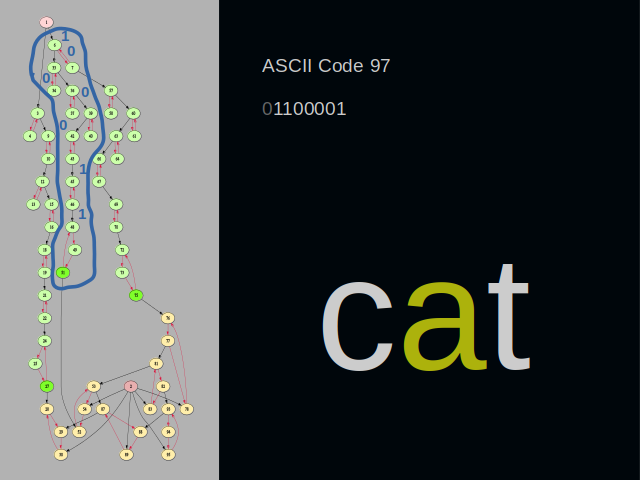
This time, the blue line goes around the letter “a”. You might have noticed that the final digits zero and one are close to the root vertex. This arrangement of digits removes the need to reverse them on reading
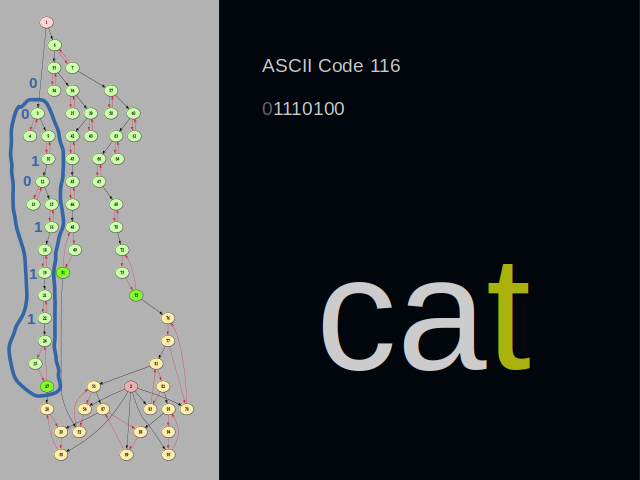
The last letter of the word “cat” is “t”. Please have a look at the cluster located at the bottom. It still belongs to the binary layer of the graph. But it has three vertices instead of two. It’s because the cluster lies at the border of the binary layer. It needs an extra vertex to build a connection to the adjacent layer.
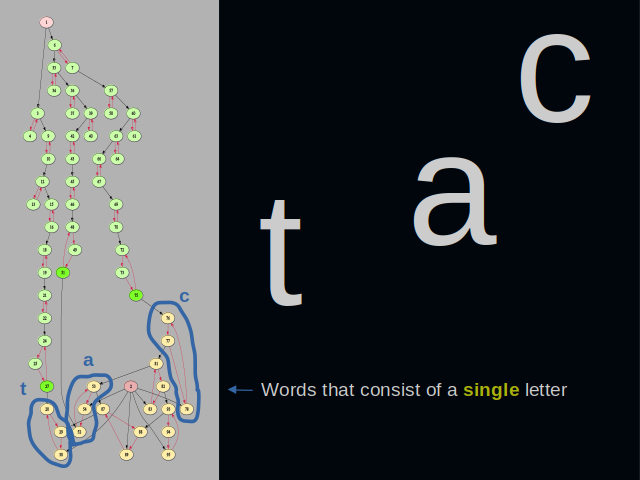
Here we are on the other side of the border that separates the two layers of the graph. This area is inhabited by words that consist of a single letter.
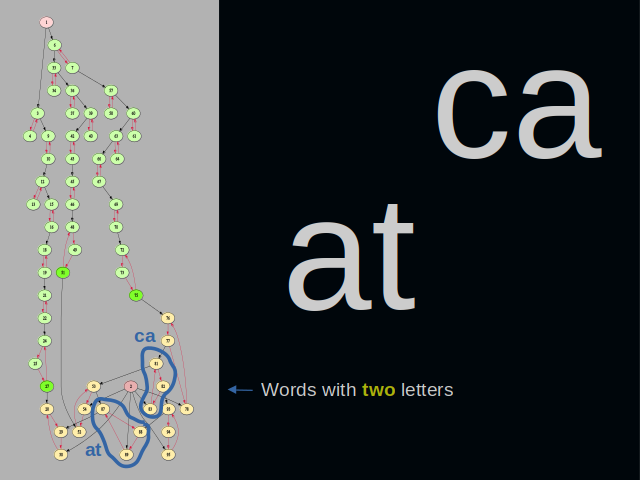
We climb the pyramid one level up and discover here words that have two letters. These words reference the simplest words we saw on the level below them. This way, we traverse actual letter combinations that were present in the texts that we cared to put into the graph. Comparing the pyramids enables detection of similar words.
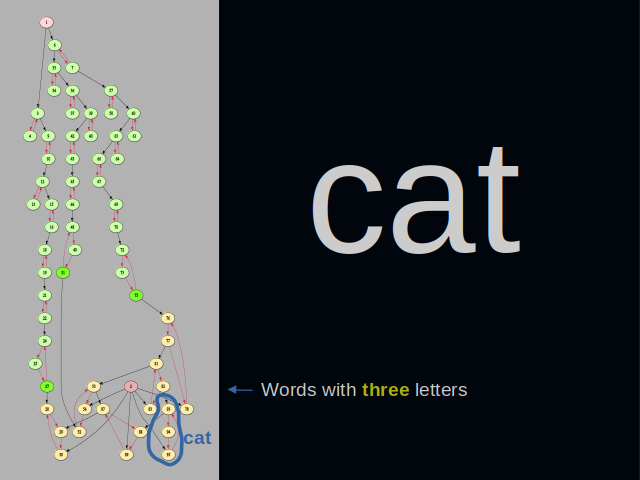
One level up in the pyramid of words, we encounter words with three letters. It is not shown in the picture, but the cluster must actually have four vertices instead of three. An additional vertex is needed in order to build a connection to the layer of phrases.
Let's move on from this example to the operations that can be performed with multimodal graphs.
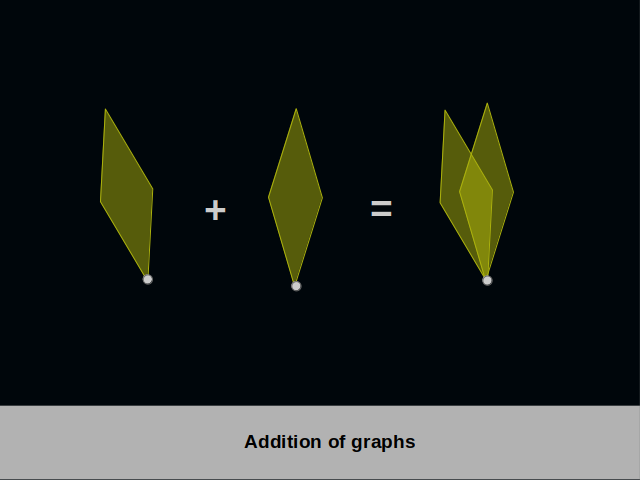
Multimodal graphs can be added. It is easy to do because they possess one special vertex where the process must start. The graph on the left gets missing vertices and edges from the graph on the right. But this doesn’t have be the end of the addition process, because new generalizing vertices may become apparent.
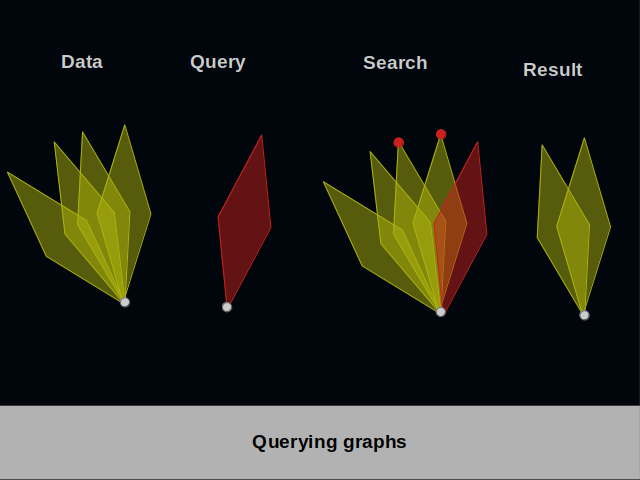
Multimodal graphs may be searched with a query. Overlapping vertices in the query and the original data produce a result. The algorithm for obtaining a result can get quite complex if it involves generalizations.
We have concluded the section on the significance of graphs. In the next section, we will discuss the relationship between graphs and linked lists.
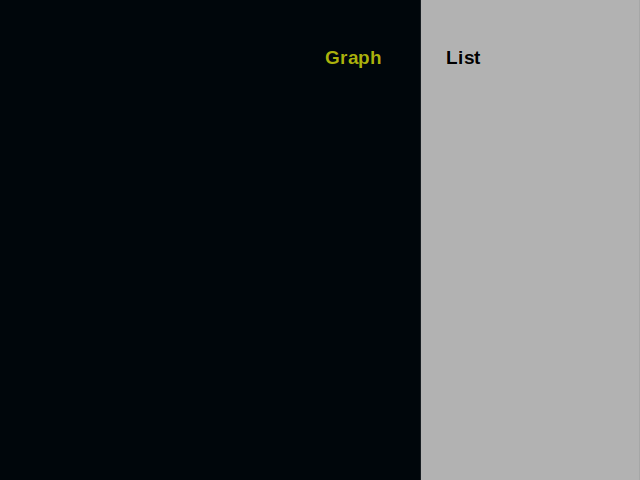
Let’s compare drawing a graph and building a list. In the beginning, both sides are blank.
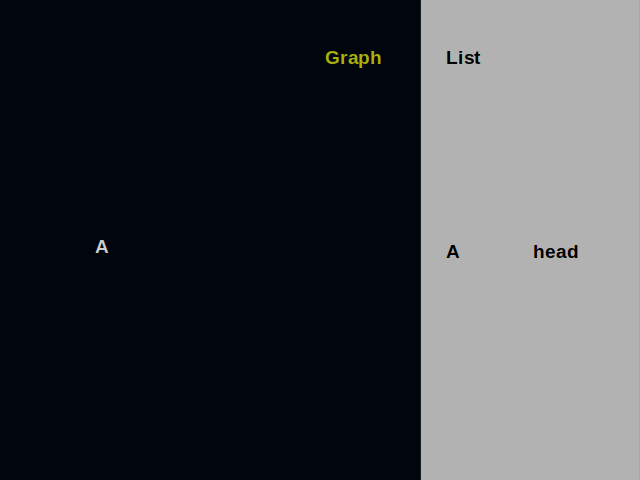
We put the first vertex on the dark surface. It is also at the head of the list.
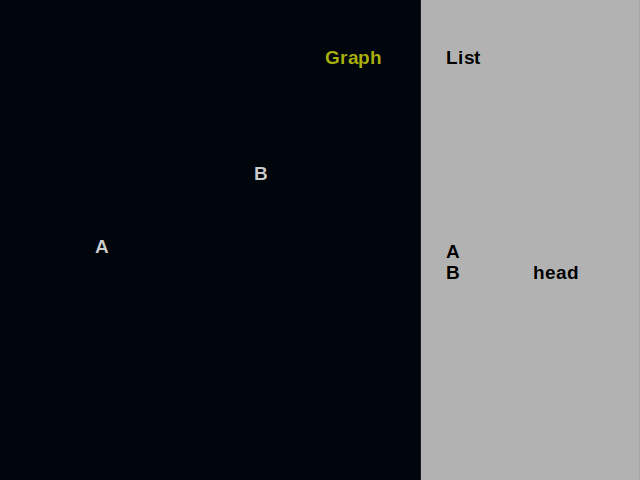
We draw another vertex near the first one. It is at the head of the list now.
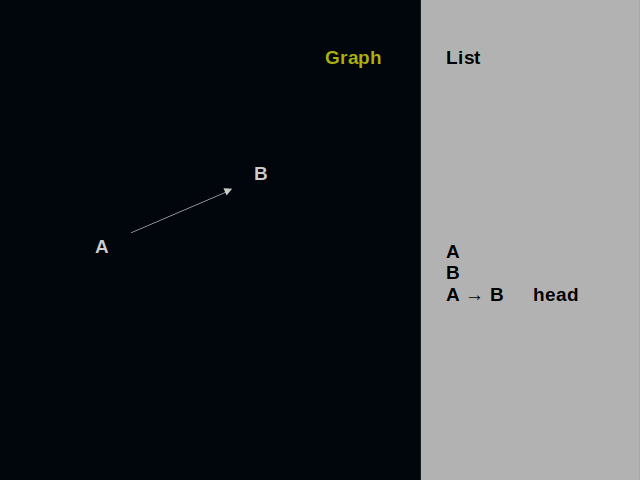
We connect A and B with a directed edge. Into the list we put a record of it.
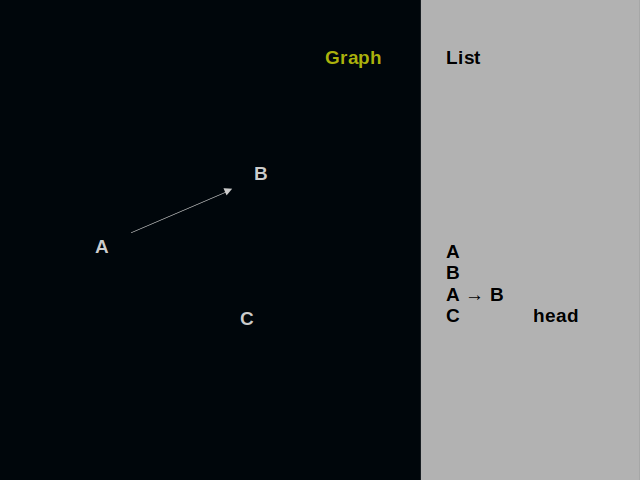
Let’s add one more vertex to this graph.
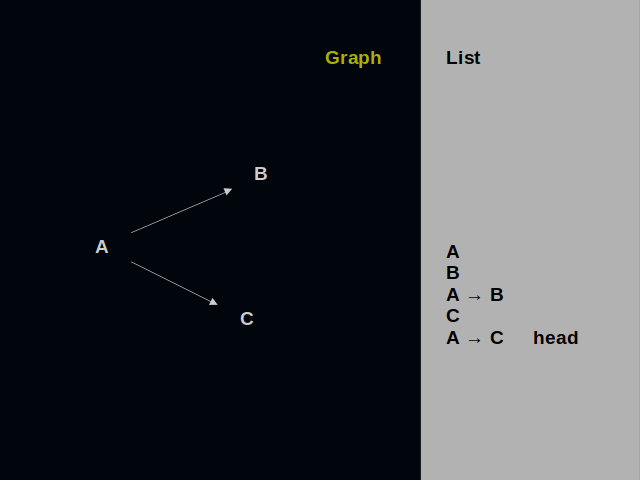
And one more edge. So, drawing graphs is inherently a sequential process. A list suits best for describing it.
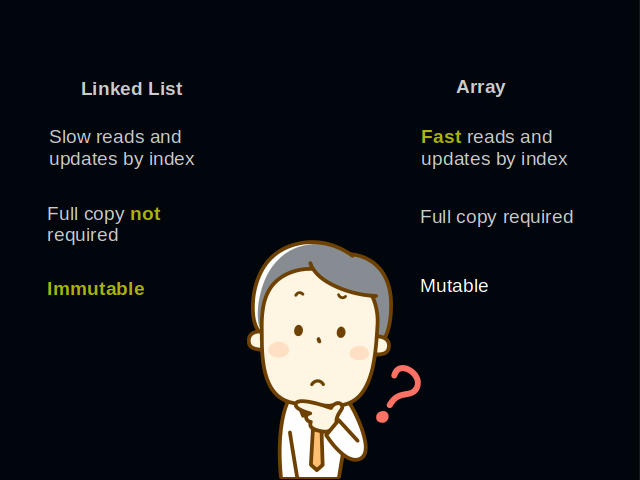
A graph should not only be created. It should also provide all vertices that are connected to a particular one that is of interest. And these edges are certain to be scattered in all possible places of a graph. Linked lists are notoriously not good for the task. A mutable array would be much faster, as it is most close to hardware. But because of its mutability it cannot be used within concurrent functional frameworks. What could be a solution?
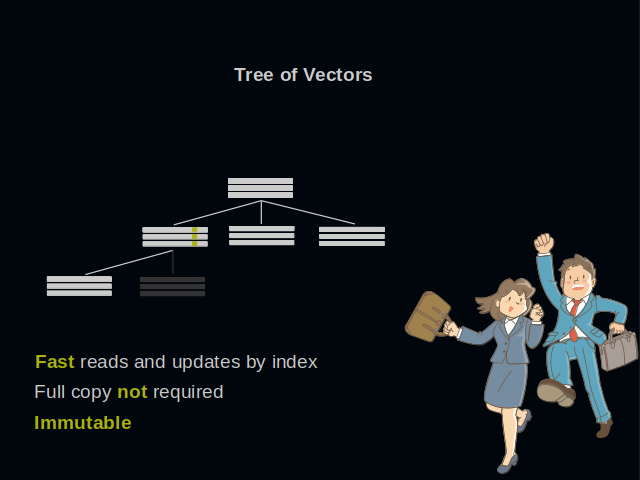
One possible solution is to embed the list into a tree of vectors. It has all the good properties. Reads and updates by index are effectively constant time. This structure can increase or drop in size. It is immutable and can be put into concurrent frameworks. For example, into the Ref of ZIO.
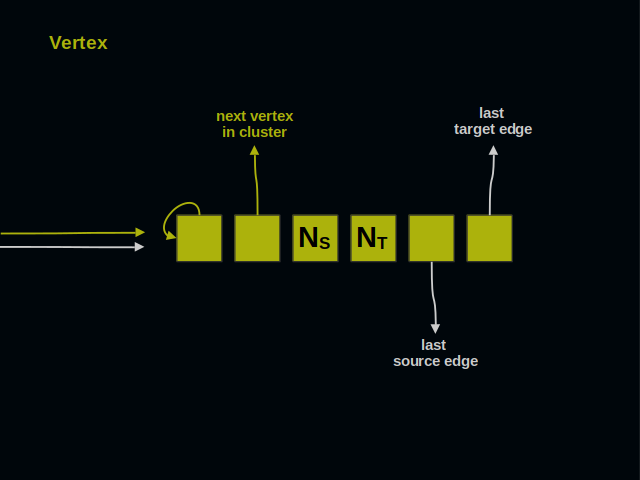
Let’s now have a close look at the graph elements.
Let’s start with the vertices. Vertices of a graph are often called dots or nodes. As you see, a vertex has 6 parts.
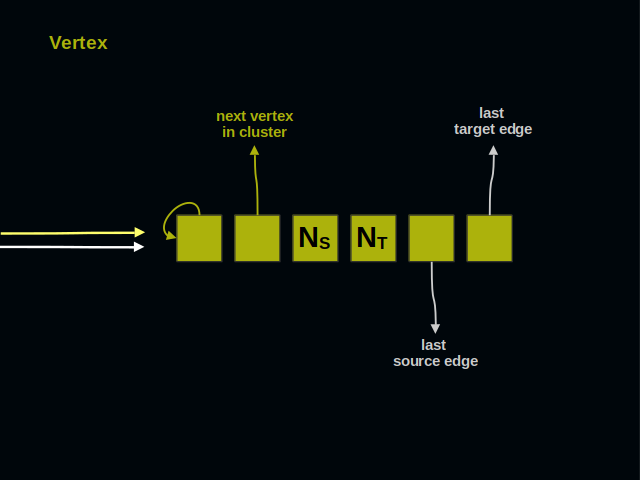
On the left side you see two arrows. They point to the vertex and represent references from other elements of a graph.
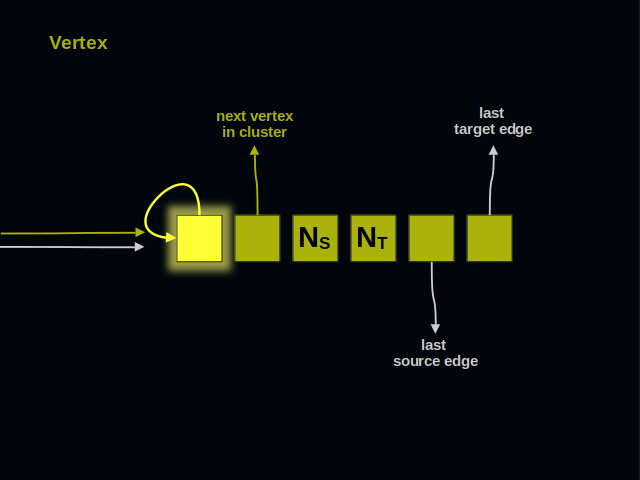
The first part of a vertex contains its own address. It shows that next 5 parts belong to a vertex, and not to an edge. The address of this part serves as the identifier of a vertex for all client code.
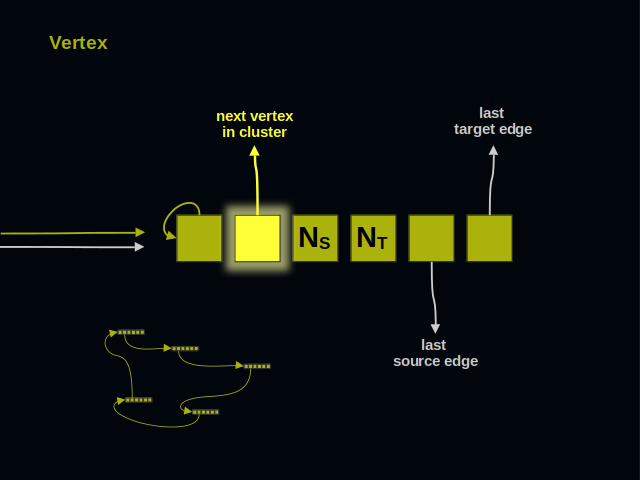
The second part of a vertex references its neighbor within a cluster. Vertices of a cluster build a ring.
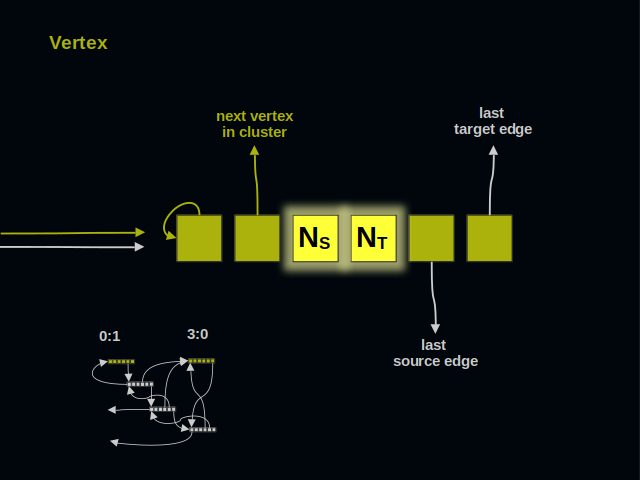
These two parts of a vertex count incoming and outgoing connections. These numbers are useful when checking if two vertices are already connected.
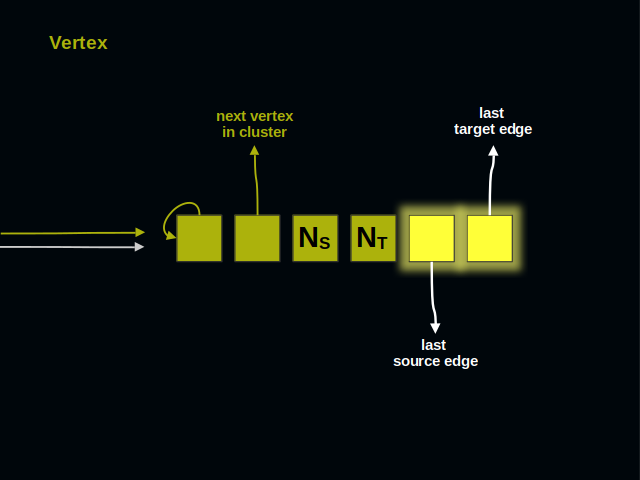
The last two parts of a vertex lead to incoming and outgoing edges. Each kind of edges forms a doubly linked list.
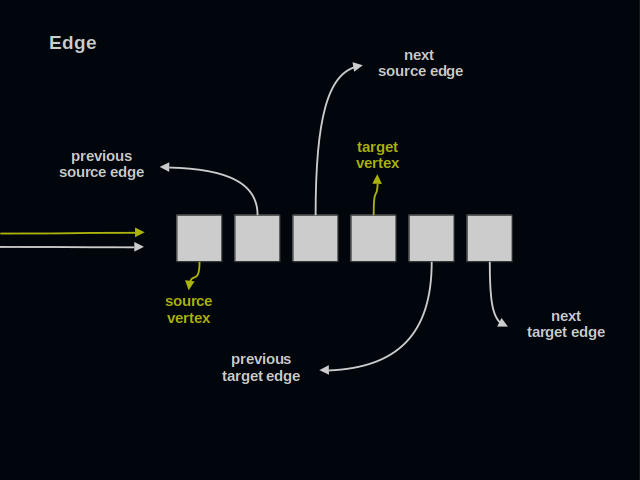
Now, let’s turn to edges. An edge connects one source vertex to one target vertex. An edge is simultaneously present in two lists of edges. An edge has 6 parts. It’s as many as in a vertex.
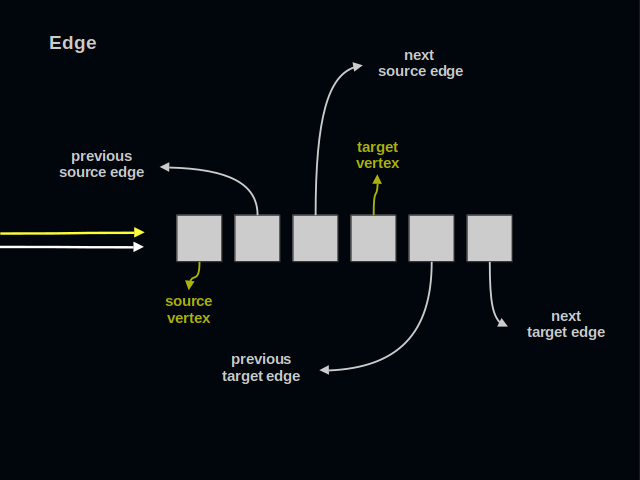
Again, you see two arrows on the left. All references to an edge go to its first part.
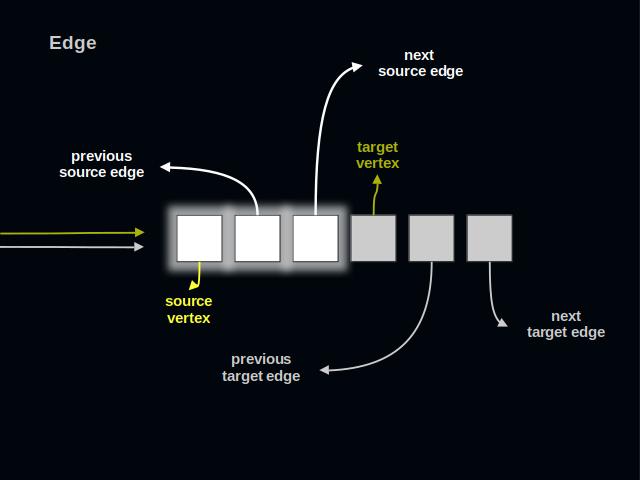
The first three parts of an edge relate to its source vertex.
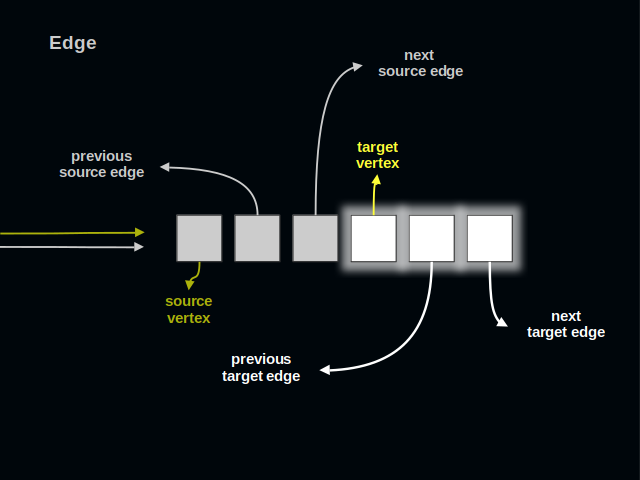
The last three parts of an edge relate to its target vertex. Traversing this list of edges one collects all sources leading to a target.
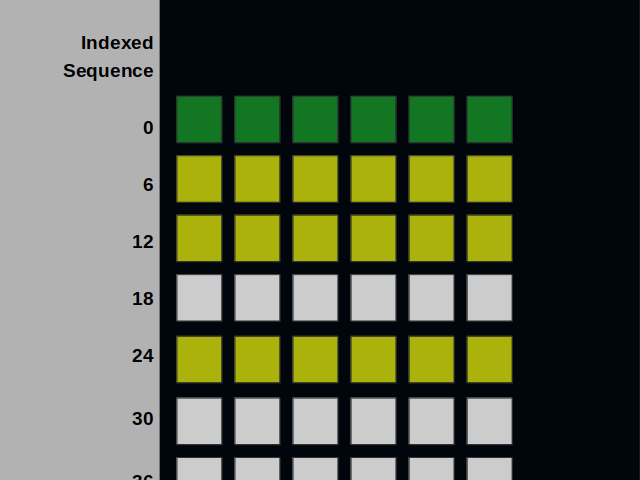
As I’ve already mentioned, vertices and edges occupy equal space in memory. They both consist of six parts. We can put them into a sequence like this.
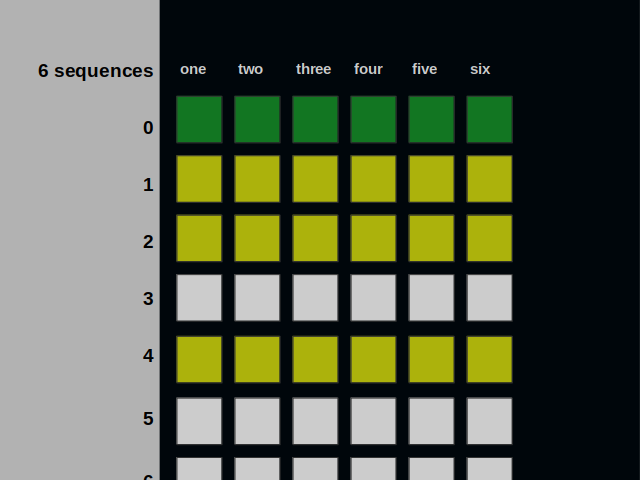
The sequence can be split into six ones. Please note that the addresses have changed.
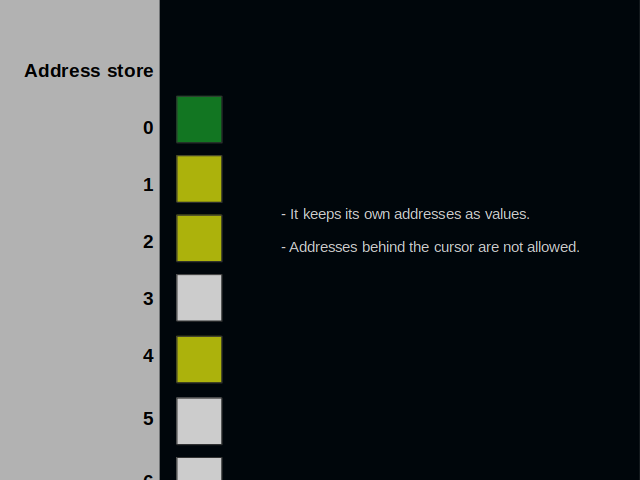
Each of the six sequences is an address store. It is called so because it keeps its own addresses as values. It is embedded into its own tree of vectors. A cursor tracks the next position that is available.
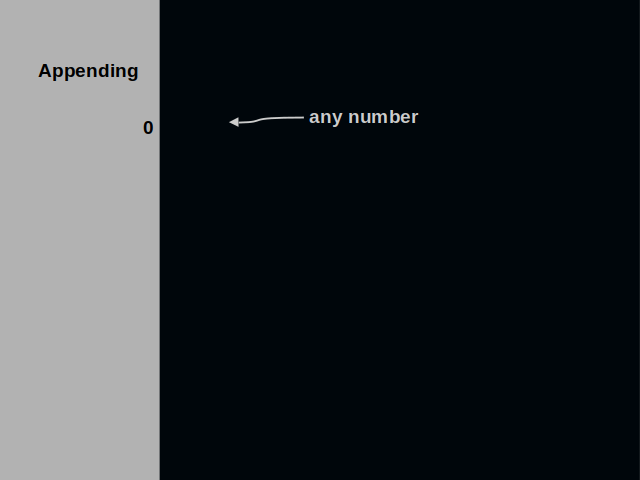
Let’s look at the operations that an address store offers. The append operation starts at the address zero. This address is reserved for metadata. It’s the only place with no restrictions. Any number can be written here.
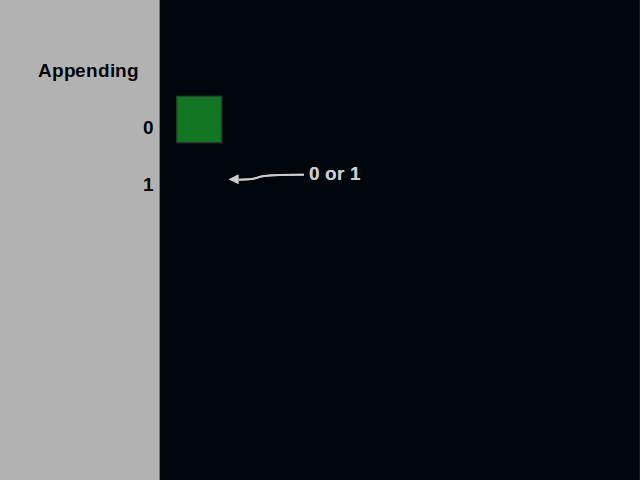
Next, the cursor moves to the address one. This time we can’t write a number that is greater than the address.
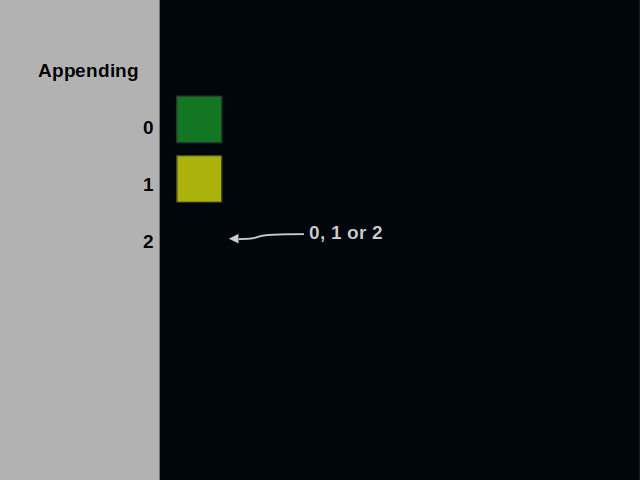
When the cursor moves further, we have a broader choice of values. At address two, we can write zero, one or two.
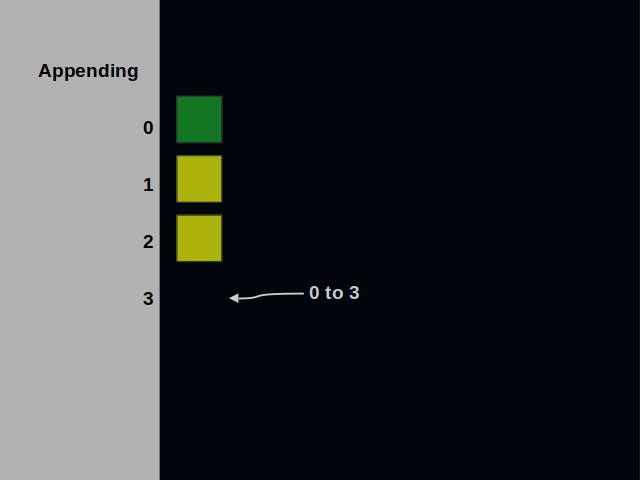
This process can continue on and on.
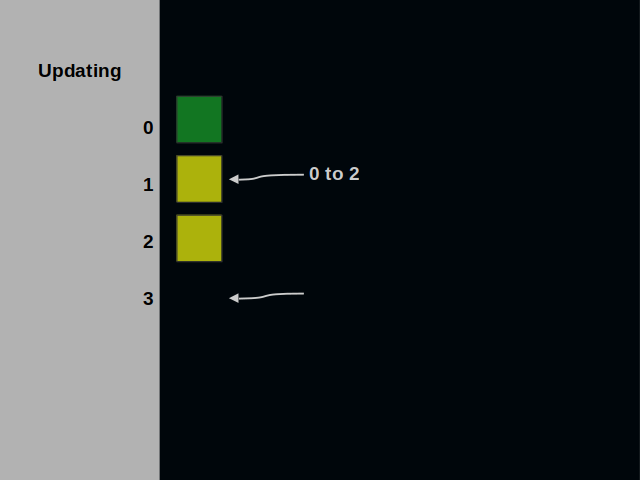
Let’s now have a look at the update operation. Suppose we want to replace the value that is kept at the address one. We can place here zero, one or two.
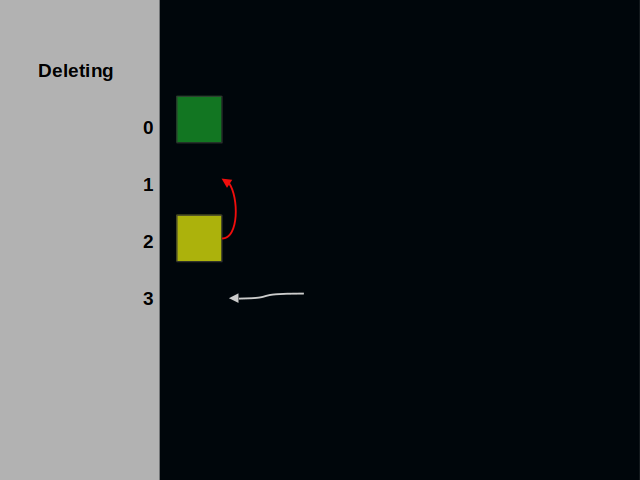
Finally, we’ve come to the delete operation. The deleted element of an address store gets replaced with the last one.
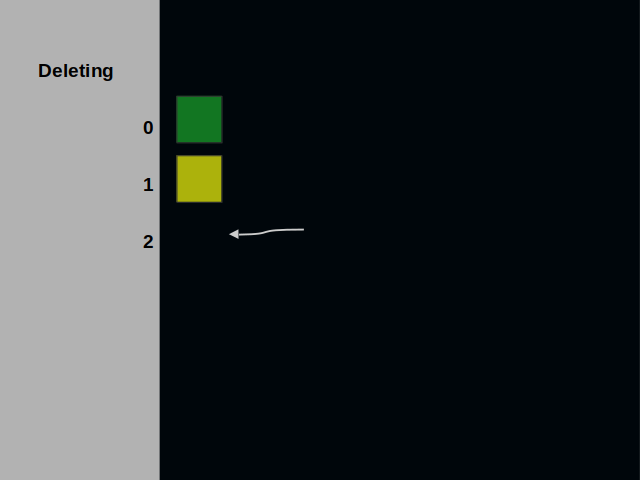
The code implementing deletions is most intricate. It is roughly two thirds of the code base.
We have finished the section about the data structure and arrived at modeling it with Scala generic types.
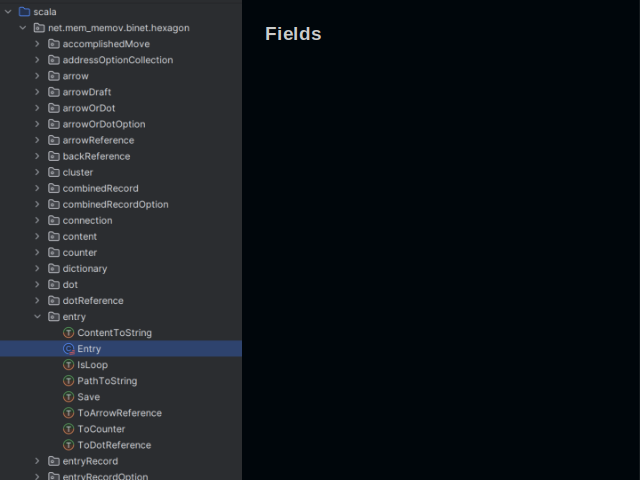
I have devised a way of organizing Scala code. It is unusual but it has its merits. What is normally called a class occupies a whole directory. Class fields reside in a dedicated file. Each method has its own file too.
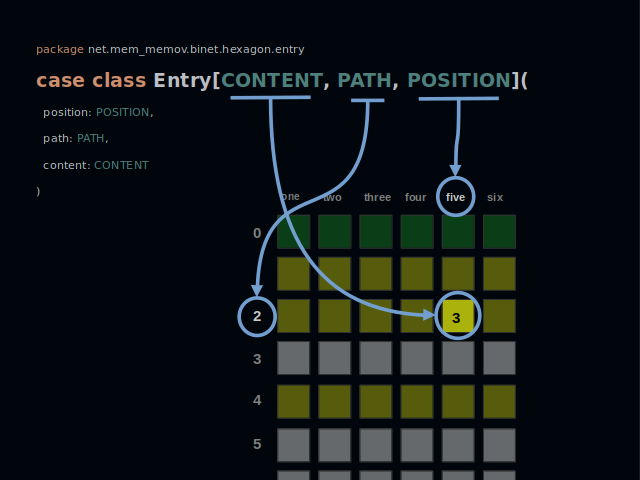
Every class of a business-domain is a generic type. Its type parameters define the field types. Here we’ve got a database entry. It contains some content. And it can be found on some path within a certain address store.
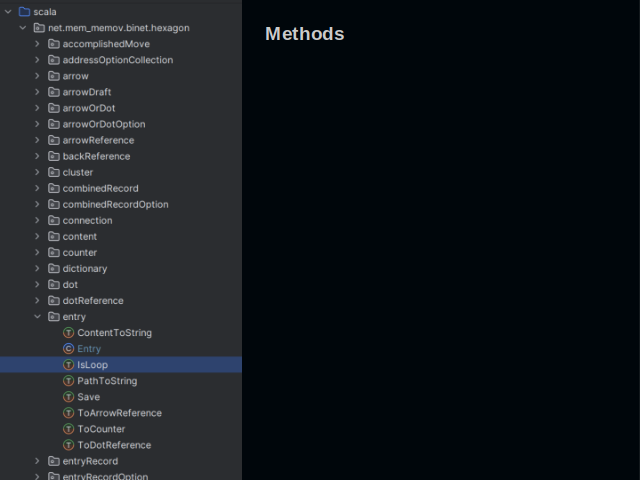
All methods are implemented as type classes. A concrete implementation is summoned at the call site.
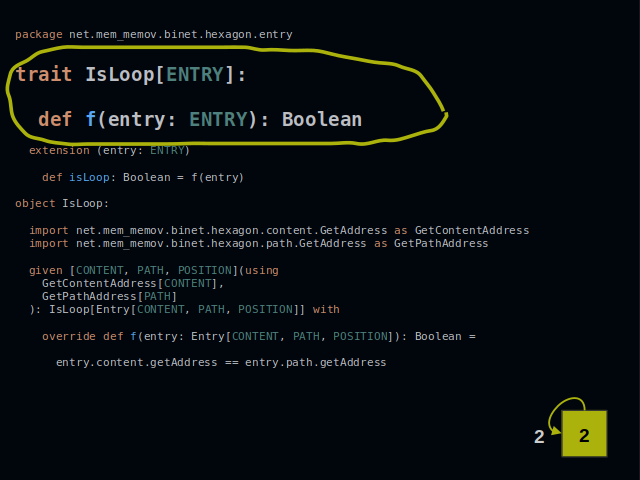
The IsLoop method checks if an entry contains its own address. It is a class type with one function “f”.
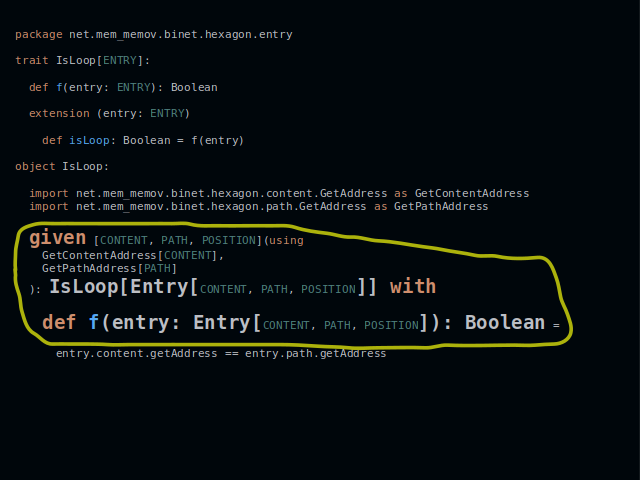
Below it we find an implementation as a given. Methods of the content and the path are summoned from their respective companion objects.
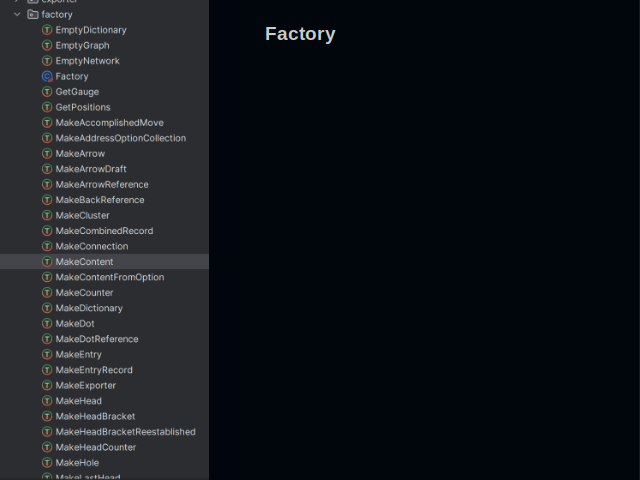
One final ingredient is needed to make abstract types concrete. It’s a factory. It has lots of methods that create business objects of a domain.
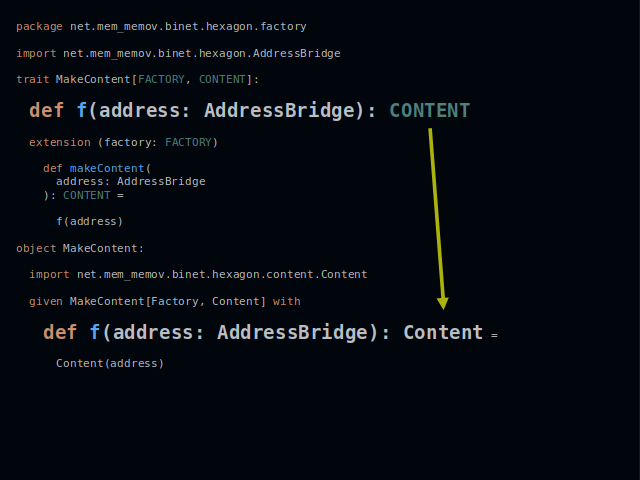
Here we have one of such methods. It creates instances of type Content. The arrow shows how the type parameter is translated into a concrete type.
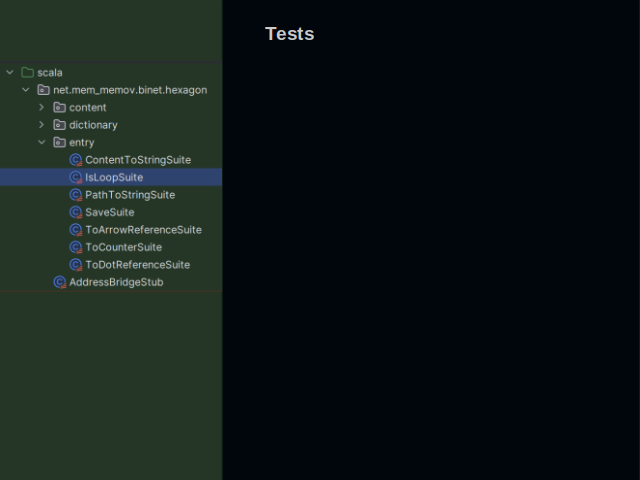
Such peculiar design allows writing tests a bit differently.

If a class is required in a test, it gets declared with just one line. Here we declare the class ContentStub.

And here we add a method to it by creating a given instance. An entry under test will call this method when it checks if there is a loop.

Now, that you’ve seen some code, I’d like to emphasize two advantages of this approach.

Test stubs are easy to create. No reflection is needed. You depend less on a testing library.

Another advantage is call-site driven development. It means a shift in focus when writing code. You do not create things that can perform certain actions. Instead, you discover actions that things you to have at hand must perform.
Finally we arrive at the end of the presentation. I believe that multimodal graphs will be used extensively in the future. And I hope that you can see the benefits besides those that I have mentioned.
Subscribe to my newsletter
Read articles from Aleksandr Novikov directly inside your inbox. Subscribe to the newsletter, and don't miss out.
Written by
