Cluster Monitoring using Prometheus & Grafana
 Nikita Shinde

Hi There, Ever wondered how you can effortlessly spot problems in your cluster without constantly checking every component? Welcome to a simpler way of keeping an eye on things! In this blog, we'll explore how using Prometheus and Grafana can make monitoring a breeze, saving you time and hassle. Let's dive in and discover how to oversee your cluster with these cool tools smartly!
1. Key Components
Prometheus server - Processes and stores metrics data
Alert Manager - Sends alerts to any systems/channels
Grafana - Visualize scraped data in UI
2. Pre Requisites
Kubernetes Cluster/Minikube is set already on VM or any cloud instance
Install Helm
3. Installation Steps
helm repo add stable https://charts.helm.sh/stable
helm repo add prometheus-community https://prometheus-community.github.io/helm-charts
helm search repo prometheus-community
kubectl create namespace prometheus
helm install stable prometheus-community/kube-prometheus-stack -n prometheus
kubectl get pods -n prometheus
kubectl get svc -n prometheus

Edit Prometheus Service (Edit type: LoadBalancer)
kubectl edit svc stable-kube-prometheus-sta-prometheus -n prometheus
Edit Grafana Service (Edit type: LoadBalancer)
kubectl edit svc stable-grafana -n prometheus
Verify if the service is changed to LoadBalancer/NodePort and also get the Load Balancer URL.
kubectl get svc -n prometheus

Use the external IP of the load balancer service type or NodePort IP with its port to access Grafana UI
If you're running Minikube, just like I do, you can easily access the endpoint URL by using these commands
minikube service list
minikube service <service-name> -n prometheus
The command minikube service <service-name> -n prometheus will open the service in your default browser.
4. Access the Grafana UI
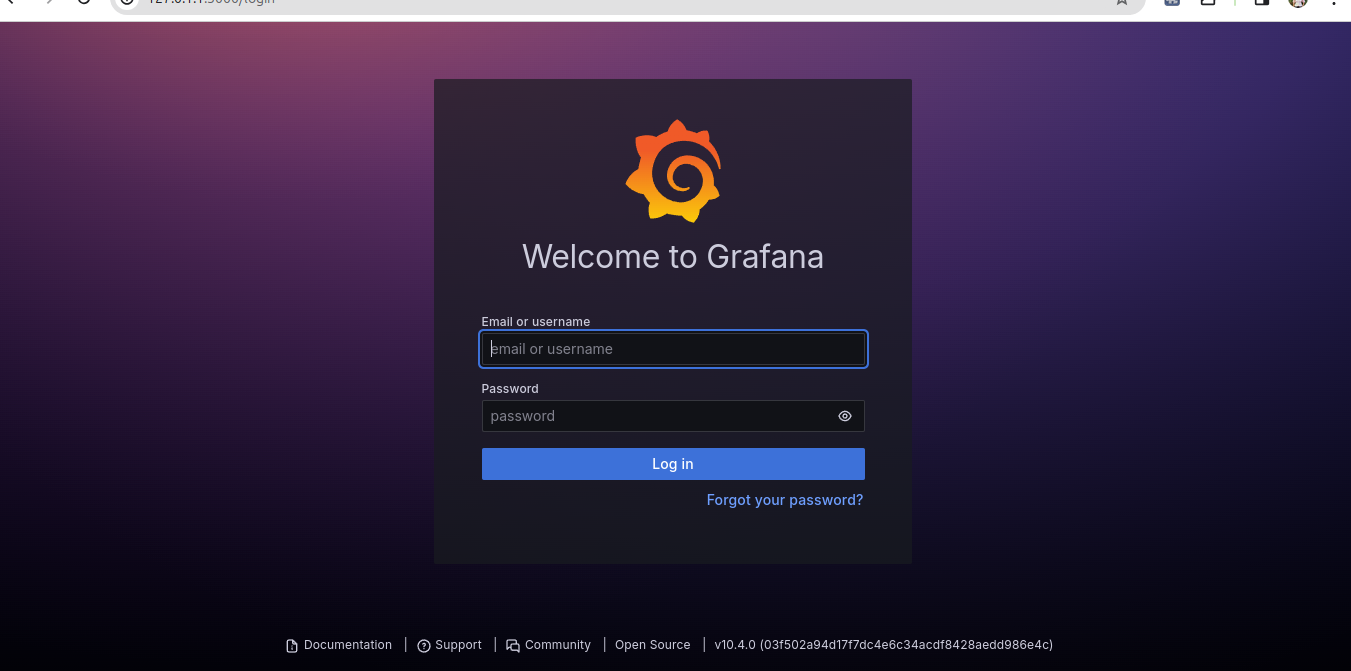
UserName: admin
Password: prom-operator
5. Create a Dashboard for Kubernetes Cluster Monitoring
For creating a dashboard to monitor the cluster:
Click '+' button on left panel and select ‘Import’
Enter 12740 dashboard id under Grafana.com Dashboard
Click ‘Load’
Select ‘Prometheus’ as the endpoint under prometheus data sources drop down
Click ‘Import’
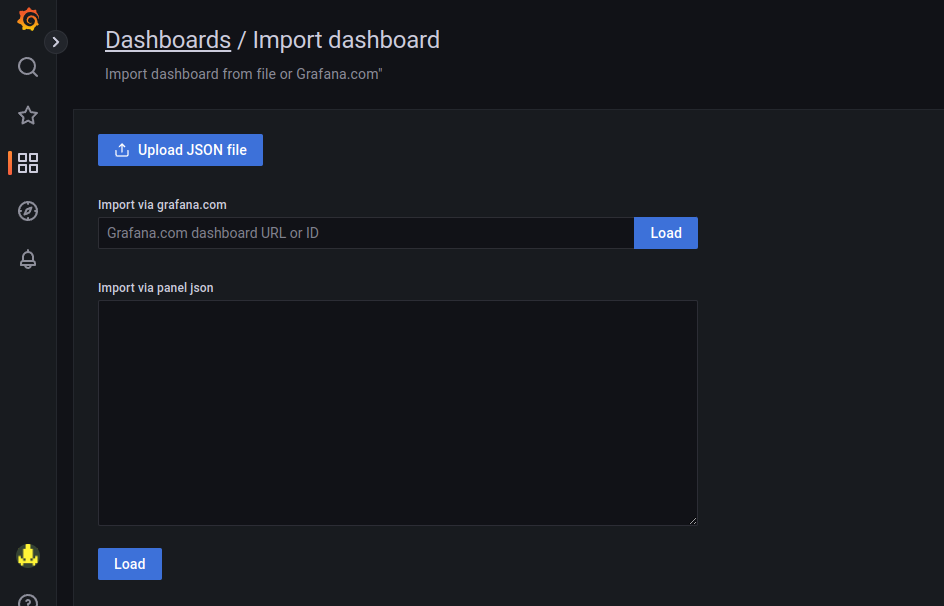
Tadaa! Your dashboard is all setup, showcasing default metrics for an at-a-glance view of your cluster's health. Feel free to tweak it further—customize thresholds and set limits to fit your unique needs!
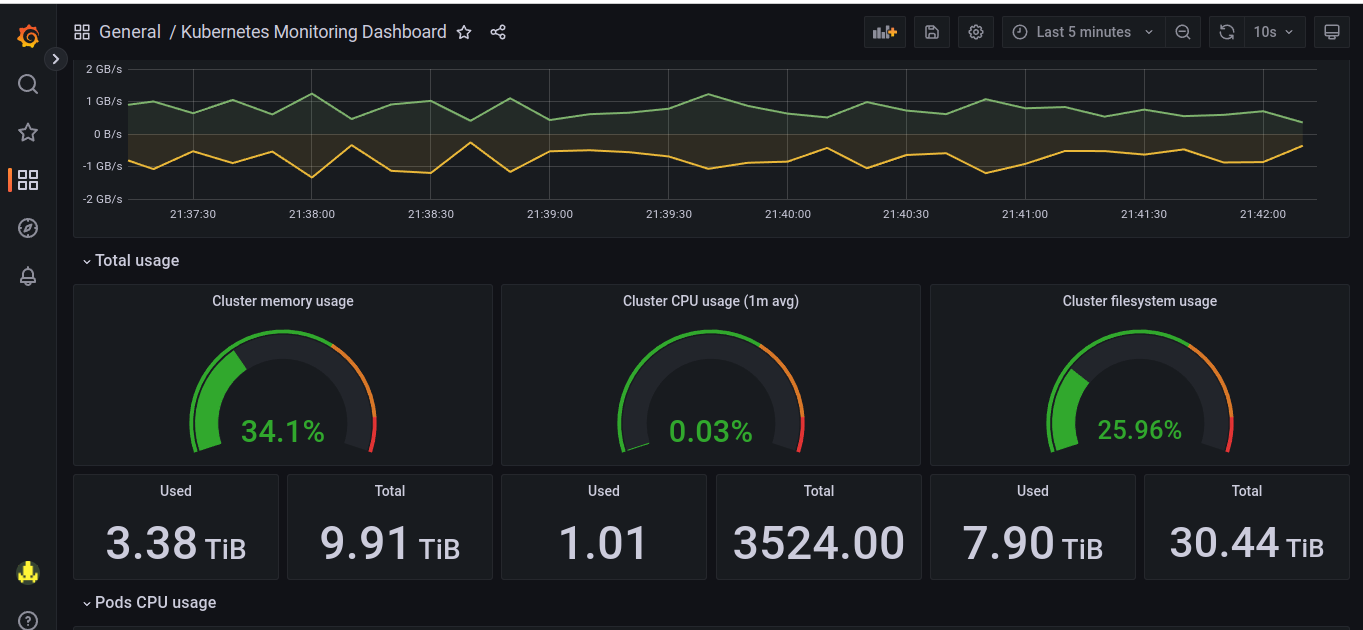
With the Grafana Agent, we can easily scrape Kubernetes state metrics of our cluster, helping us to monitor it.
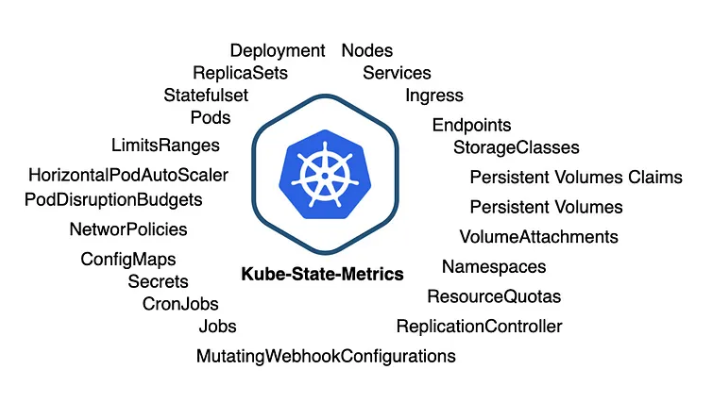
Now..What is Kube-state-metrics? It is a service that listens to the Kubernetes API server and generates metrics about the state of the objects (like Deployments, Nodes, and Pods), which Prometheus can then scrape.
6. Outro
With our dashboard up and running, if we connect Prometheus Alert Manager, we'll start receiving alerts to keep us informed on any email subscriber or slack channel.
https://grafana.com/grafana/dashboards/315-kubernetes-cluster-monitoring-via-prometheus/
https://grafana.com/grafana/dashboards/6417-kubernetes-cluster-prometheus/
Thank you for Reading !! 🙌🏻😁📃, see you in the next blog.🤘
🚀 Thank you for sticking up till the end. If you have any questions/feedback regarding this blog feel free to connect with me
LinkedIn: https://www.linkedin.com/newsletters/technerdz-7116496651292192768/
Subscribe to my newsletter
Read articles from Nikita Shinde directly inside your inbox. Subscribe to the newsletter, and don't miss out.
Written by
