Optimizing Software Delivery: Creating an End-to-End CI/CD Pipeline
 Hemanth Gangula
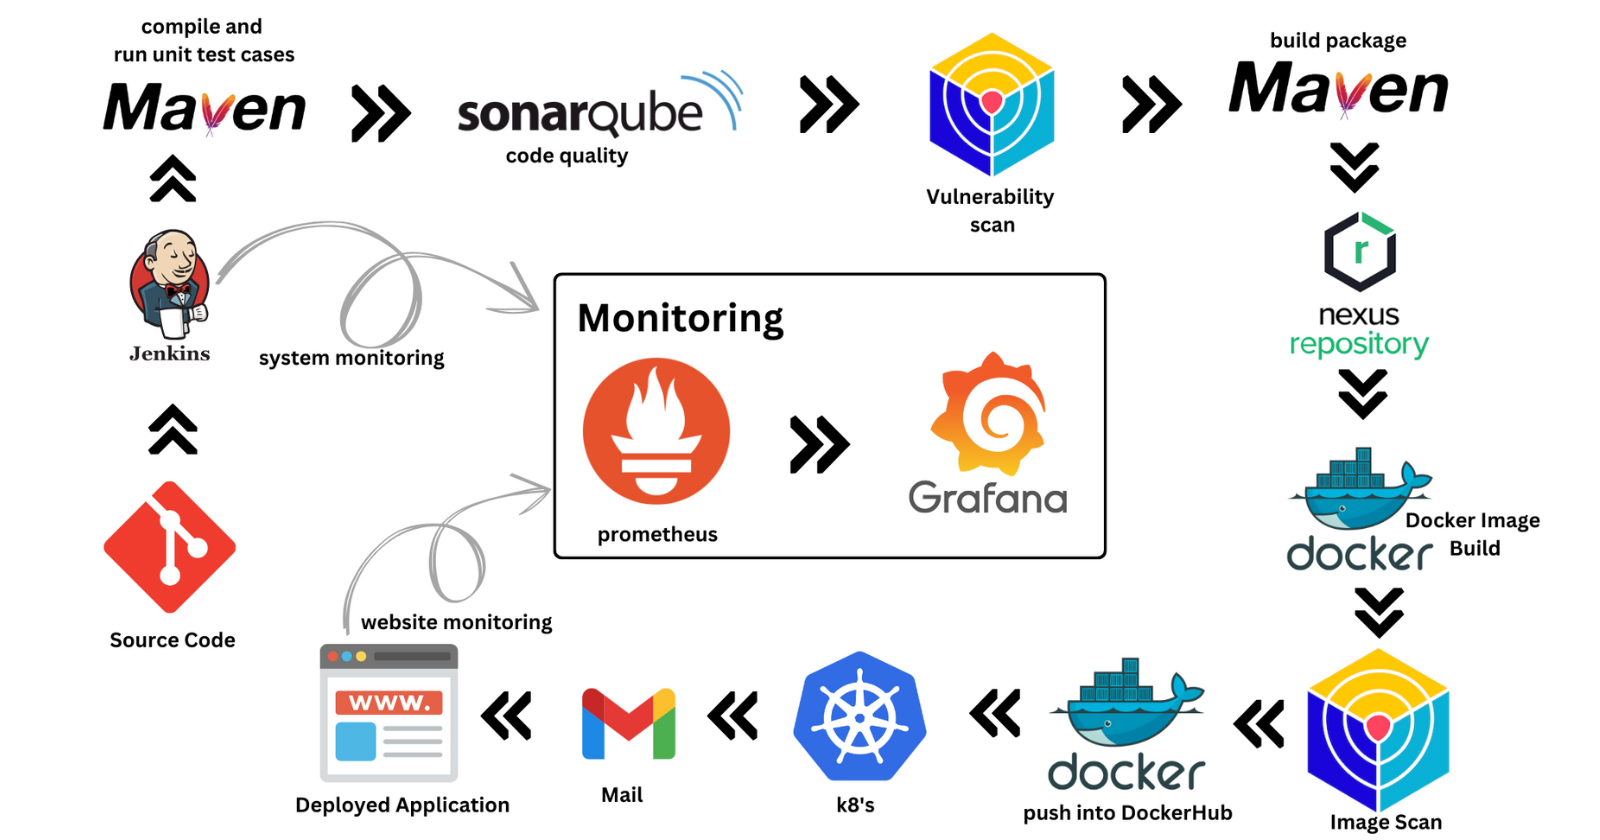
In my quest to sharpen my skills and make a tangible impact in the world of software engineering, I embarked on an ambitious project to develop an end-to-end CI/CD pipeline for the BoardgameListingWebApp. With an eye toward efficiency and quality, I meticulously orchestrated each stage of the pipeline, leveraging cutting-edge tools and technologies to automate code integration, testing, deployment, and monitoring.
Provisioning the Infrastructure
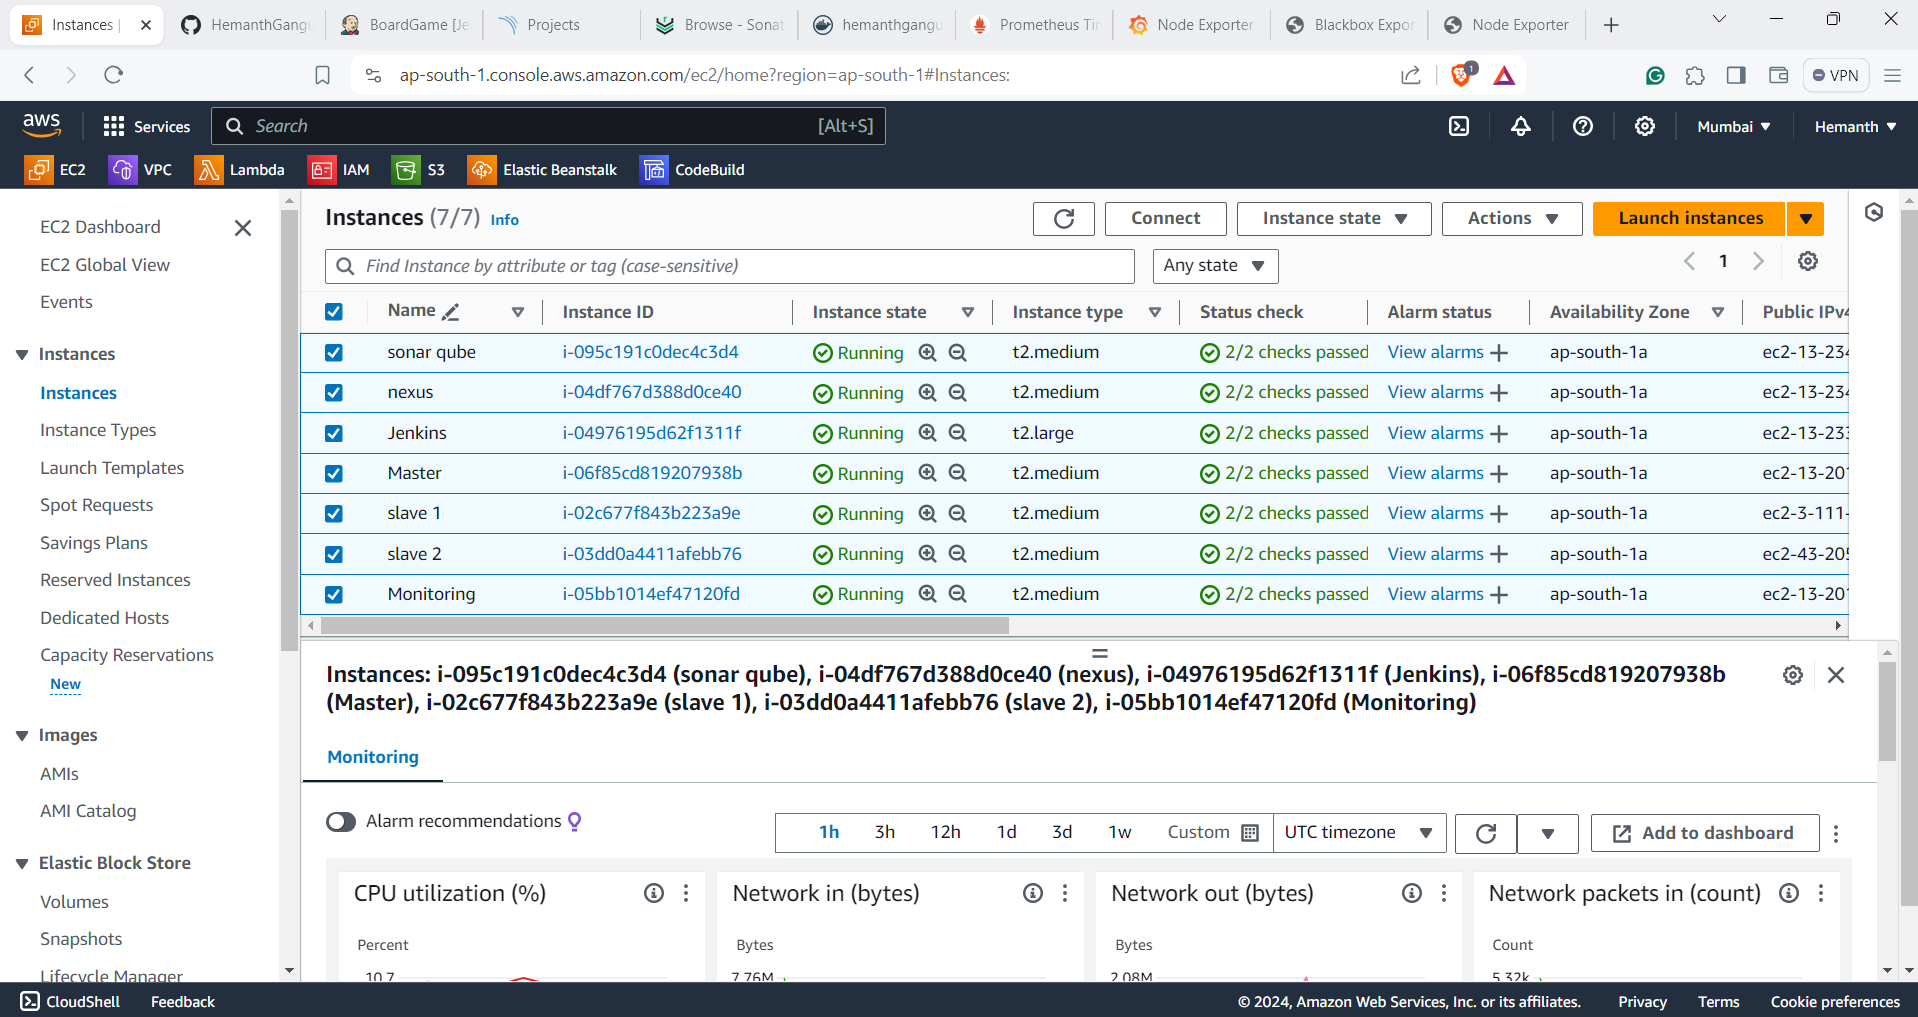
I commenced the project by architecting a Virtual Private Cloud (VPC) on AWS, meticulously crafting a network environment that ensures the utmost security and efficiency. Within this VPC, I provisioned seven EC2 instances, each meticulously configured to fulfill a distinct role within the CI/CD pipeline.
Kubernetes Master: Orchestrates deployment, scaling, and maintenance of containerized applications across the cluster. It oversees resource allocation and ensures seamless communication between nodes.
Kubernetes Slaves: Handle workload distribution within the cluster by executing tasks assigned by the master. They optimize resource utilization and enhance system scalability.
SonarQube: Analyzes codebases for bugs, vulnerabilities, and code smells. Provides actionable insights to improve code quality, maintainability, and security throughout the development lifecycle.
Nexus: Central repository for storing and managing software artifacts. Facilitates artifact management and version control, enhancing collaboration and productivity.
Jenkins: Automates the CI/CD pipeline, from code integration to deployment. Integrates with other tools, enabling continuous integration and delivery while providing flexibility in the development workflow.
Monitoring Stack: Consists of Prometheus, Grafana, Blackbox, and Node Exporter. Collects metrics, visualizes them through dashboards, probes URLs for availability and latency, and gathers system-level metrics to ensure optimal system performance and reliability. Each instance is fortified with stringent security measures, safeguarding against potential threats.
Technology Stack
GitHub Setup: GitHub
Jenkins Configuration: Jenkins
SonarQube Integration: SonarQube
Trivy Setup: Trivy
Nexus Repository: Nexus
Docker Configuration: Docker
Kubernetes Deployment: Kubernetes
Monitoring Setup: Prometheus, Grafana, Blackbox, Node Exporter.
Implementing the CI/CD Pipeline
Initially, create an EC2 instance dedicated to each service, including monitoring, Jenkins, and SonarQube. Using a local system is unnecessary for this setup.
With the infrastructure in place, I dove into the heart of the project – implementing the CI/CD pipeline. Each tool was carefully integrated and configured to seamlessly orchestrate the software delivery lifecycle:
GitHub Integration:
Upon code changes push, GitHub triggers the pipeline.
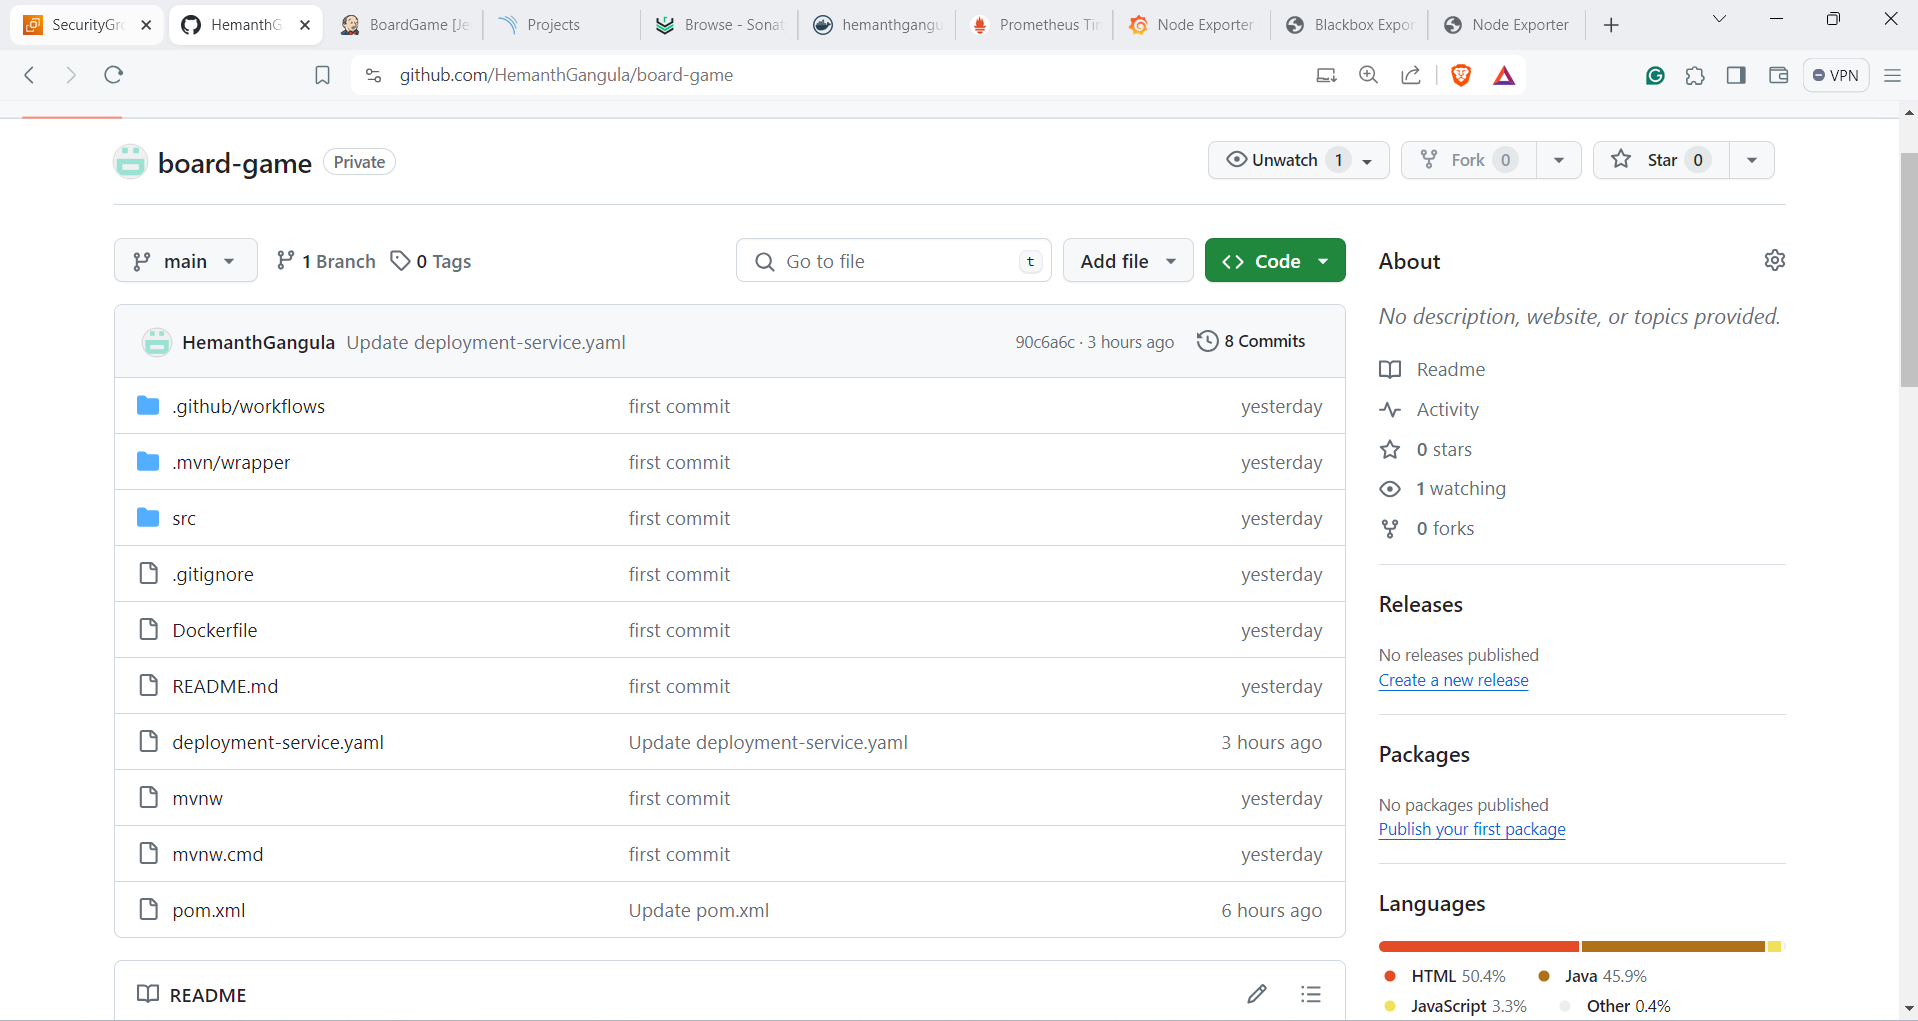
Initiate the Git repository and add the application code to it.
-
Jenkins Processing:
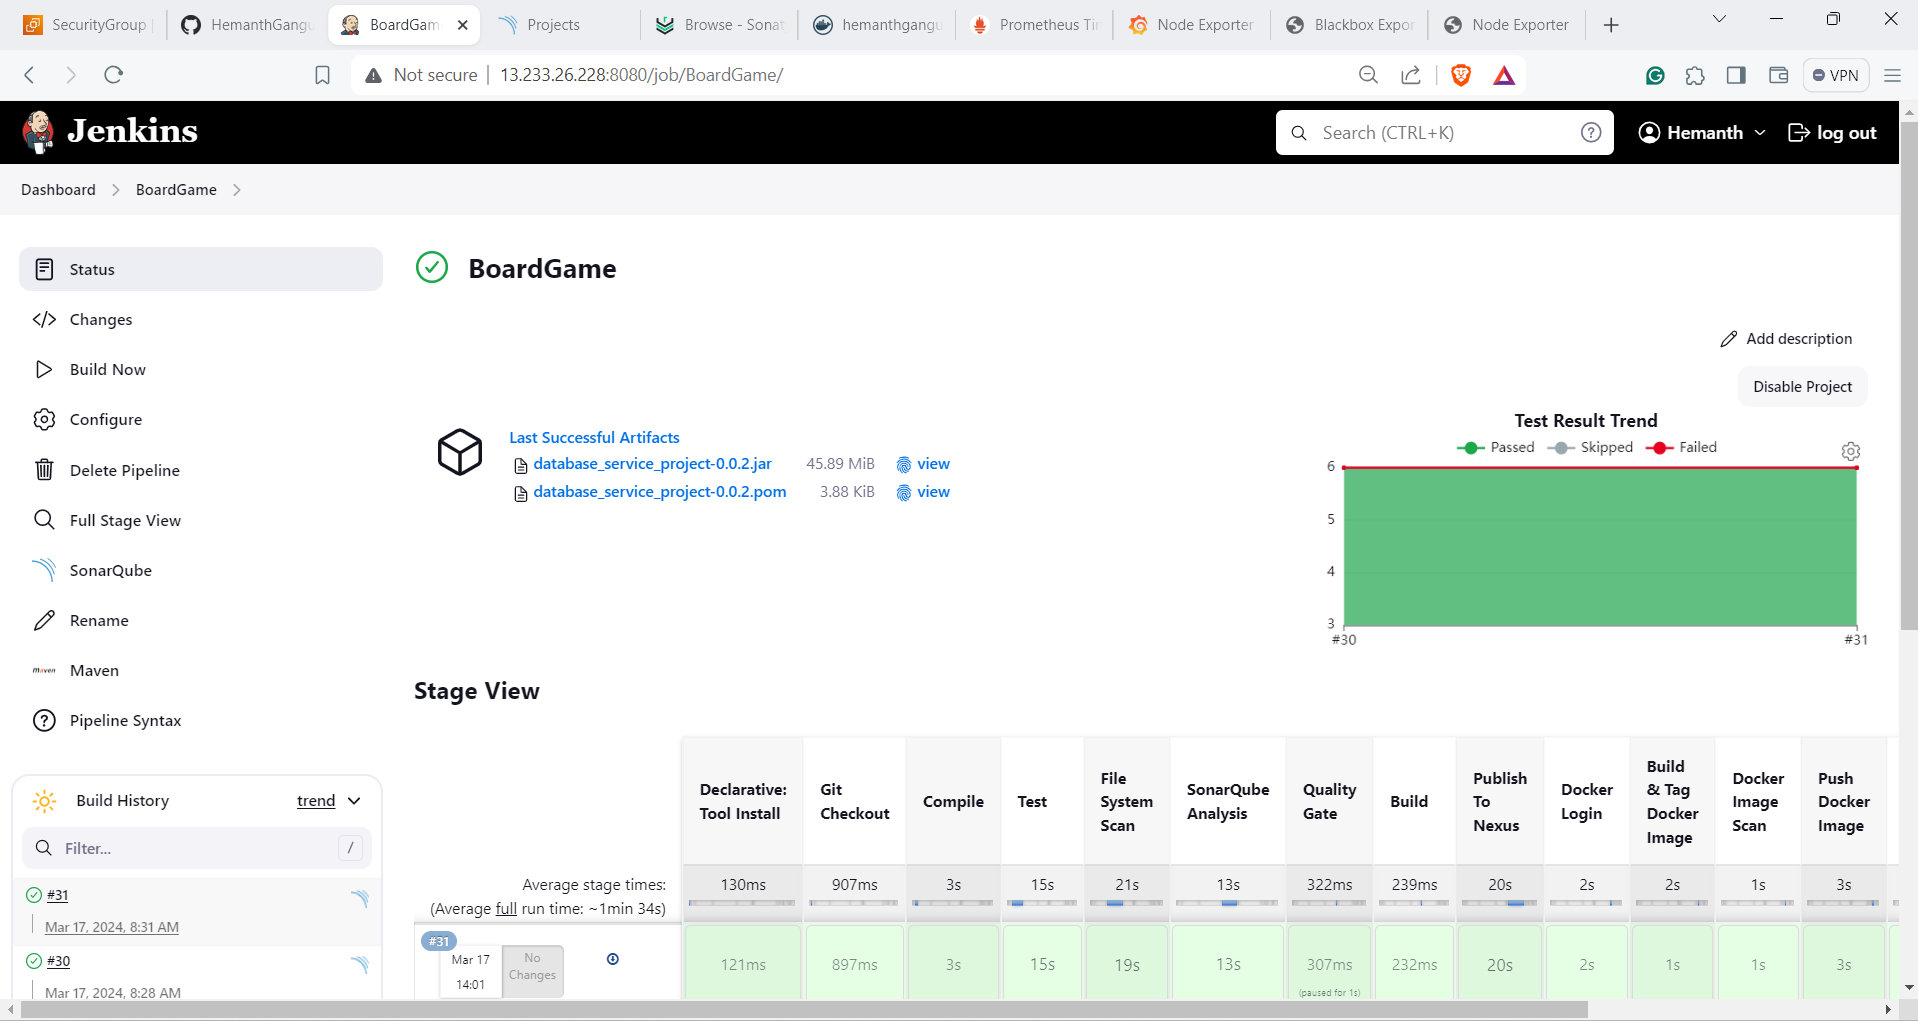
- Jenkins receives the trigger and initiates the pipeline.
Maven Compilation and Unit Testing:
- Maven compiles the code and executes unit tests, ensuring code integrity.
SonarQube Analysis:
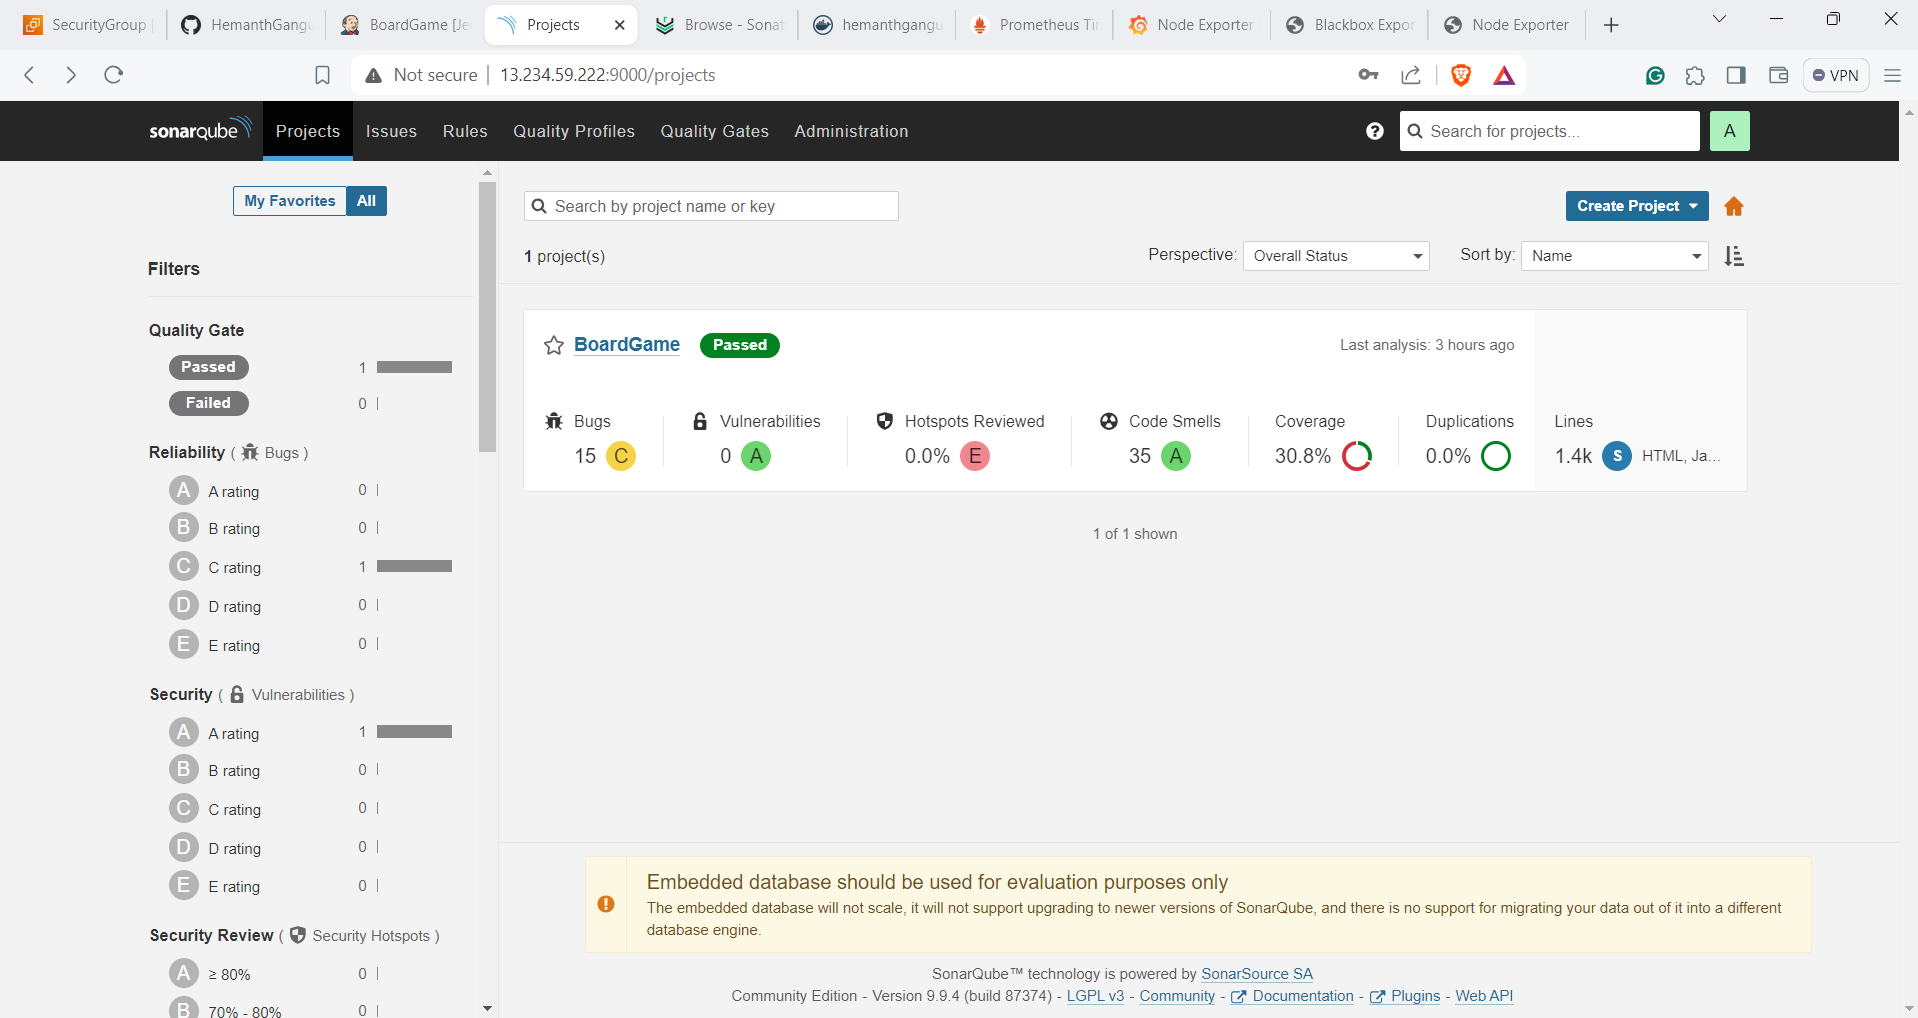
Code quality and security analysis are performed by SonarQube, providing insights into potential issues.
Trivy Vulnerability Scanning:
- Trivy conducts vulnerability scans on both code and Docker images, enhancing application security.
Artifact Packaging with Maven:
- Maven packages the application artifacts, preparing them for deployment.
Nexus Repository Management:
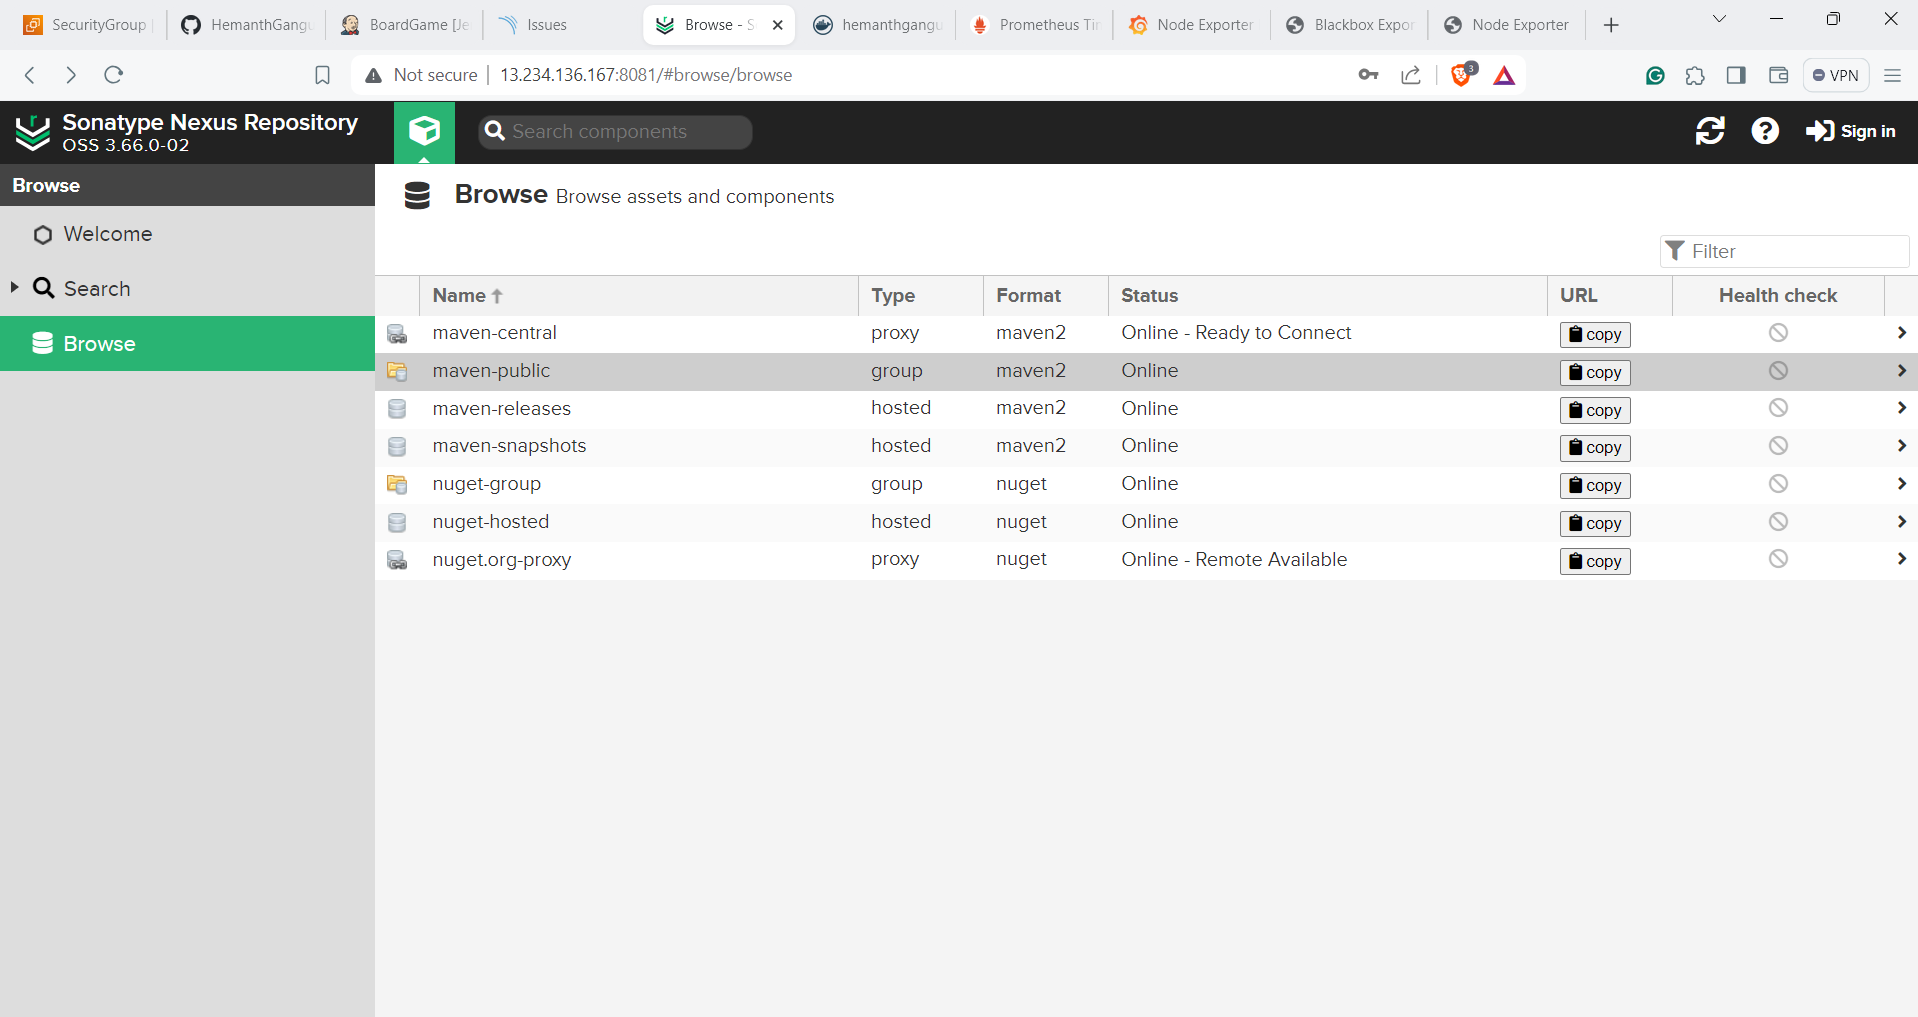
Nexus acts as the artifact repository, storing and managing packaged artifacts securely.
Docker Image Building and Tagging:
- Docker builds and tags Docker images for deployment, ensuring consistency and portability.
Docker Image Scanning with Trivy:
- Trivy performs vulnerability scanning on Docker images, ensuring they meet security standards.
Docker Image Pushing to Docker Registry:
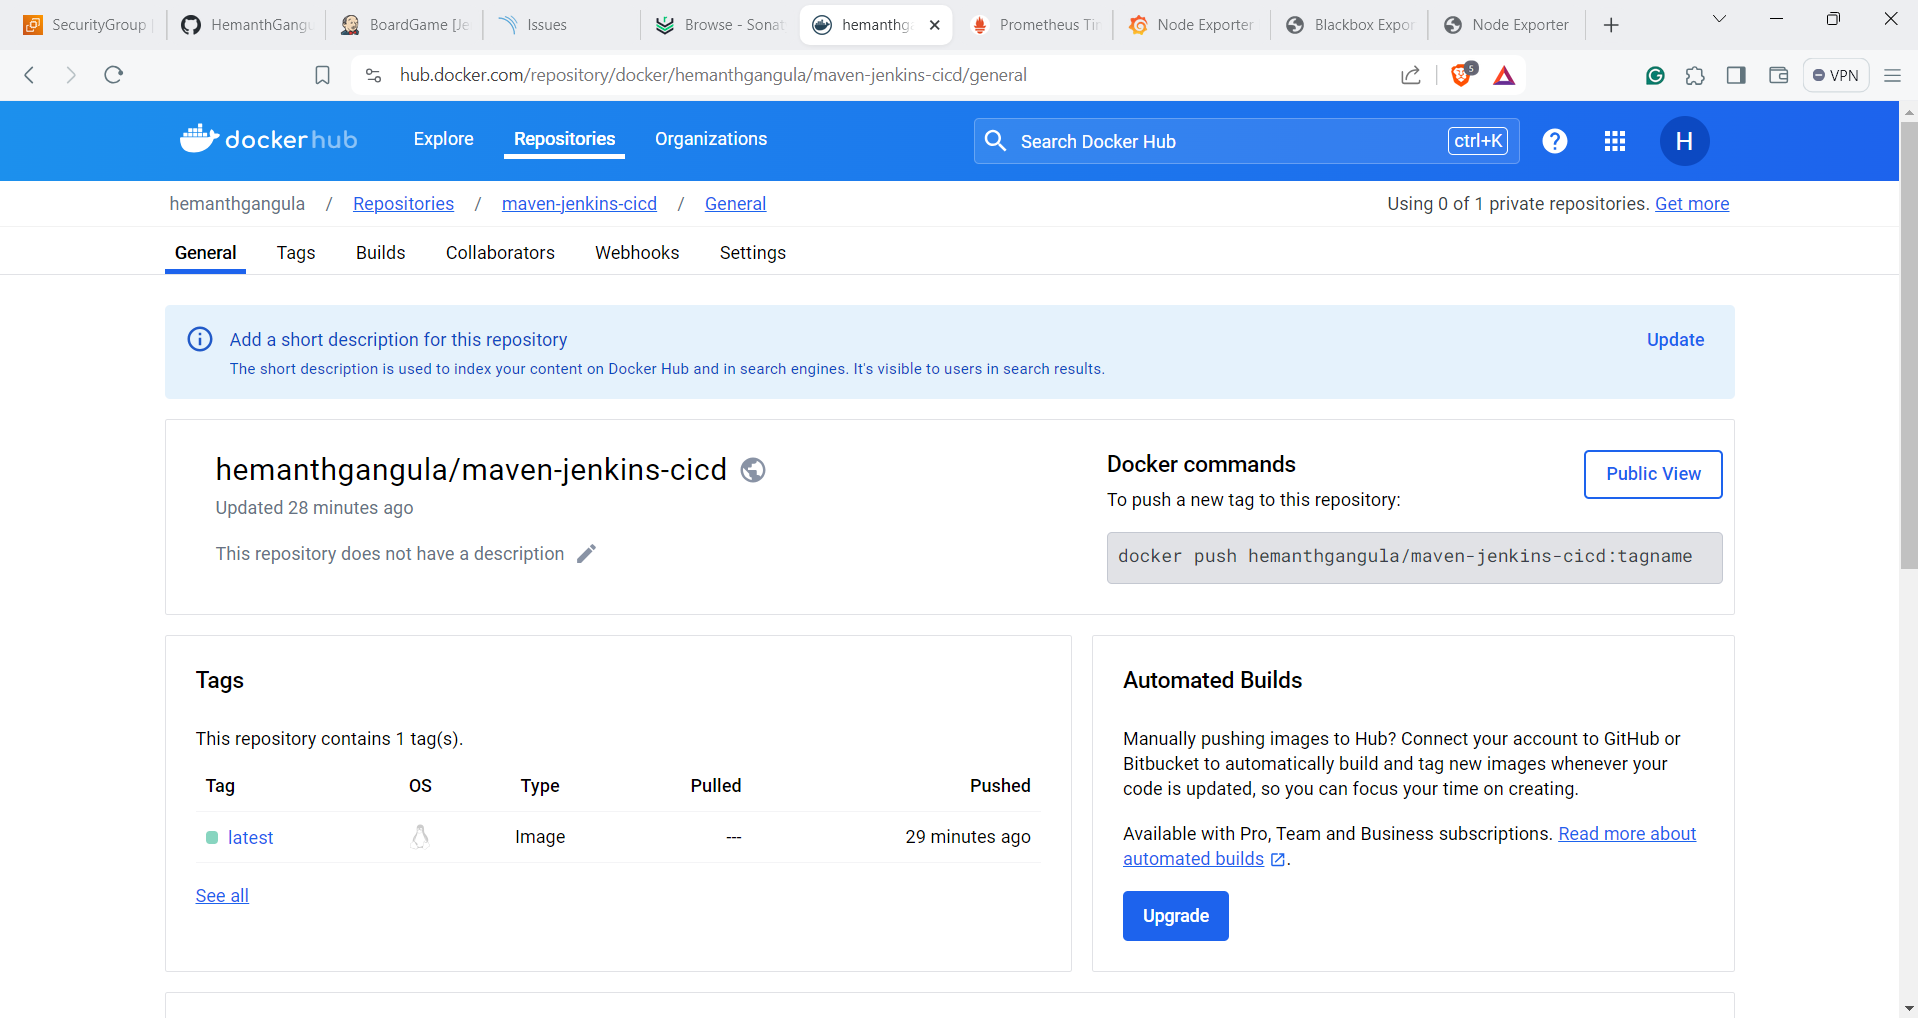
Docker pushes the tagged images to the Docker registry for future deployment.
"You can find the project on my DockerHub repository. "
Kubernetes Deployment:
- Kubernetes orchestrates the deployment of containerized applications onto the cluster.
Deployment Verification:
- Post-deployment, verification ensures the successful deployment and functioning of the application.
Email Notification:
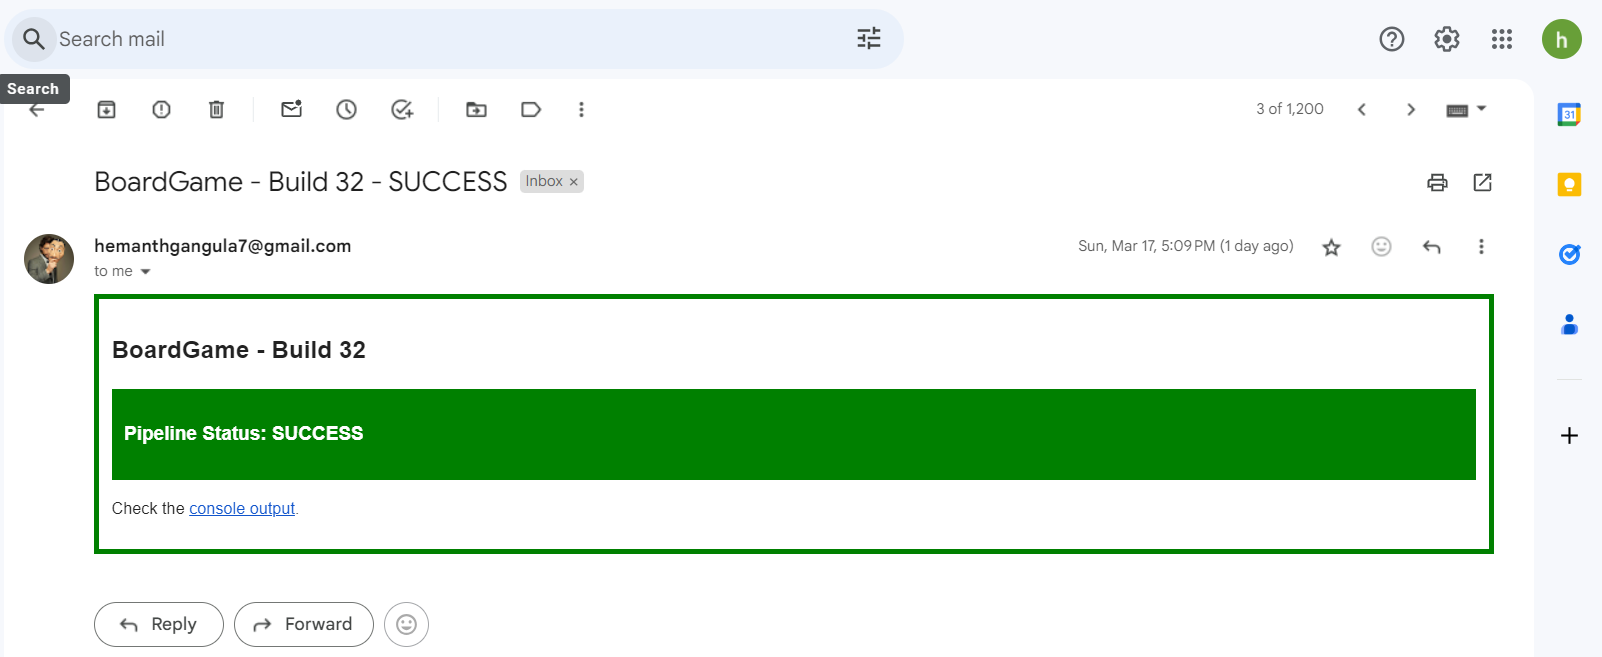
Email notifications are sent to relevant stakeholders upon completion, providing updates on the build status.
Monitoring :
Establish a robust monitoring framework within the VM environment, encompassing both website and system monitoring functionalities to ensure comprehensive oversight of application health and performance.
Blackbox: Conducts probes on URLs and endpoints, monitoring website availability and response times. (Website Monitoring)
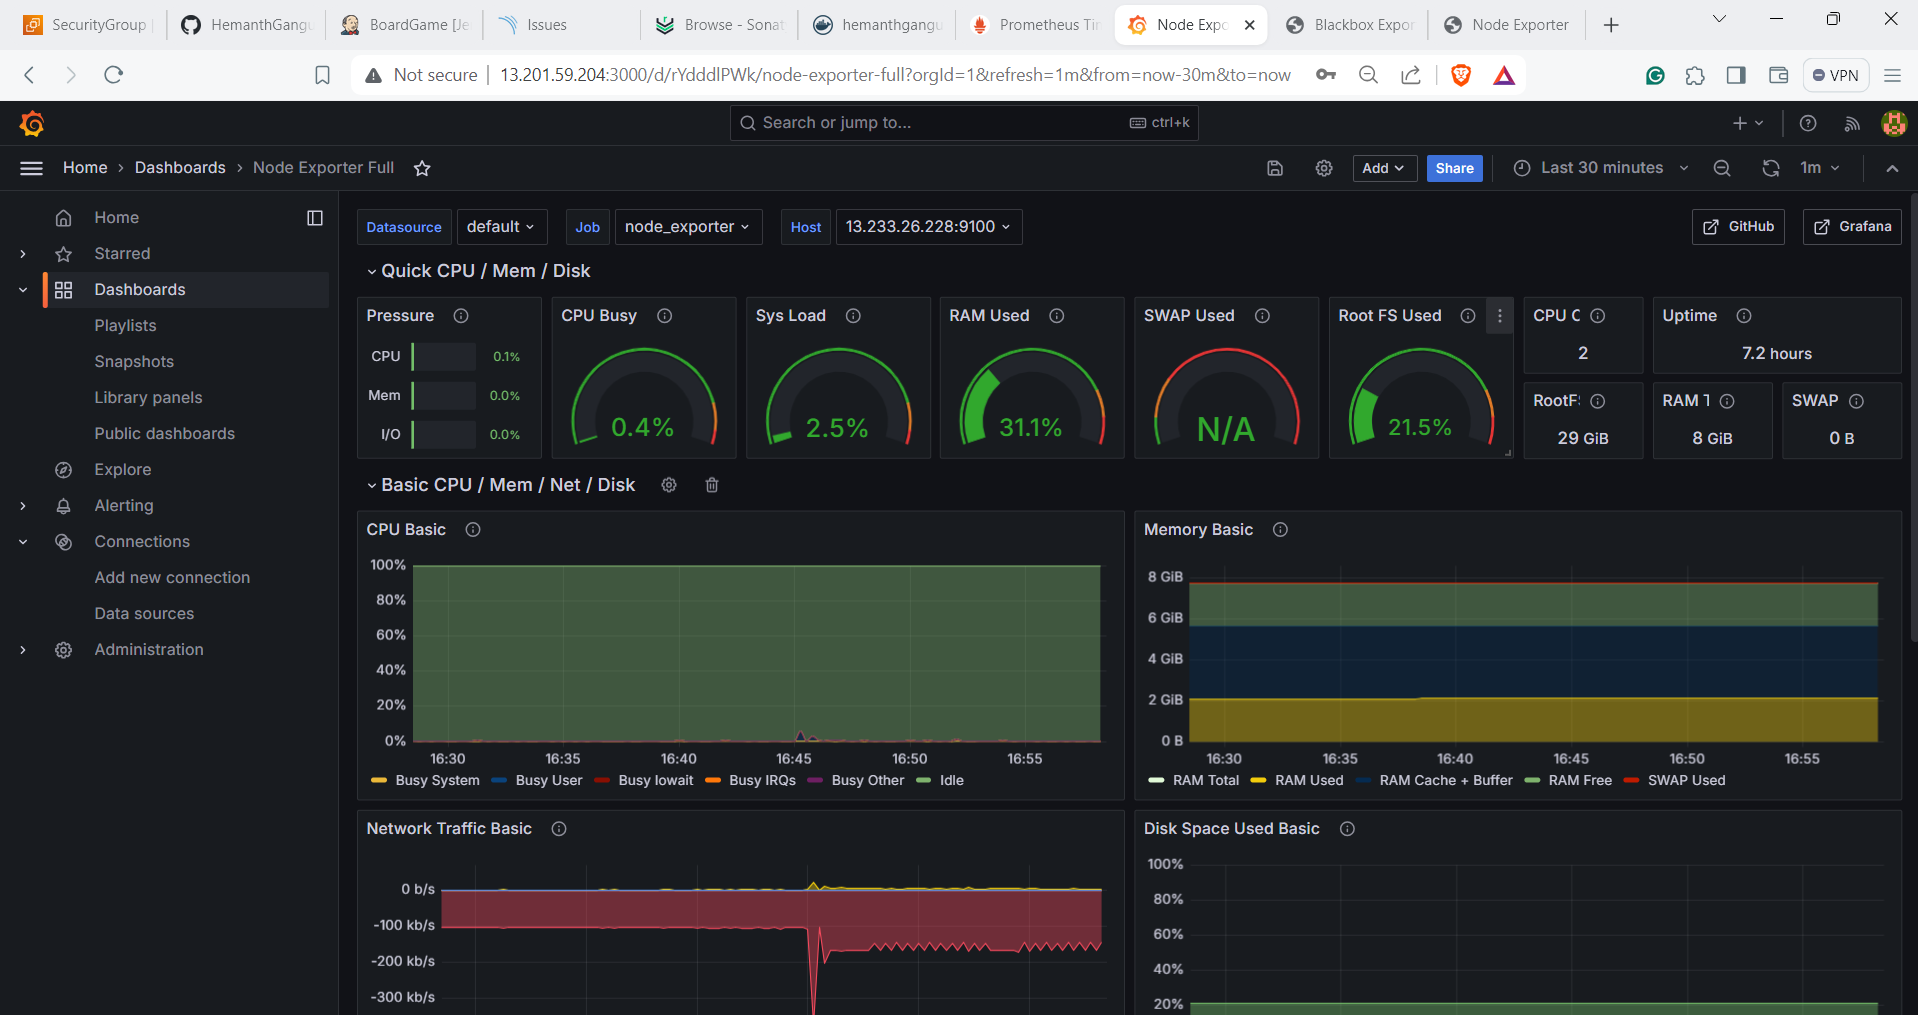
Node Exporter: Gathers CPU, memory, disk I/O, and network traffic metrics, providing insights into system health.(System Monitoring)
Prometheus: Collects time-series data from exporters, and supports powerful querying and alerting functionalities for real-time monitoring.
Grafana: Creates interactive dashboards and visualizations, enabling intuitive analysis of metrics collected by Prometheus and other data sources.
The images below demonstrate website monitoring is achieved through utilizing Blackbox for probing, Prometheus for data collection, and Grafana for visualization.
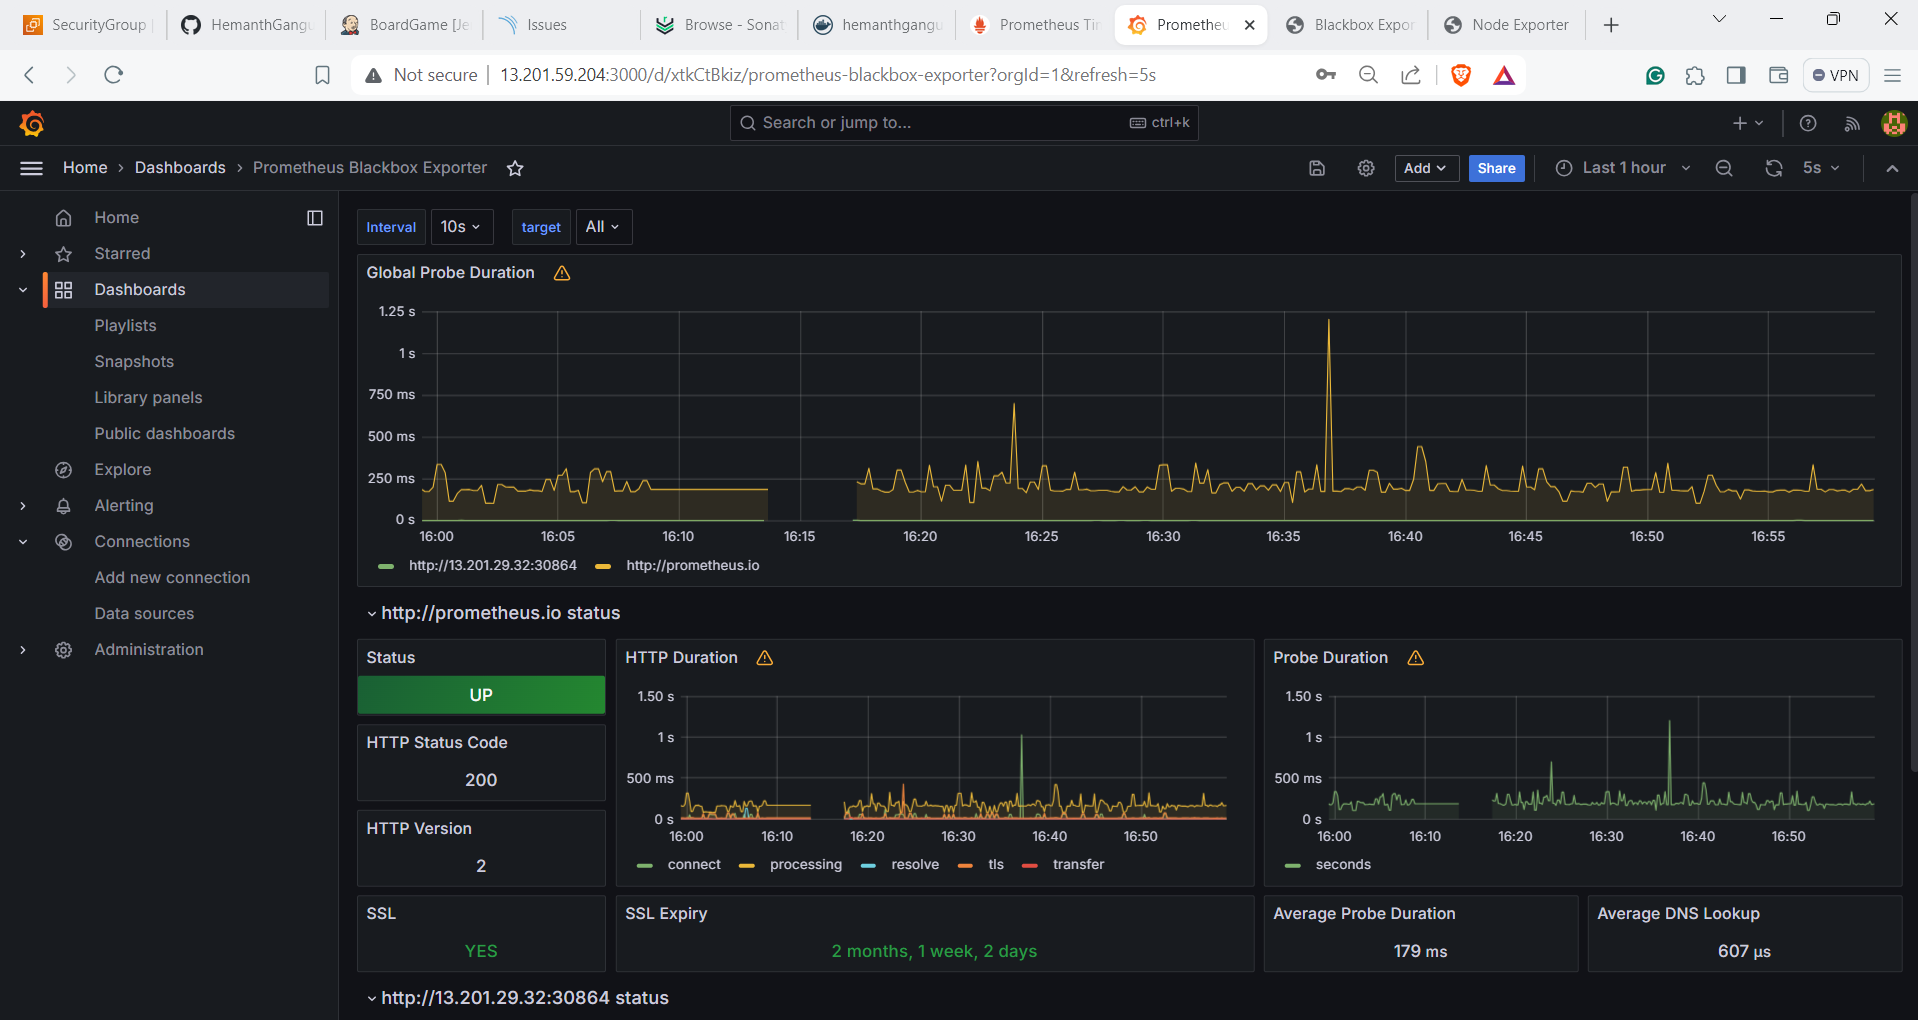
Below, you'll find an illustration showcasing website monitoring in action. This monitoring process is orchestrated through the utilization of Blackbox for probing, Prometheus for data collection, and Grafana for visualization.
Conclusion
The implementation of an end-to-end CI/CD pipeline for the BoardgameListingWebApp marks a significant advancement in development efficiency and software quality.
Integration of tools like Jenkins, SonarQube, Nexus, Docker, Kubernetes, and robust monitoring solutions ensures seamless code integration, testing, deployment, and monitoring.
Utilization of Blackbox, Node Exporter, Prometheus, and Grafana enhances visibility, security, and reliability throughout the development lifecycle.
This holistic approach streamlines the software delivery process, driving innovation and excellence in software engineering.
Moving forward, the project serves as a testament to the power of automation and continuous improvement in software development.
"Patience and perseverance pave the path to triumph. 🌟 Keep going; you're closer than you think! 🚀"
Subscribe to my newsletter
Read articles from Hemanth Gangula directly inside your inbox. Subscribe to the newsletter, and don't miss out.
Written by

Hemanth Gangula
Hemanth Gangula
🚀 Passionate about cloud and DevOps, I'm a technical writer at Hasnode, dedicated to crafting insightful blogs on cutting-edge topics in cloud computing and DevOps methodologies. Actively seeking opportunities in the DevOps domain, I bring a blend of expertise in AWS, Docker, CI/CD pipelines, and Kubernetes, coupled with a knack for automation and innovation. With a strong foundation in shell scripting and GitHub collaboration, I aspire to contribute effectively to forward-thinking teams, revolutionizing development pipelines with my skills and drive for excellence. #DevOps #AWS #Docker #CI/CD #Kubernetes #CloudComputing #TechnicalWriter