OS Error: Too many open files. Understanding file and socket descriptors.
 Venkat Raman
Intro
Engineers who've built, deployed and operated backend services would've encountered this error. It usually means your service is serving real user requests - Yay 🎉 ! One possible scenario is - you need to fine-tune server OS configuration to scale up, and the other is - there is resource leakage in your system.
I've encountered this error four times so far in 8 years of my career. Wanted to write and share as it was always interesting.
Let's start with resource leakage.
Service written in kotlin using ktor
In late 2019, our team wanted to experiment with kotlin ktor as an alternative to SpringBoot. We wanted to quickly try it out in a simple microservice receiving just few hundred requests a day. Our app was deployed and serving customer requests for few days without any issue.There were no server restarts since deployment. One morning, 500 service error alerts were triggered. I was looking at the server logs and requests were accepted and erroring out in one of the processing steps. I reproduced this issue in prod env to gather recent logs and restarted the service. Bug was filed and was not yet prioritised (not a critical service receiving millions of requests). A couple days went by and the same issue started occurring in the evening. Our friend, server restart solved it again 😊
By this time, few L1 customer tickets were also filed, and I started looking into the issue. Prometheus showed that memory usage increased over time, and flatlined around time the service started rejecting requests. Also from the logs, we found that error started occurring in one of our processing steps where ktor okhttp client was used. Found this issue in github and upgrading the lib solved this issue.
Service written in python using langchain & openai lib
LangChain is a framework for developing applications (RAG & AI agents) powered by language models. Our app was deployed and serving customer requests for few days without any issue.There were no server restarts since deployment (see the pattern ?). One afternoon in early 2024, 500 service error alerts were triggered. I was looking at the server logs and requests were being rejected with OS Error: Too many open files. Good old server restart quickly fixed the error and the service started serving user requests. My immediate hunch (from ktor issue few years ago) was that there was an underlying resource leakage.
I wanted to reproduce this issue in staging environment. A quick google search showed this issue. So, I monitored the below while simulating few 100 requests
Processes grouped by name & connection status, sorted by count
Local and remote addr of connections in
CLOSE_WAITstatus
And the remote addr matched OpenAI' api domain. Since Langchain uses LLM provider's client lib to connect and interact with the models, the leak should be in OpenAI client lib. A quick search on openai github issue showed that it was addressed and fixed already. So our fix was to upgrade the underlying openai lib version. The fix was verified in staging and rolled out to customers.
There is a small difference in how 500 service errors were triggered in above services. Kotlin service using ktor server accepted the request and errored out in one of the processing steps that ktor okhttp client. Python service using Flask server errored out while accepting the request for processing. I will punt this for now and cover in a separate post at a later time as it deals with difference in server frameworks.
Before fine-tuning server configuration to scale up let's understand network connections.
Understanding connections & OS files
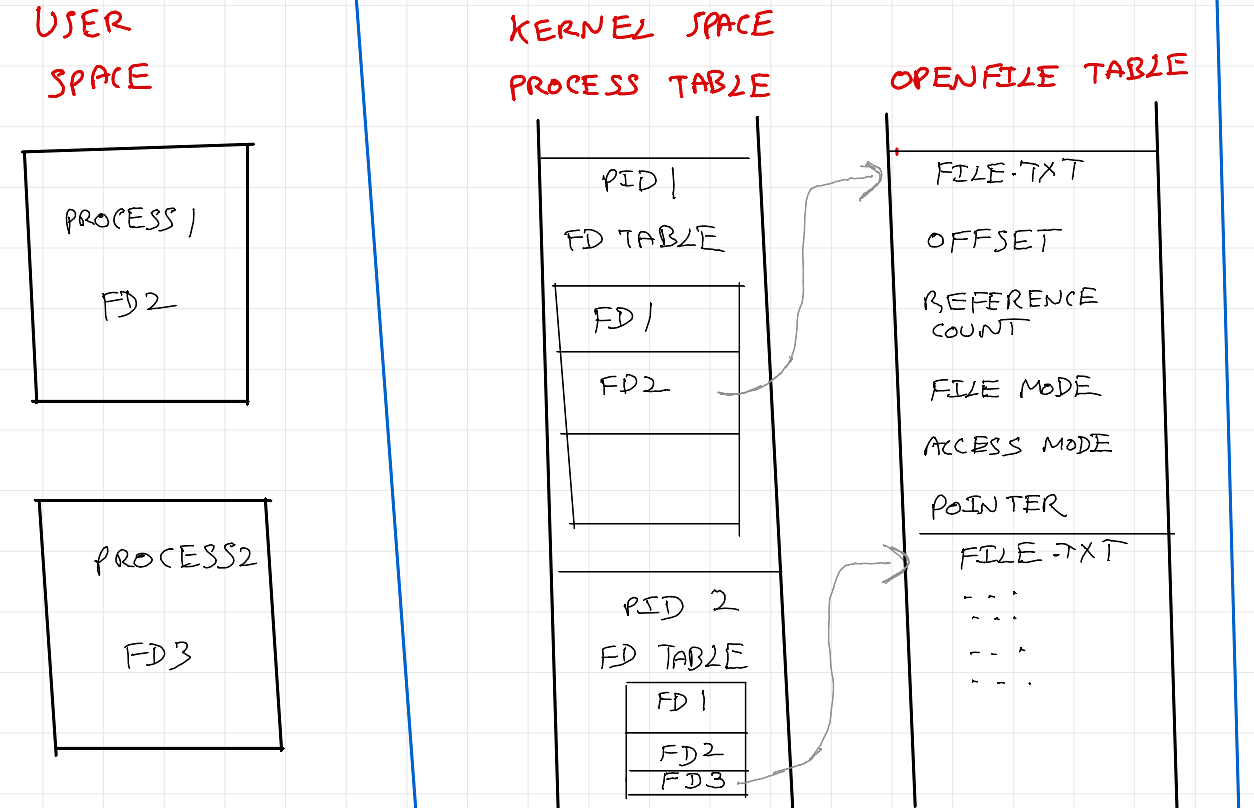
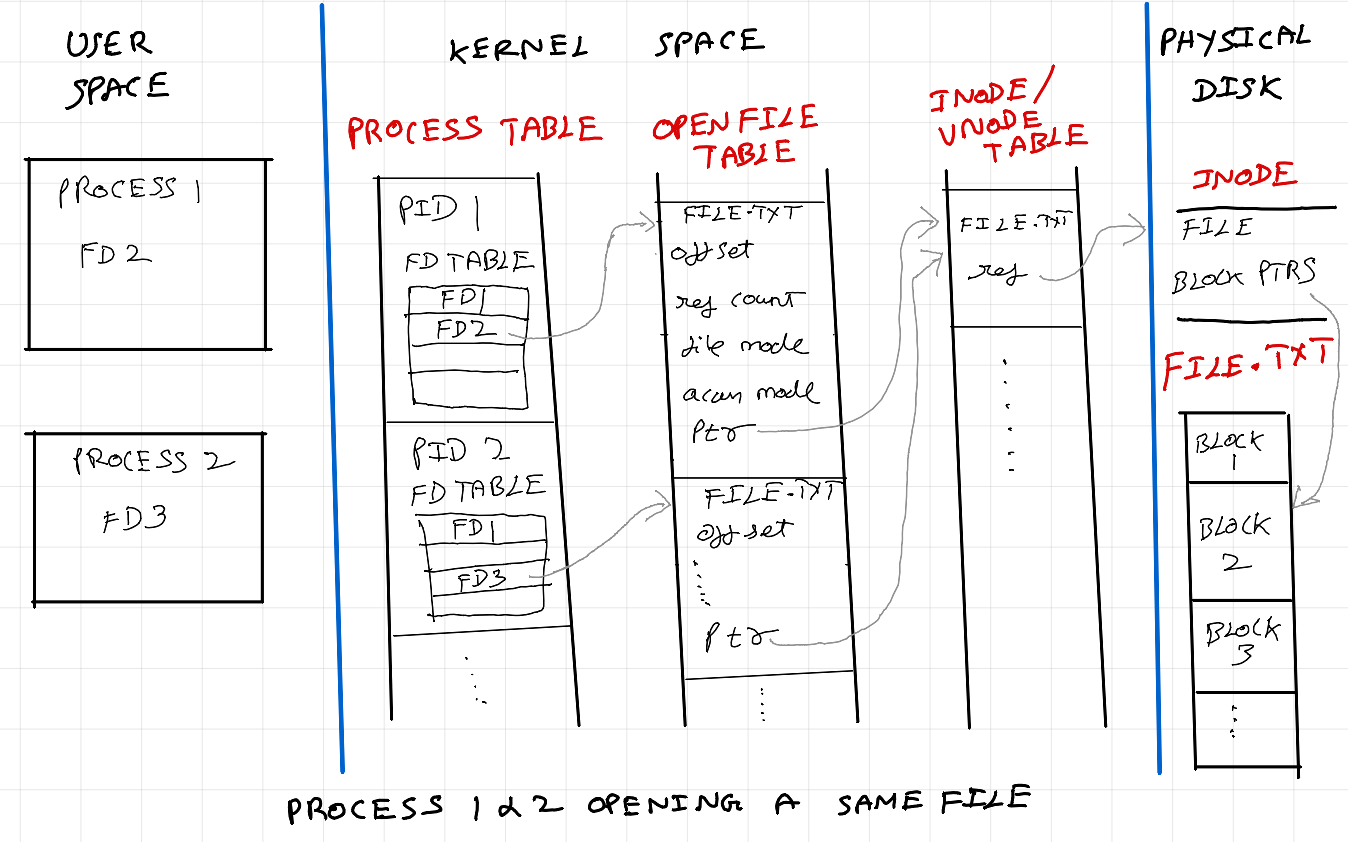
Opening a file
When a process opens a file, a file descriptor with the following metadata is created: the file position (offset), access mode (read, write, or both), file status flags (such as whether the file is open for appending or is non-blocking), and a reference to the corresponding file table entry in the kernel's file descriptor table. When the file is closed, the file descriptor is released, freeing up system resources associated with the file and removing its entry from the process's file descriptor table.

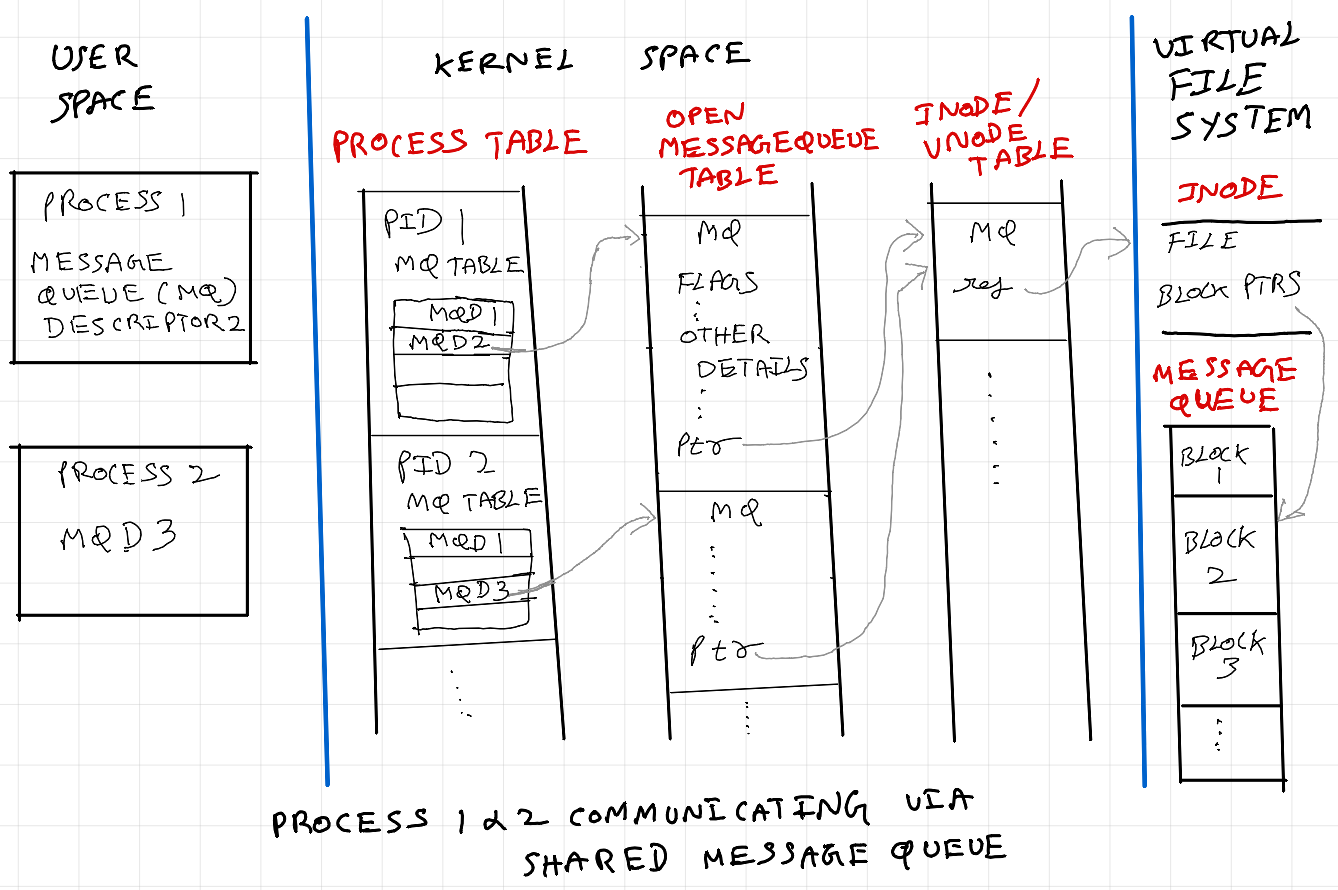
IPC via shared message queue
Processes on the same machine often use Inter-Process Communication (IPC) mechanisms like message queues for data exchange. Message queues are associated with unique identifiers, akin to file descriptors, enabling processes to access them using standard file I/O operations. They provide synchronization and data buffering, facilitating asynchronous communication and enabling processes to operate independently without waiting for message exchange.

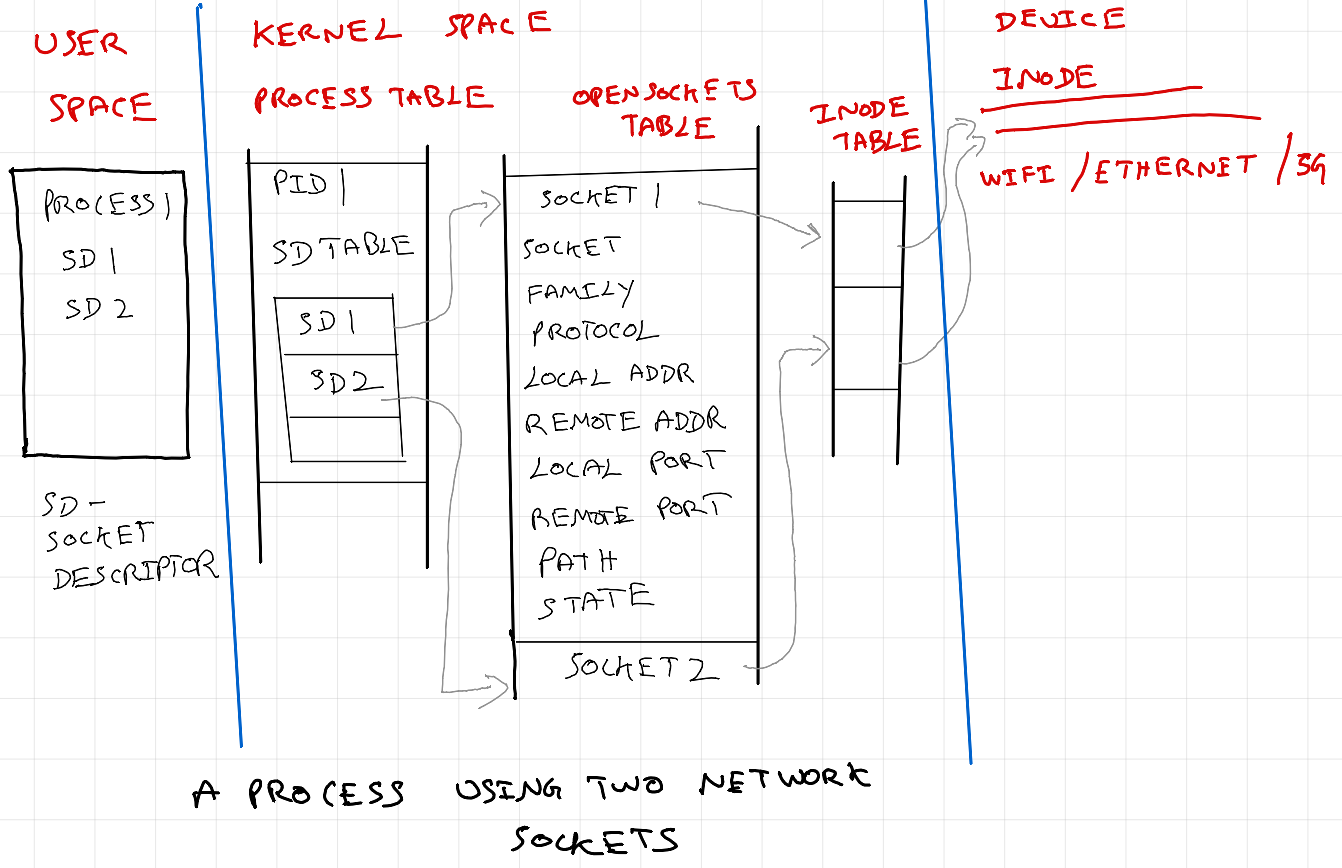
Client server communication via HTTP
Similarly in a client server communication when a HTTP request is made, the library uses processes or threads, and a network file descriptor with the following metadata is created: the network socket type (TCP or UDP), the local and remote addresses and ports, socket options (such as whether the socket is reusable or whether it's in blocking or non-blocking mode), and a reference to the corresponding socket data structures in the operating system's networking stack.

Message queue descriptor and Open MQ descriptor table; Socket descriptor and Open socket descriptor table are all considered and treated as file descriptor and file descriptor table by OS (Linux and POSIX). So far, we discussed high level overview of file descriptors. See references at the end for more details.
ulimit
ulimit is a command-line utility in Unix-like operating systems used to control and report resource limits for processes. It can be used to set limits on the maximum number of file descriptors that a process can open. This is important for preventing resource exhaustion and ensuring system stability. By adjusting the nofile (or open files) limit with ulimit, one can control how many files a process can have open simultaneously, including regular files, directories, pipes, and sockets.
Soft Limit: In the context of file descriptors, the soft limit might determine the maximum number of file descriptors a process can open. If a process tries to exceed the soft limit, it may receive warnings and / or errors, but it can continue operating within the limit
Hard Limit: The hard limit would establish the absolute maximum allowable number per process above which OS will terminate the process.
Load testing my GSOC Project
In my final semester I worked on building a HTTP Load Balancer on top of WSO2 gateway. The gateway core uses LMAX Disruptor - a high-performance inter-thread messaging library used by the London Stock Exchange, renowned for its "mechanical sympathy" approach. It facilitates low-latency, high-throughput messaging between threads, crucial for real-time financial trading systems, by minimizing contention and maximizing CPU cache efficiency. I will discuss about this is a separate blog post.
I wanted to run some benchmarks to see how my load balancer fared against nginx. I started hitting too many openfiles error. I had to make changes to OS configurations to increase the number of concurrent connections.
# /etc/security/limits.conf
#
#Each line describes a limit for a user in the form:
#
#<domain>        <type>  <item>  <value>
#

*         hard    nofile      500000
*         soft    nofile      500000
root      hard    nofile      500000
root      soft    nofile      500000

# End of file
#
# /etc/sysctl.conf - Configuration file for setting system variables
# See /etc/sysctl.d/ for additional system variables.
# See sysctl.conf (5) for information.
#

net.ipv4.netfilter.ip_conntrack_max = 32768
net.ipv4.tcp_tw_recycle = 0
net.ipv4.tcp_tw_reuse = 1
net.ipv4.tcp_orphan_retries = 1
net.ipv4.tcp_fin_timeout = 5
net.ipv4.tcp_max_orphans = 32768
net.ipv4.ip_local_port_range = 1025    61000
You can refer it here as well: https://github.com/wso2-incubator/HTTP-Load-balancer/tree/master/performance-benchmark/test-bed
Optimizing resources and auto scaling policy for spring boot microservice
I wanted to evaluate how many concurrent connections our single container can handle to optimize autoscaling policy. Default ECS container ulimit is 1024. After ~600 parallel user requests, with memory & cpu utilization of ~50% & 30% respectively, I started seeing too many open files errors. p99 for these 600 parallel user requests was 2s. I increased container ulimit to 2400, and also increased db & HTTP connection pool size (will write about why connection pool is important in a separate post). With the increased limits & optimizations the benchmark showed more than 90% memory and 60% cpu utilization. Based on these, autoscaling was set to trigger at 85% memory utilization.
Thanks for reading !
References
https://man7.org/tlpi/download/TLPI-52-POSIX_Message_Queues.pdf
https://www.usna.edu/Users/cs/wcbrown/courses/IC221/classes/L09/Class.html
https://www.codequoi.com/en/handling-a-file-by-its-descriptor-in-c/
https://docs.aws.amazon.com/AmazonECS/latest/APIReference/API_Ulimit.html
https://osquery.io/schema/5.11.0/#process_open_files
https://osquery.io/schema/5.11.0/#process_open_sockets
Subscribe to my newsletter
Read articles from Venkat Raman directly inside your inbox. Subscribe to the newsletter, and don't miss out.
Written by

Venkat Raman
Venkat Raman
🧑💻 Research & Engineering - LLM Inference & High Performance systems. |📍Berlin 🇩🇪 | 📚 https://venkat.eu | 💬 https://twitter.com/Venkat2811