Adjusting Data Before Sending it to Kentik NMS
 Leon adato
In my ongoing exploration of Kentik NMS, I continue to peel back not only the layers of what the product can do but also the layers of information I quietly glossed over in my original example, hoping nobody noticed.
In this blog, I want to both admit to and correct one of the most glaring ones:
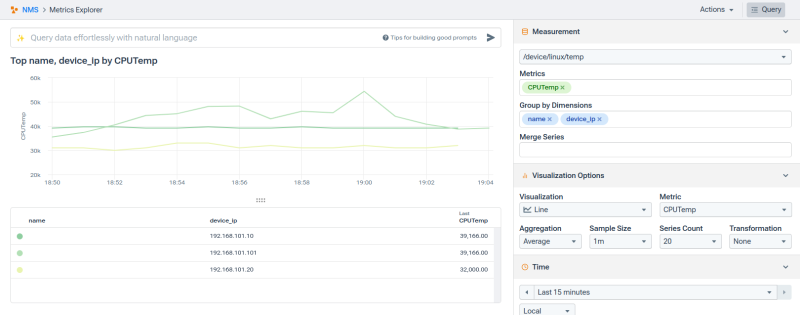
If that is the temperature of one of your devices, you should seek immediate assistance. I don’t want to alarm you, but that’s six times hotter than the surface of the sun.

In reality, the SNMP OID in question gives temperature in mC (microcelsius), so all we really need to do is divide by 1,000. But this opens the door to plenty of other situations where it’s not only nice but necessary to adjust metrics before sending them to Kentik NMS.
Starlark for the easily distracted
Kentik comes with scripting capabilities courtesy of Starlark (formerly known as Skylark), a Python-like language created by Google.
That last sentence will either set your mind at ease or send you running for the door, and I’m honestly not sure how I feel about it myself.
But, back to the task at hand, Starlark will let you take the values that come in via an OID and then manipulate them.
A script block, which goes in the reports file, must define a function called process with two parameters: the record and the index set. It typically looks like this:
reports:
  /foo/bar/baz:
    script: !starlark |
      def process(n, indexes):
          (do stuff here)
That’s really all you have to know for now.
To review, this is our Metric
If you missed the original post and don’t feel like going back and reading it, here are the essentials:
- Move to (or create if it doesn’t exist) the dedicated folder on the system where the Kentik agent (kagent) is running:
/opt/kentik/components/ranger/local/config
In that directory, create directories for /sources, /reports, and /profiles
Create three specific files:
Under /sources, a file that lists the custom OID to be collected
Under /reports, a file that associates the custom OID with the data category it will appear under within the Kentik portal
Under /profiles, a file that describes a type of device (Using the SNMP System Object ID) and the report(s) to be associated with that device type
Make sure all of those directories (and the files beneath them) are owned by the Kentik user and group:
sudo chown -R kentik:kentik /opt/kentik/components/ranger/
sources/linux.yml
version: 1
metadata:
  name: local-linux
  kind: sources
sources:
  CPUTemp: !snmp
    value: 1.3.6.1.4.1.2021.13.16.2.1.3.1
    interval: 60s
reports/linux_temps_report.yml
version: 1
metadata:
  name: local-temp
  kind: reports
reports:
  /device/linux/temp:
    fields:
      CPUTemp: !snmp
        value: 1.3.6.1.4.1.2021.13.16.2.1.3.1
        metric: true
    interval: 60s
profiles/local-net-snmp.yml
version: 1
metadata:
  name: local-net-snmp
  kind: profile
profile:
  match:
    sysobjectid:
      - 1.3.6.1.4.1.8072.*
  reports:
    - local-temp
  include:
    - device_name_ip
As I showed earlier in this post, that gives you data that looks like this in Metrics Explorer:

Notice that my temperature readings are up around the 33,000 mark? We gotta do something about that.

This is our metric on Starlark
First, we’ll do the simple math - dividing our output by 1000.
sources/linux.yml - stays the same
profiles/local-net-snmp.yml - stays the same
Our new reports/linux_temps_report.yml file becomes:
version: 1
metadata:
  name: local-temp
  kind: reports
reports:
  /device/linux/temp:
    script: !starlark |
      def process(n, indexes):
        n[’CPUTemp’].value = n[’CPUTemp’].value//1000
    fields:
      CPUTemp: !snmp
        value: 1.3.6.1.4.1.2021.13.16.2.1.3.1
        metric: true
    interval: 60s
Let’s take a moment to unpack the changes to this file:
under the category /device/linux/temp, we’re going to declare a starlark script
That script is going to take (is piped - | ) a process that includes
n, the record containing the data
indexes, the index set for the record
it pulls re-assigns the CPUTemp value from the record, replacing it with the original value divided by 1000
- To dig into the guts of Starlark for a moment, the two slashes (”//”) indicate “floored division” - which takes just the integer portion of the result.
The YAML file then goes on to identify the record itself, pulling the value from the OID 1.3.6.1.4.1 (and so on).
I’m going to re-phrase because what the file does is actually backward from what is happening:
The script: block declares the process but doesn’t run it. It’s just setting the stage.
The fields: block is the part that identifies the data we’re pulling. Every time a machine returns temperature information (a record set), that process is run, replacing the original CPUTemp value with CPUTemp/1000.
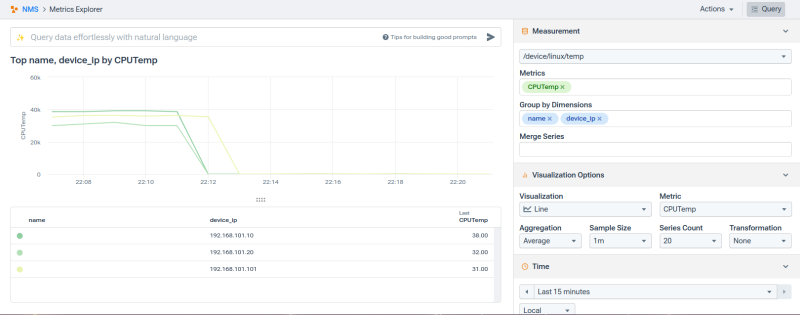
The result is an entirely different set of temperature values:
When you need a dessert topping AND a floor wax

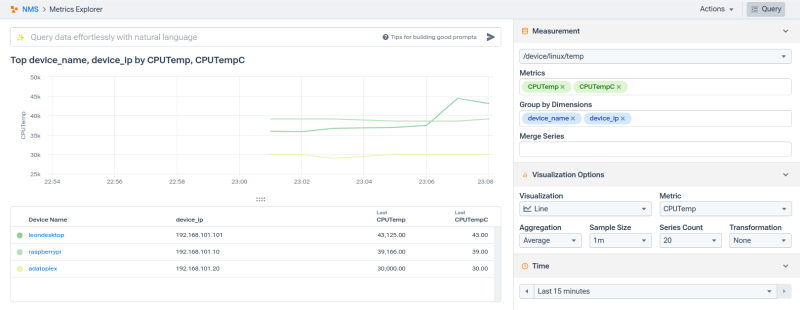
Sometimes, you need to do the math but also store (and display) the original value. In that case, you just need one small change:
version: 1
metadata:
  name: local-temp
  kind: reports
reports:
  /device/linux/temp:
    script: !starlark |
      def process(n, indexes):
        n.append(’CPUTempC’, n[’CPUTemp’].value//1000, metric=True)
    fields:
      CPUTemp: !snmp
        value: 1.3.6.1.4.1.2021.13.16.2.1.3.1
        metric: true
    interval: 60s
Making it more mathy!
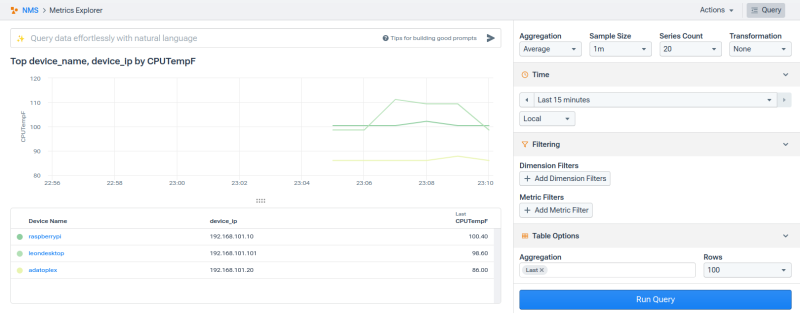
To build on the previous example, this is what it would look like if you wanted to take that Celsius result and convert it to Fahrenheit:
version: 1
metadata:
  name: local-tempF
  kind: reports
reports:
  /device/linux/tempF:
    script: !starlark |
      def process(n, indexes):
        n.append(’CPUTempF’, n[’CPUTemp’].value//1000*9/5+32, metric=True)
    fields:
      CPUTemp: !snmp
        value: 1.3.6.1.4.1.2021.13.16.2.1.3.1
        metric: true
    interval: 60s
Starlark for the un-wholesomely curious
There’s a lot more to say about (and explore with) Starlark, but I want to leave you with just a few tidbits for now:
Ranger will call the process function every time the report runs.
For table-based reports, the process function will be called once for each row.
create new records
maintain state across calls to process
combine data from multiple table rows
Scripts can be included in the report (as shown in this blog), or referenced as an external file:
script: !external
  type: starlark
  file: test.star
Building It Up
In my most recent blog on adding custom OIDs, I showed how to add a table of values instead of just a single item. The specific use case was providing temperatures for each of the CPUs in a system.
The YAML files to do that looked like this:
sources/linux.yml
version: 1
metadata:
  name: local-linux
  kind: sources
sources:
  CPUTemp: !snmp
    table: 1.3.6.1.4.1.2021.13.16.2
    interval: 60s
reports/temp.yml
version: 1
metadata:
  name: local-temp
  kind: reports
reports:
  /device/linux/temp:
    fields:
      name: !snmp
        table: 1.3.6.1.4.1.2021.13.16.2
        value: 1.3.6.1.4.1.2021.13.16.2.1.2
        metric: false
      CPUTemp: !snmp
        table: 1.3.6.1.4.1.2021.13.16.2
        value: 1.3.6.1.4.1.2021.13.16.2.1.3
        metric: true
    interval: 60s
profiles/local-net-snmp.yml
version: 1
metadata:
  name: local-net-snmp
  kind: profile
profile:
  match:
    sysobjectid:
      - 1.3.6.1.4.1.8072.*
  reports:
    - local-temp
  include:
    - device_name_ip
Incorporating what we’ve learned in this post, here are the changes. You’ll note that I’ve renamed a few things mostly to keep these new elements from conflicting with what we created before:
linux_multitemp.yml
version: 1
metadata:
  name: linux_multitemp
  kind: sources
sources:
  CPUTemp_Multi: !snmp
    table: 1.3.6.1.4.1.2021.13.16.2
    interval: 60s
This is effectively the same as the linux_temp.yml I re-posted from the last post. But again, I renamed the file, the metadata name, and the source name to keep things a little separate from what we’ve done.
linux_multitempsc_reports.yml
version: 1
metadata:
  name: local-multitempC
  kind: reports
reports:
  /device/linux/multitempC:
    script: !starlark |
      def process(n, indexes):
        n[’CPUTemp_Multi’].value = n[’CPUTemp_Multi’].value//1000
    fields:
      CPUname: !snmp
        table: 1.3.6.1.4.1.2021.13.16.2
        value: 1.3.6.1.4.1.2021.13.16.2.1.2
        metric: false
      CPUTemp_Multi: !snmp
        table: 1.3.6.1.4.1.2021.13.16.2
        value: 1.3.6.1.4.1.2021.13.16.2.1.3
        metric: true
    interval: 60s
The major change here is the addition of the script block. The other changes are simply renaming:
local_net_snmp.yml
version: 1
metadata:
  name: local-net-snmp
  kind: profile
profile:
  match:
    sysobjectid:
      - 1.3.6.1.4.1.8072.*
  reports:
    - local-temp
    - local-multitempC
  include:
    - device_name_ip
In this file, our addition strictly includes local-multitempC in the reports section.
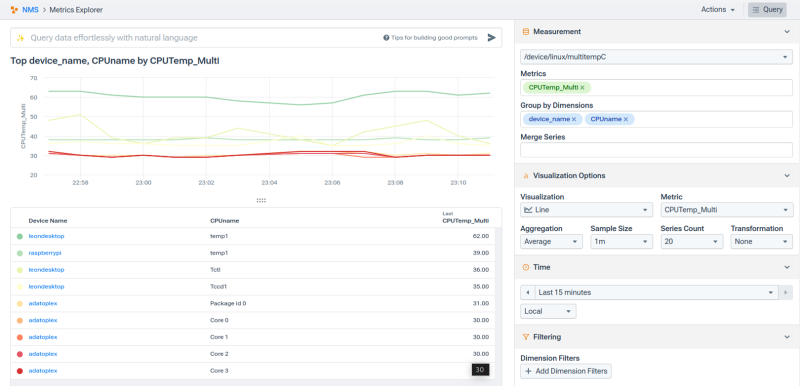
The result is a delightful blend of everything we’ve tested out so far. We have temperature values for each of the CPUs on a given system, and those values have been converted from microCelsius to Celcius.
Why Summarize When We Both Know I’m Not Done?
This post, along with all those that have come before, again highlights the incredible flexibility and capability of Kentik NMS. But there are so many more things to show! How to ingest non-SNMP data, how to add totally new device types, and how to install the NMS in the first place.
Wait… THAT HASN’T BEEN COVERED YET?!?!
Oof. I’d better get started writing the next post.
Subscribe to my newsletter
Read articles from Leon adato directly inside your inbox. Subscribe to the newsletter, and don't miss out.
Written by

Leon adato
Leon adato
In my sordid career, I have been an actor, bug exterminator and wild-animal remover (nothing crazy like pumas or wildebeests. Just skunks, snakes, and raccoons.), electrician, carpenter, stage-combat instructor, ASL interpreter, and Sunday school teacher. Oh, yeah, I've also worked with computers. While my first keyboard was an IBM selectric, and my first digital experience was on an Atari 400, my professional work in tech started in 1989 (when you got Windows 286 for free on twelve 5¼” when you bought Excel 1.0). Since then I've worked as a classroom instructor, courseware designer, helpdesk operator, desktop support staff, sysadmin, network engineer, and software distribution technician. Then, about 25 years ago, I got involved with monitoring. I've worked with a wide range of tools: Tivoli, BMC, OpenView, janky perl scripts, Nagios, SolarWinds, DOS batch files, Zabbix, Grafana, New Relic, and other assorted nightmare fuel. I've designed solutions for companies that were modest (~10 systems), significant (5,000 systems), and ludicrous (250,000 systems). In that time, I've learned a lot about monitoring and observability in all it's many and splendid forms.