How to make ChartJS Responsive in Phoenix LiveView
 Pau Riosa
1 min read
Table of contents

Package Versions
phoenix liveview -> 0.20.2
chart.js -> 4.4.2
Setup
// config setup
import Chart from "chart.js/auto";

export const BarChart = {
    dataset() {
        return JSON.parse(this.el.dataset.items);
    },
    labels() {
        return this.dataset().map((item) => item.label);
    },
    mounted() {
        const ctx = this.el;
        const data = {
              type: "bar",
              options: {
                //...add these
                responsive: true,
                maintainAspectRatio: false,
                //...other options
              },
              data: {
                labels: this.labels(),
                datasets: this.dataset(),
              },
            };
       const chart = new Chart(ctx, data);
    }
}
<!-- assuming you are using tailwind css -->
<div class="mx-auto grid max-w-2xl items-center grid-cols-1 grid-rows-1 items-start gap-x-8 gap-y-8 lg:mx-0 lg:max-w-none lg:grid-cols-1">
       <div class="w-full h-96">
            <canvas
              phx-hook="BarChart"
              id="overall-transaction-list"
              class="col-span-1"
              data-label="Overall Transactions"
              data-items={Jason.encode!(transactions)}
            >
            </canvas>
      </div>
</div>
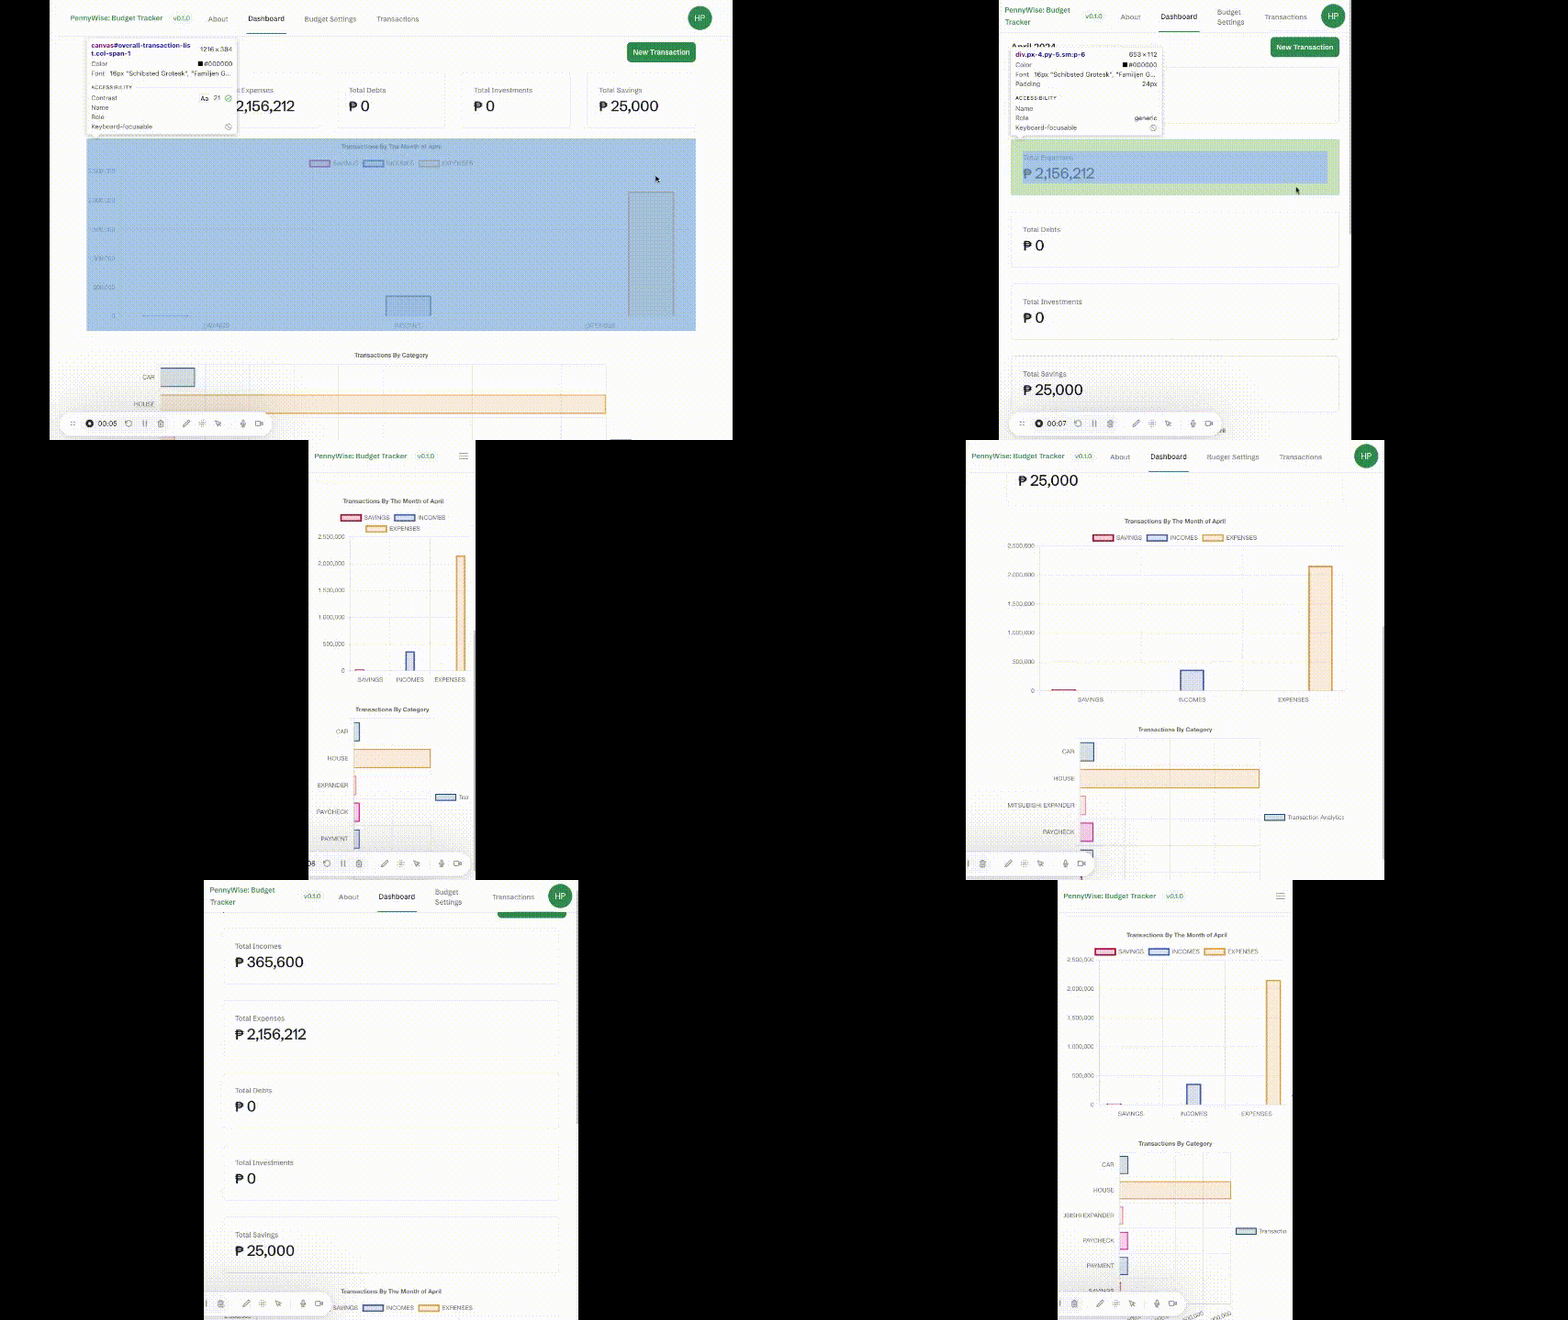
Voila!
A responsive chart!

Check out my new web application called PennyWise: Budget Tracker for more updates https://budget-tracker-dev.fly.dev/
Happy Coding!
0
Subscribe to my newsletter
Read articles from Pau Riosa directly inside your inbox. Subscribe to the newsletter, and don't miss out.
Written by

Pau Riosa
Pau Riosa
🎥 Youtuber 💻. Software Developer 📕 Blogger I am software developer who has passion for career development and software engineering. I love building stuff that can help people all around the world. Let's connect and share that idea!