Maximizing Performance: Step-by-Step Guide to Configuring Synthetic Monitoring in New Relic
 Alok Shankar
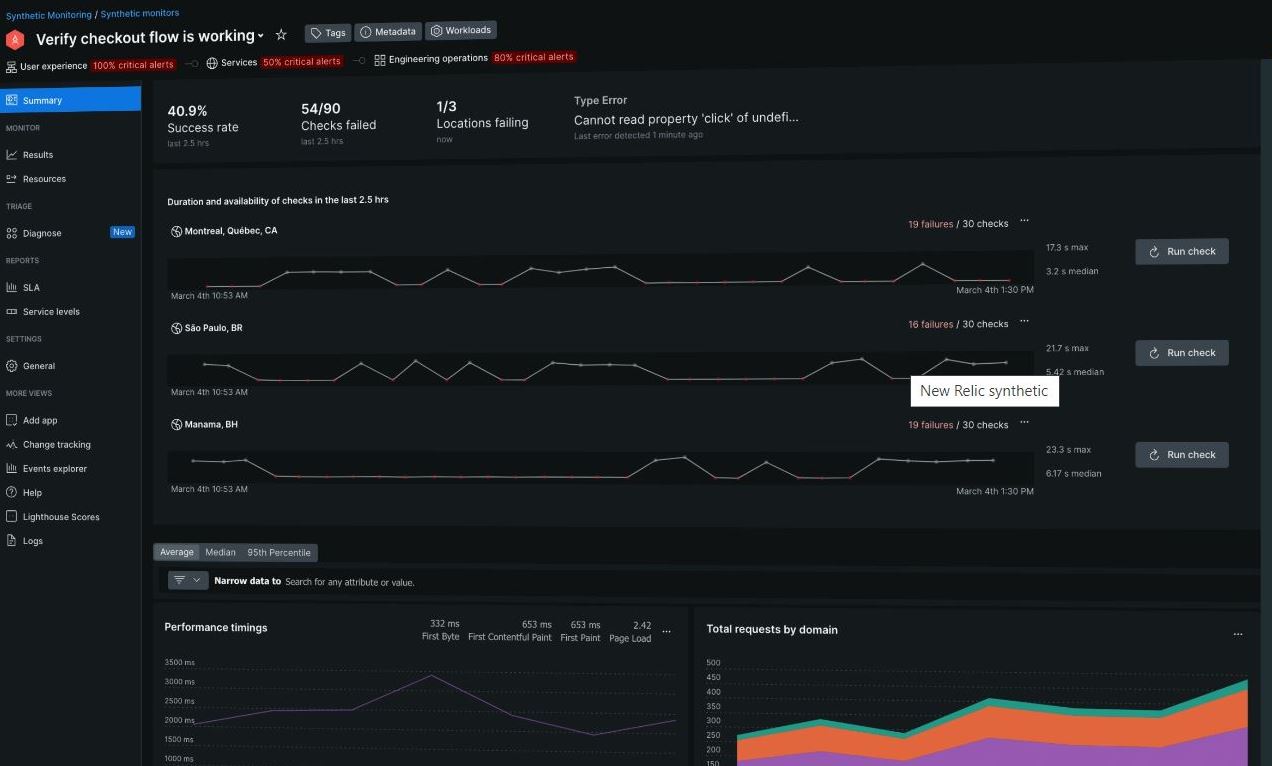
Introduction : Synthetic Monitoring is a special tool that pretends to be people using websites and apps. It watches how well your website works and tells you if anything goes wrong, like errors, server failures or things not working right, that might make users unhappy. Imagine it as a detective for your websites, always searching for problems. It’s smart because it makes fake users to check your website and find any issues before they bother real users.
This tool gives you information from all over the world. It helps make sure your app works well for everyone, whether they’re using a phone or a desktop.
So, take a deep breath, relax, and let New Relic Synthetic Monitoring keep your online world safe and sound, all day, every day.
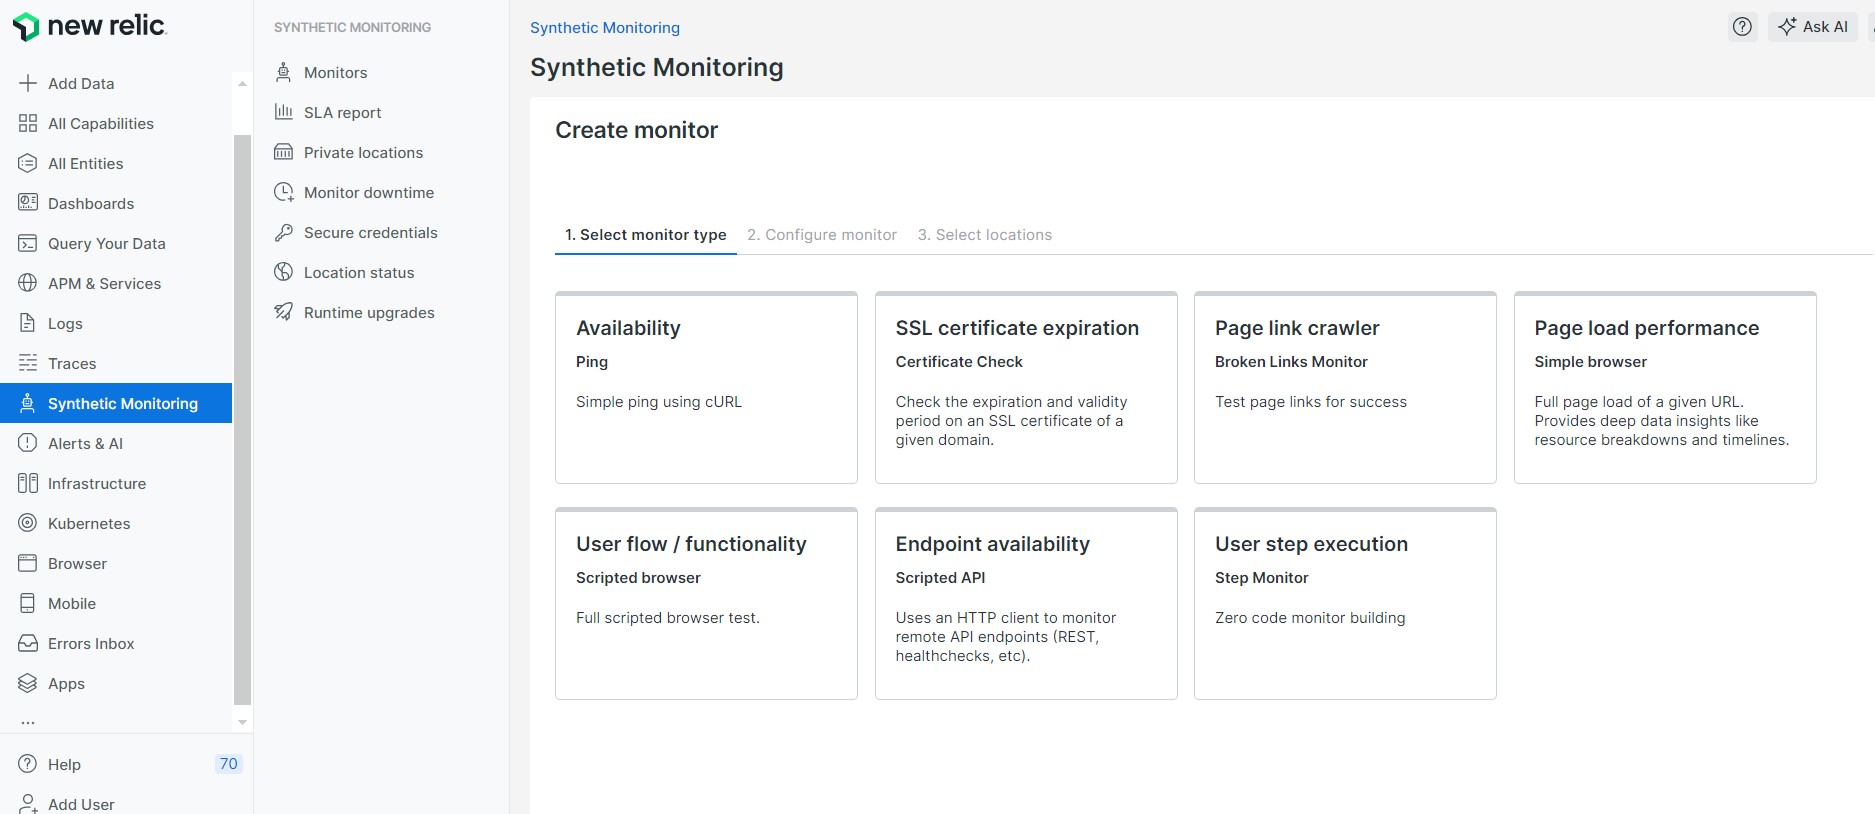
Types of Synthetic Monitor : New Relic primarily offers 7 different types of monitoring.
Availability (Ping)
SSL Certificate Expiration (Certificate Check)
Page Link Crawler (Broken Links Monitor)
Page Load Performance (Simple Browser)
User Flow/Functionality (Scripted Browser)
Endpoint Availability (Scripted API)
User Step Execution ( Step Monitor)
Prerequisite : Go to the New Relic Sign Up Page and register with the email associated with your company. Alternatively, you can sign up using Google.
What is Ping Monitor : Availability or Ping monitors are the simplest types of synthetic monitors. They will check if an application or website is online. The synthetic ping monitor uses a simple Java HTTP client to request your site from different locations.
Setup Availability (Ping) Monitoring in New Relic : Step By Step instructions for configuring the New Relic Synthetic Monitor on website’s Availability (ping)
Step 1: Select Availability (Ping) Synthetic Monitor in New Relic
After signing up, you’ll be directed to the New Relic dashboard. It displays all the available options.
Navigation route: one.newrelic.com > Synthetic monitoring > Create monitor
Then select the Availability (Ping) monitoring.
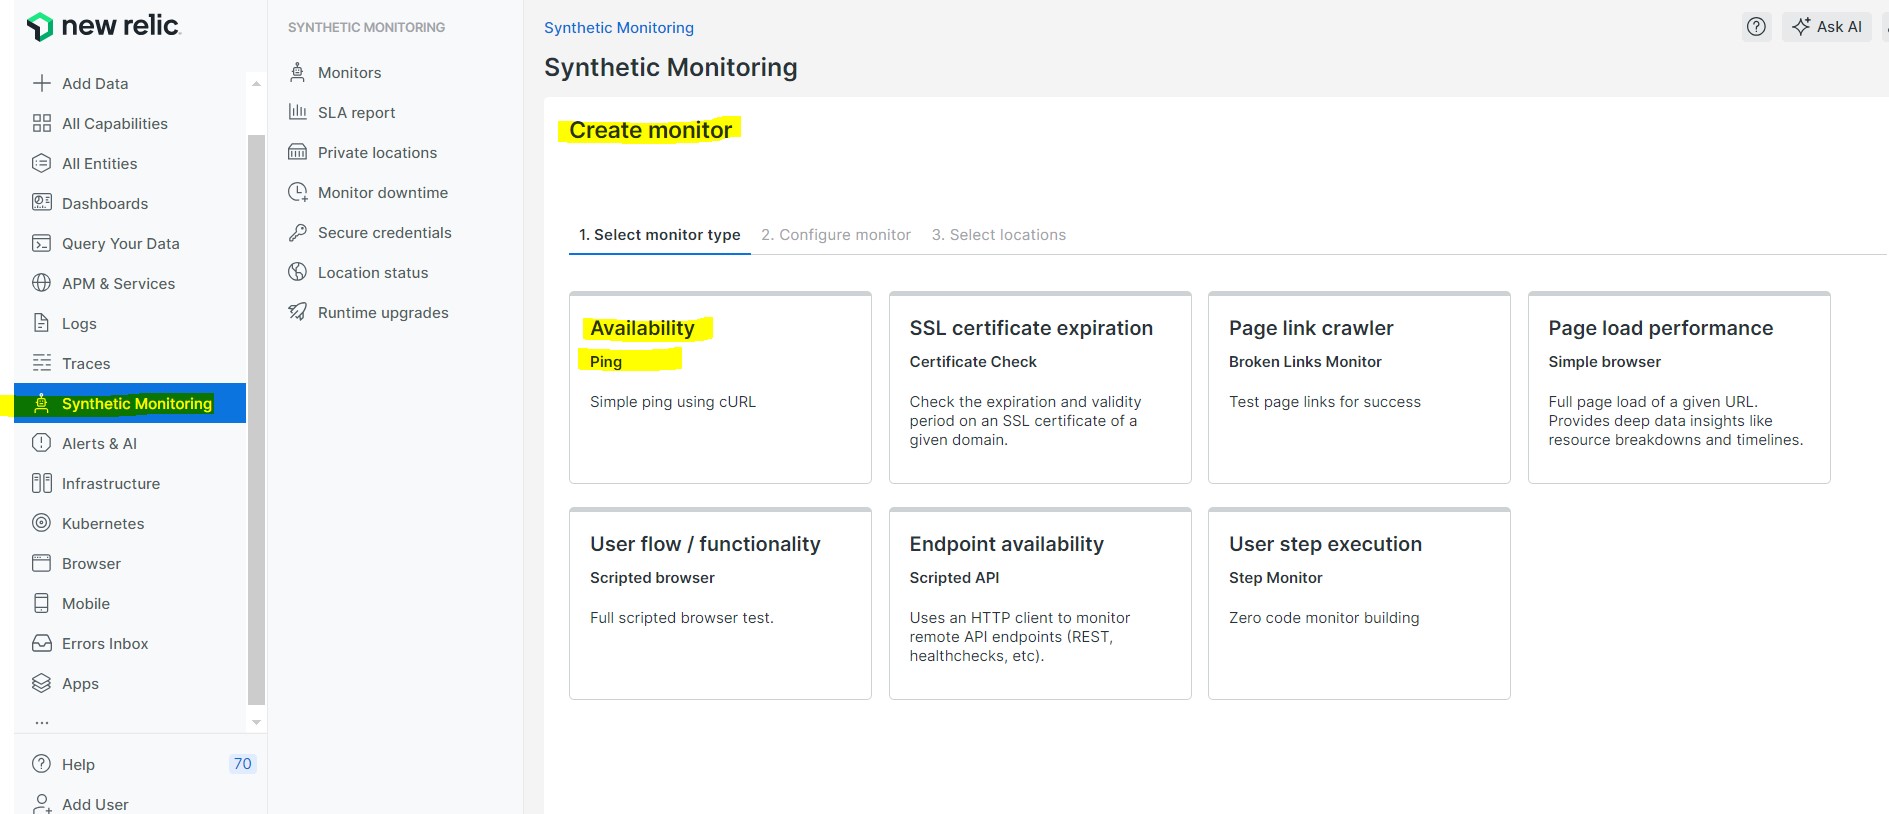
With New Relic Synthetic Availability monitoring, you can check if people from everywhere can visit your website without problems. Also, you can see how much time it takes for users to connect to your website.
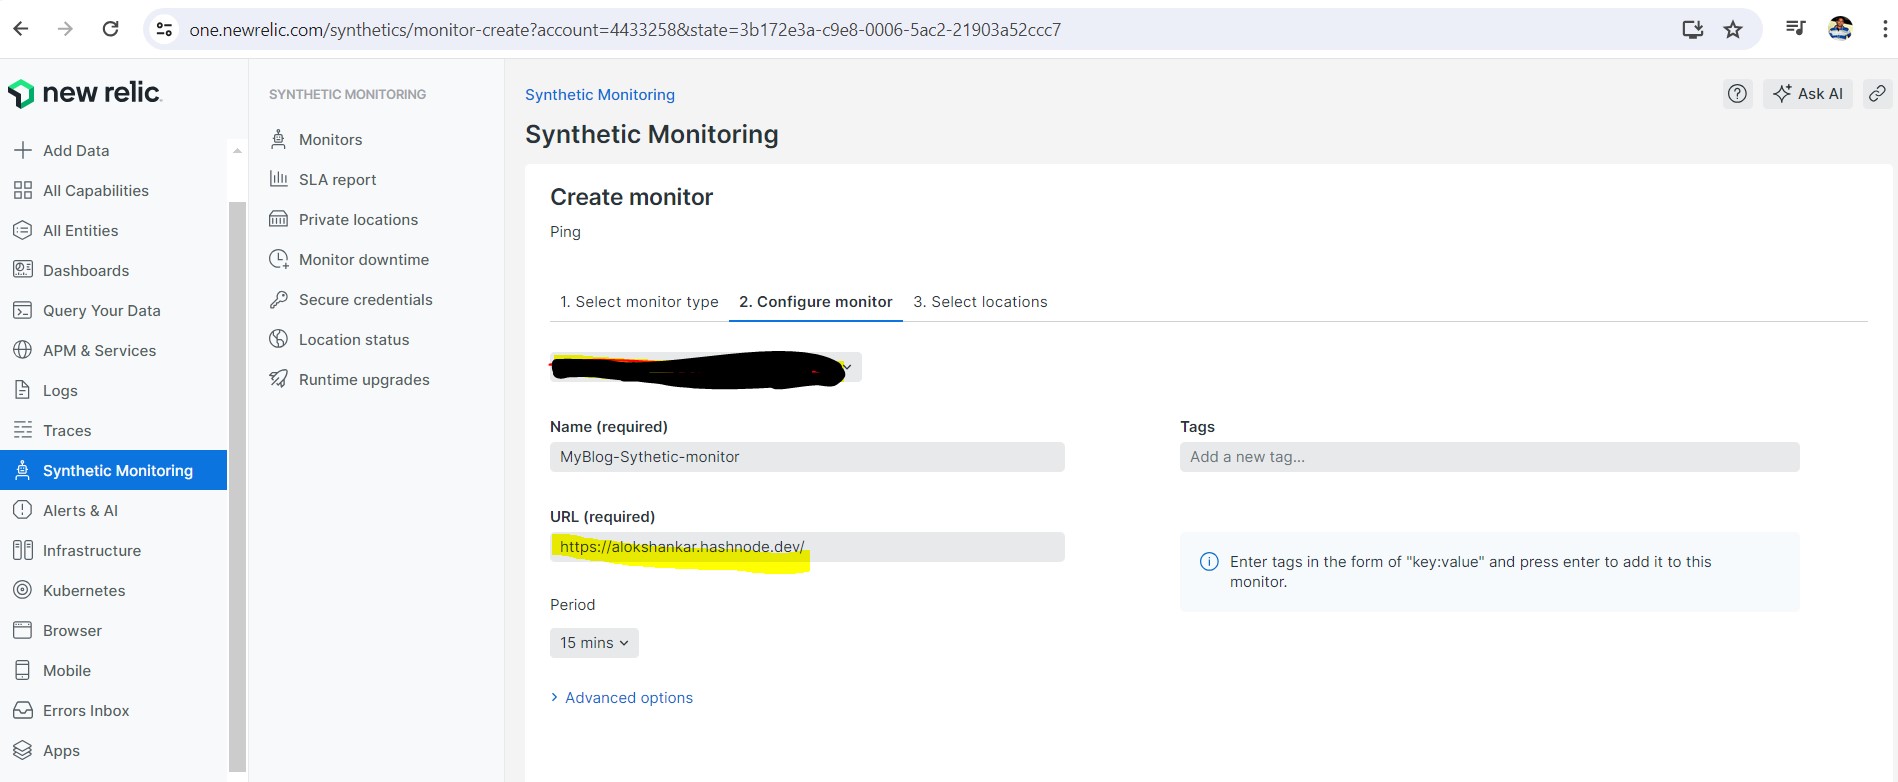
Step 2: Configure Monitor window
Name : Provide any relevant name of your monitor
URL : Enter the URL of the website which you want to begin monitoring
Period : Set the time frequency you want to keep the monitoring running
Step 3: Select Location for Availability monitor
Choose the locations where you want to check the availability. You can select from 20 major cities across six continents.
Since I want to test from Asia region, let’s choose 6 locations from Asia region.
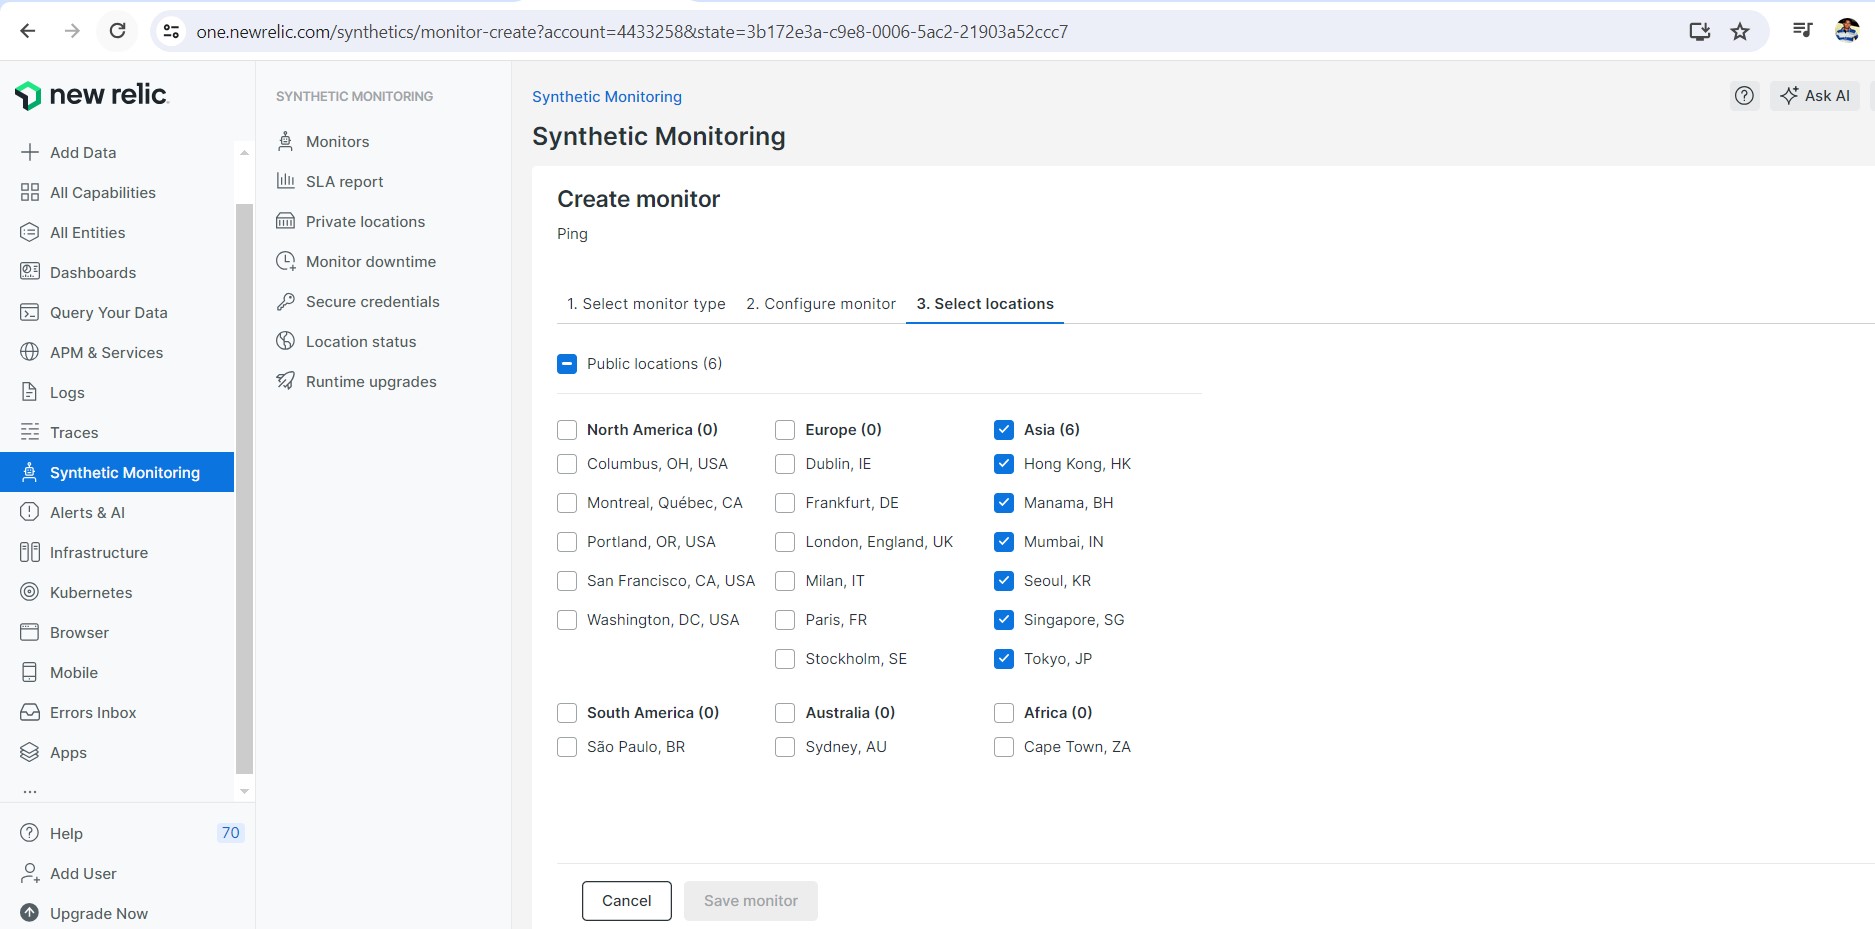
Your Synthetic Monitor on Availability is now ready and operational. It just needs a few hours to run the tests and get the information.
Step 4: Check Results for the Availability Monitor
You'll see a "Summary" button at the top of the dashboard. Clicking it will display how often things are working well, when they're not, and if your website isn't loading properly in any location.
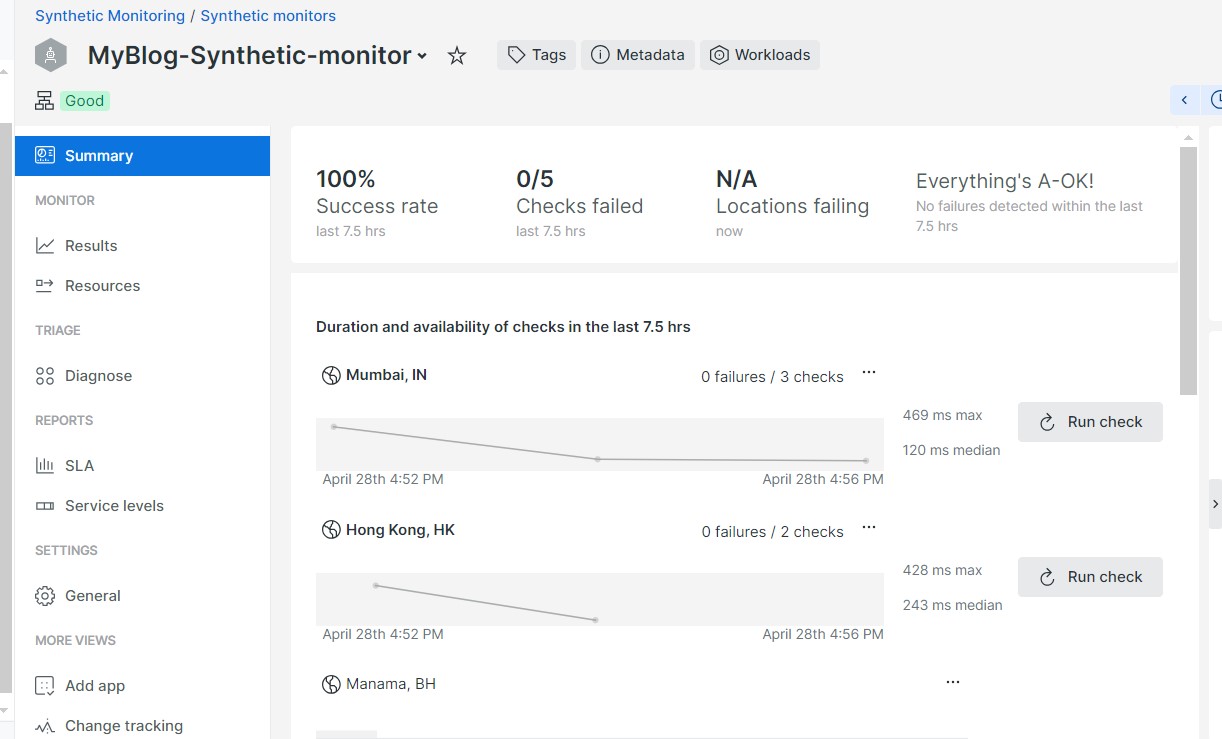
Click the Result button below the Summary button to see the full result. Here, you can look up the ping ratios for different places.
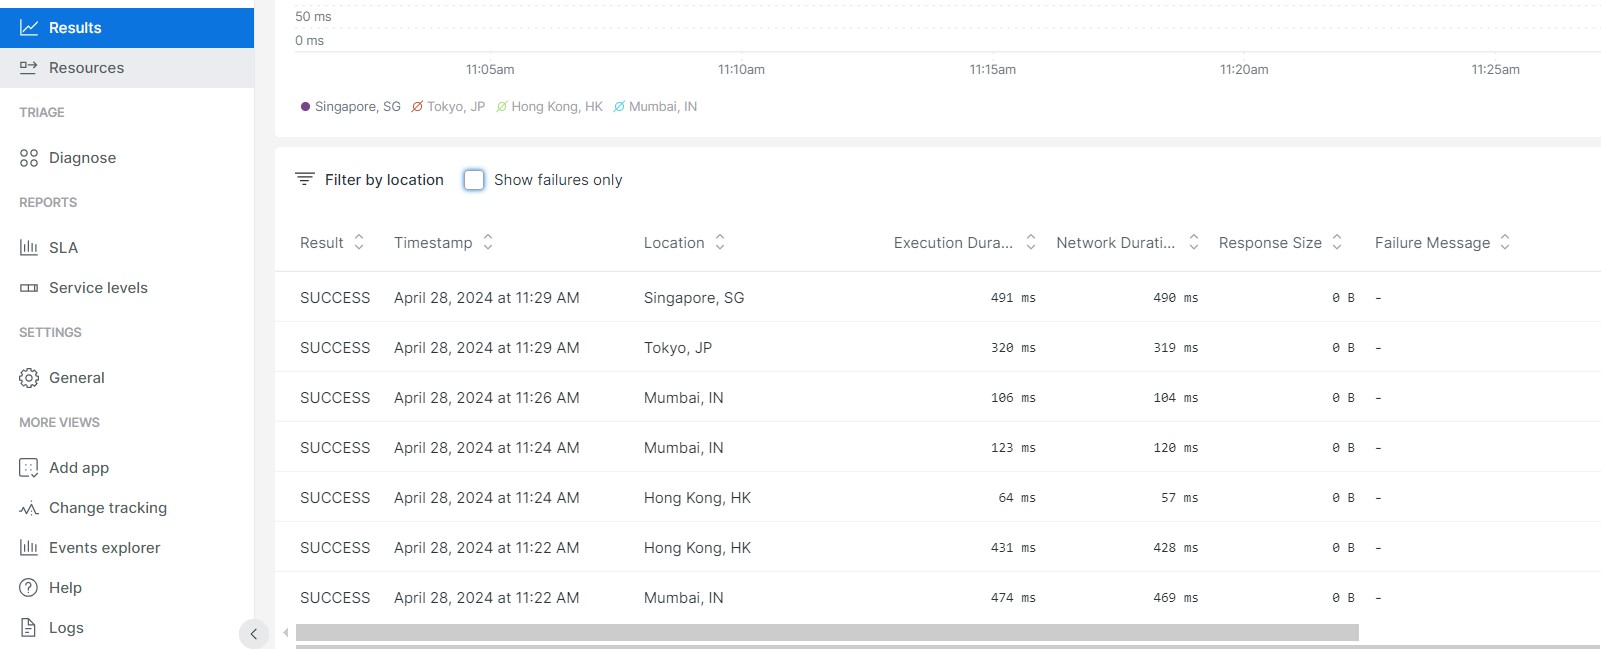
You can select location as a filter to see more information about its availability, response time and load time etc.
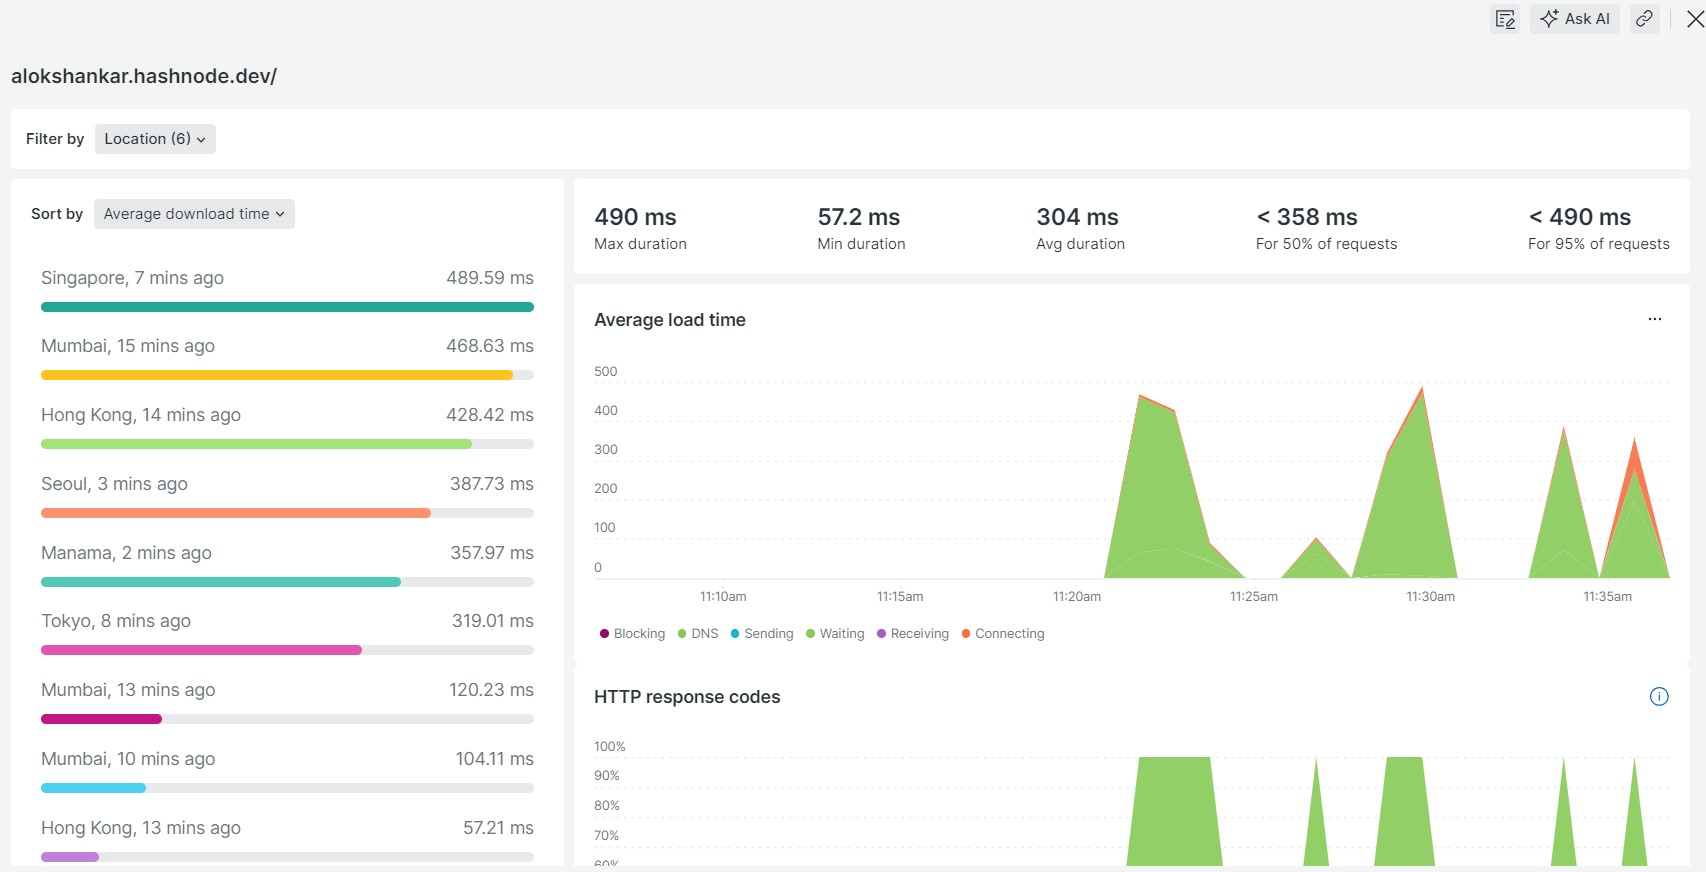
More info from specific location
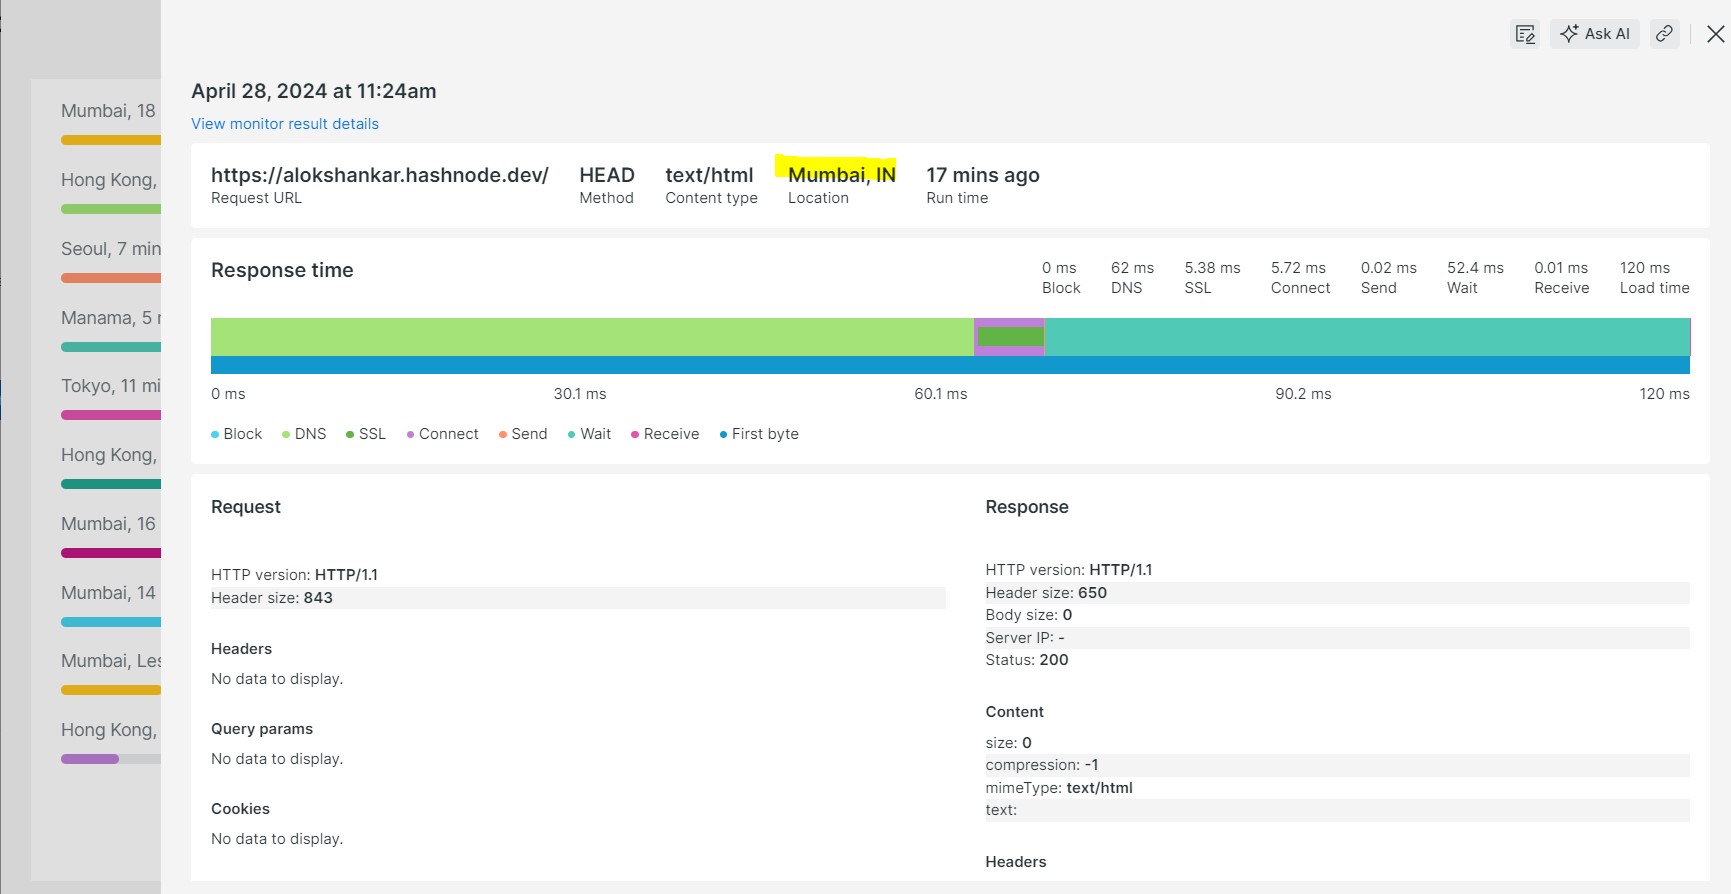
Now we have completed Availability (Ping) synthetic monitor.
Setup Page Load Performance Monitor (Simple Browser) in New Relic : Step By Step instructions for configuring the New Relic Synthetic Monitor on website’s Page Load performance (simple browser)
Step 1: Create Monitor
You can use this basic browser monitor to see if a single page is available and how well it's performing. It also helps you keep an eye on how much load the page is handling overall.
Page : https://alokshankar.hashnode.dev/badges
Navigation route: one.newrelic.com > Synthetic monitoring > Create monitor
1: Name your monitor : MyBlog-badges-page-performance
2: Enter the website’s URL : https://alokshankar.hashnode.dev/badges
3: Configure Monitor window : 15 Minute
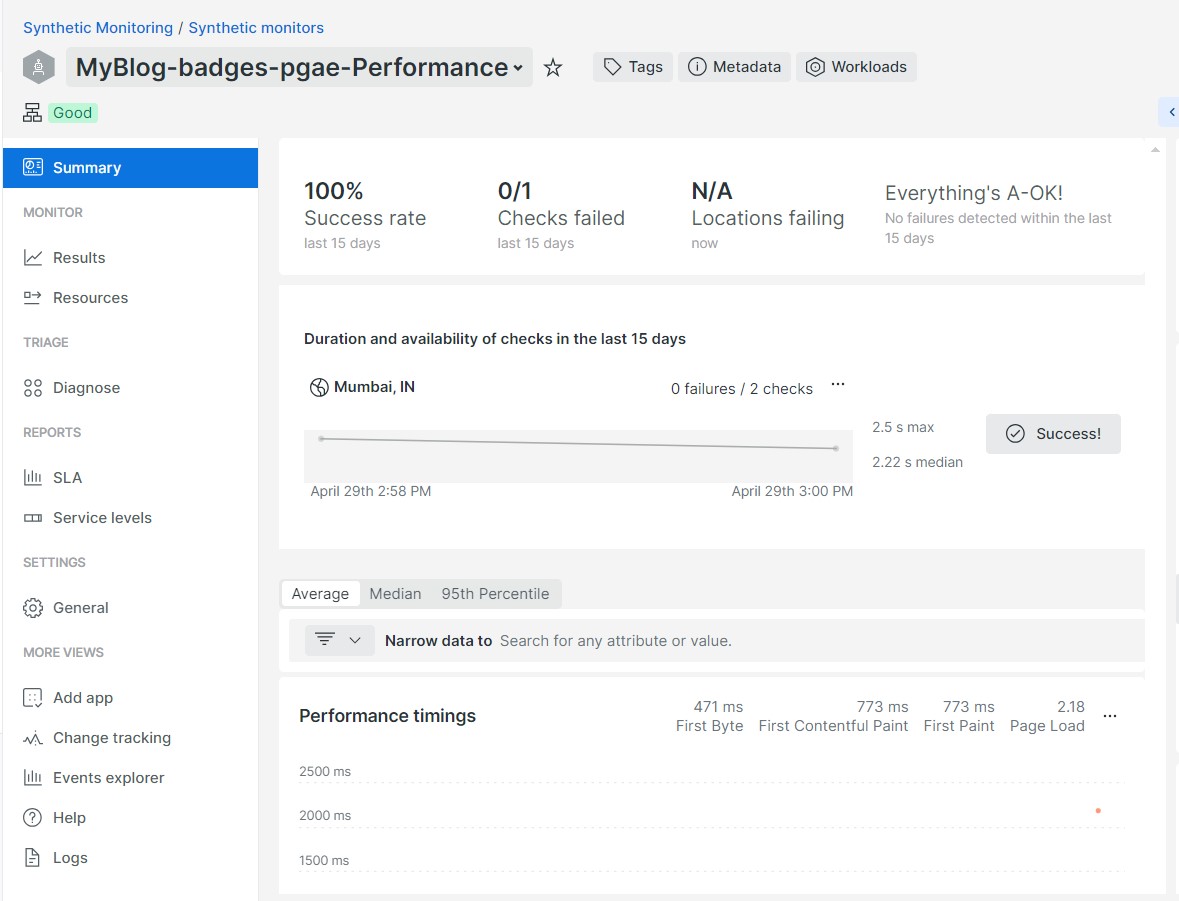
Step 2: Check Result and summary : check Page Load Performance Test Results
At the top of the dashboard, you’ll find a summary of the monitoring. It will display the statistics, failed tests, and success rates.
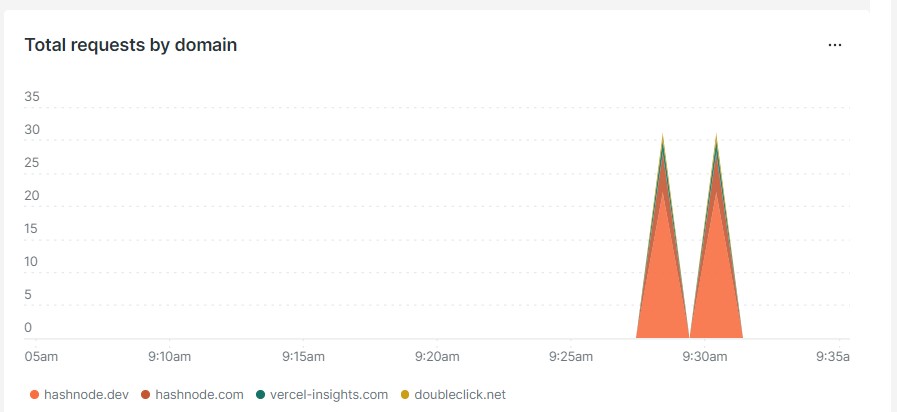
The complete set of results is presented at the bottom in 5 graphs, one for each: Performance timing, Domain requests, Duration, Average size resource types, and Error response codes.
Domain requests graph :
Performance graph:
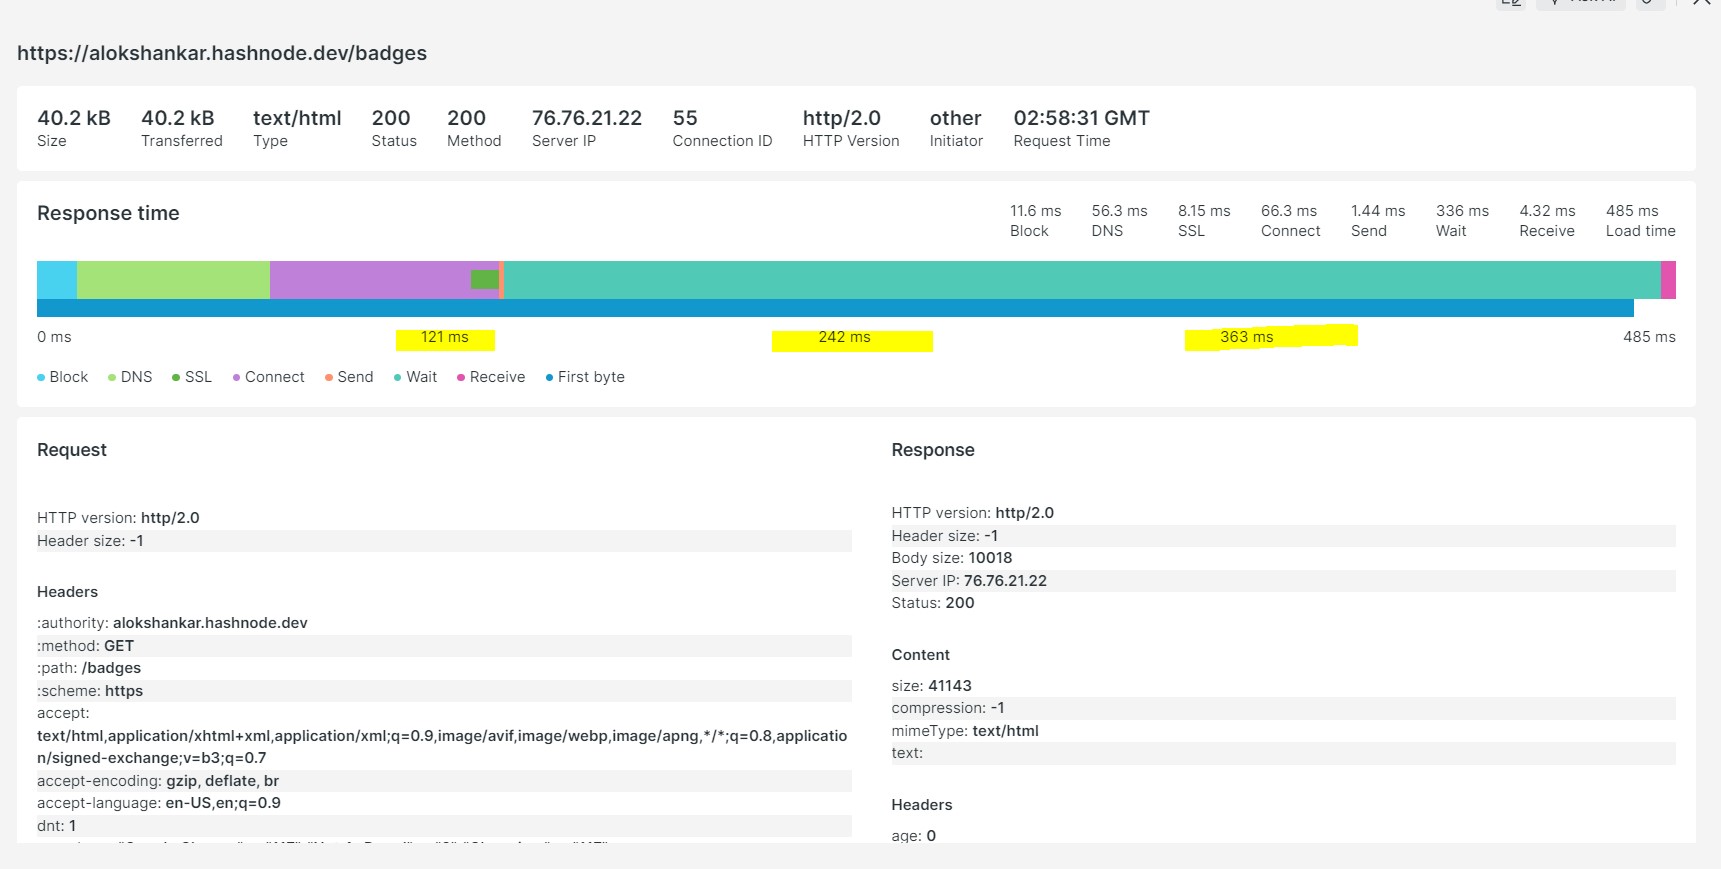
Average load time :
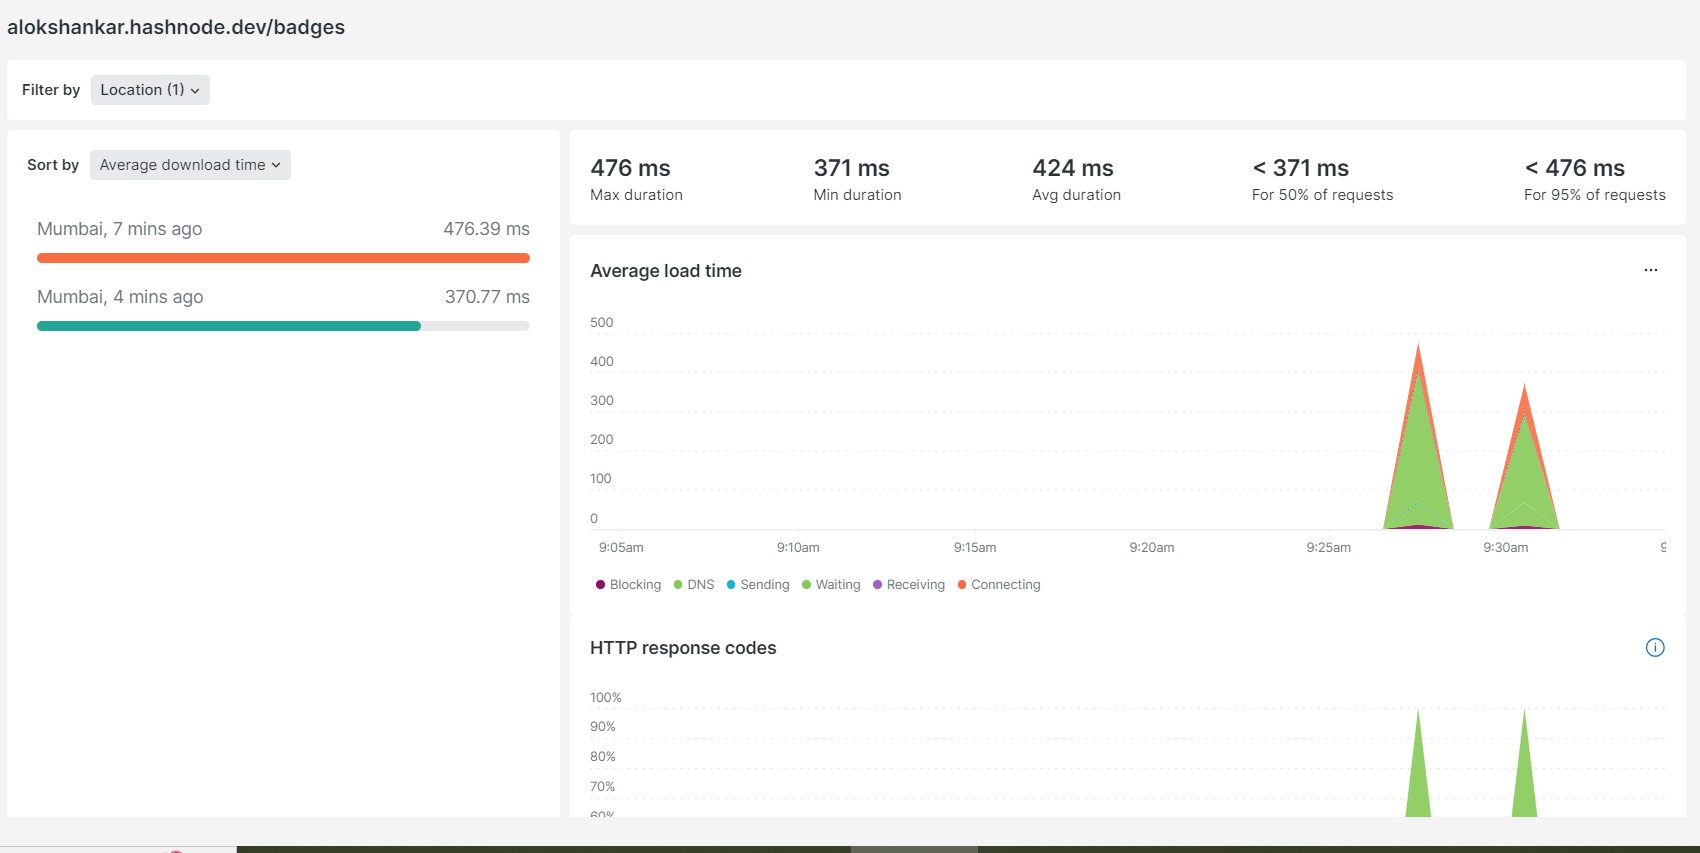
You can see every component detail, including size, transferred size, status, server IP, connection ID used, HTTP version, request time, and more!
Using the Page Load Performance monitor, you can identify and resolve any issues that are slowing down your website.
Security in New Relic Synthetic Monitoring :
New Relic Synthetic Monitoring is very safe and made to keep your apps and data safe from possible dangers. It uses strong encryption, private monitoring, and secure storage to guard your important info.
key features of new relic synthetic monitor:
Secure by Design: New Relic’s synthetic monitoring protects your data in transit and at rest, offering comprehensive protection for your synthetic monitor data.
Private Locations: The platform allows you to set up private locations. Besides, it allows you to monitor internal sites securely on your network.
Data Privacy: Committed to safeguarding your data, New Relic securely stores Synthetic Monitoring data for 13 months. Also, HTTPS encrypts all data transmissions.
Secure Credentials: New Relic provides a Secure Keystore for storing sensitive information, ensuring the safety of your credentials during synthetic monitoring activities.
Scripted Browsers and Security: Scripted browsers have natural security risks. New Relic has also implemented measures to reduce these risks to provide a safer monitoring environment.
Setup New Relic alerts : A New Relic Alert is a notification that the New Relic monitoring platform sends when it detects something important happening with your application or system. These alerts can be customized to notify you about specific events, such as performance issues, errors, or other conditions that you want to monitor.

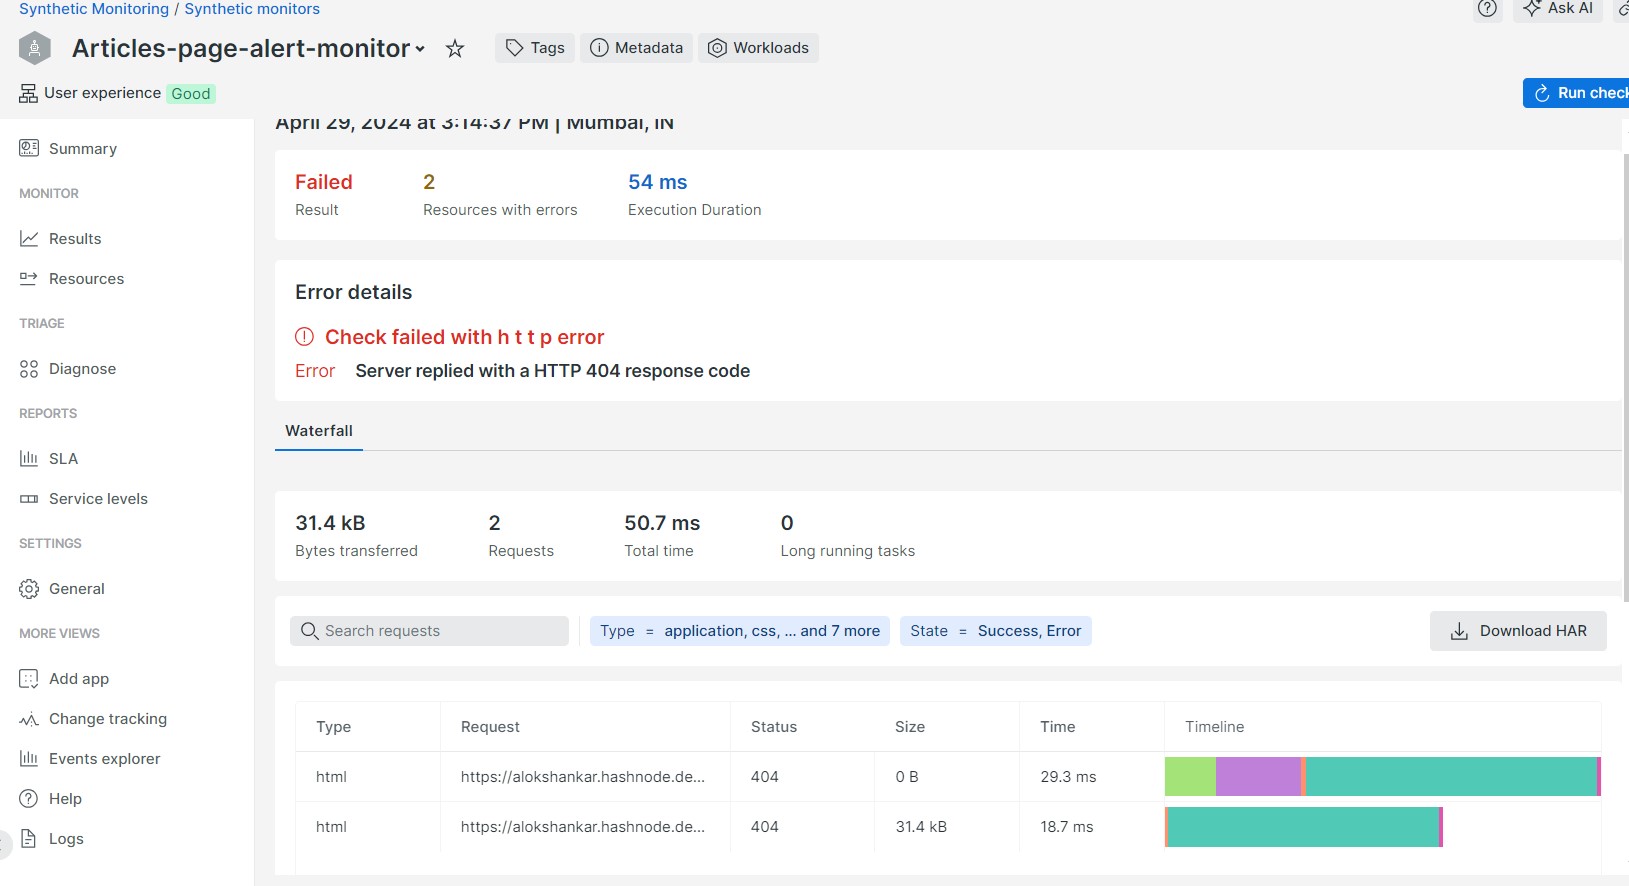
For my scenario I made following page https://alokshankar.hashnode.dev/articles to throw 404 error and try to setup newrelic alert.

Lets try to setup synthetic monitor(Ping) and create alert logic for this page
Synthetic monitor :

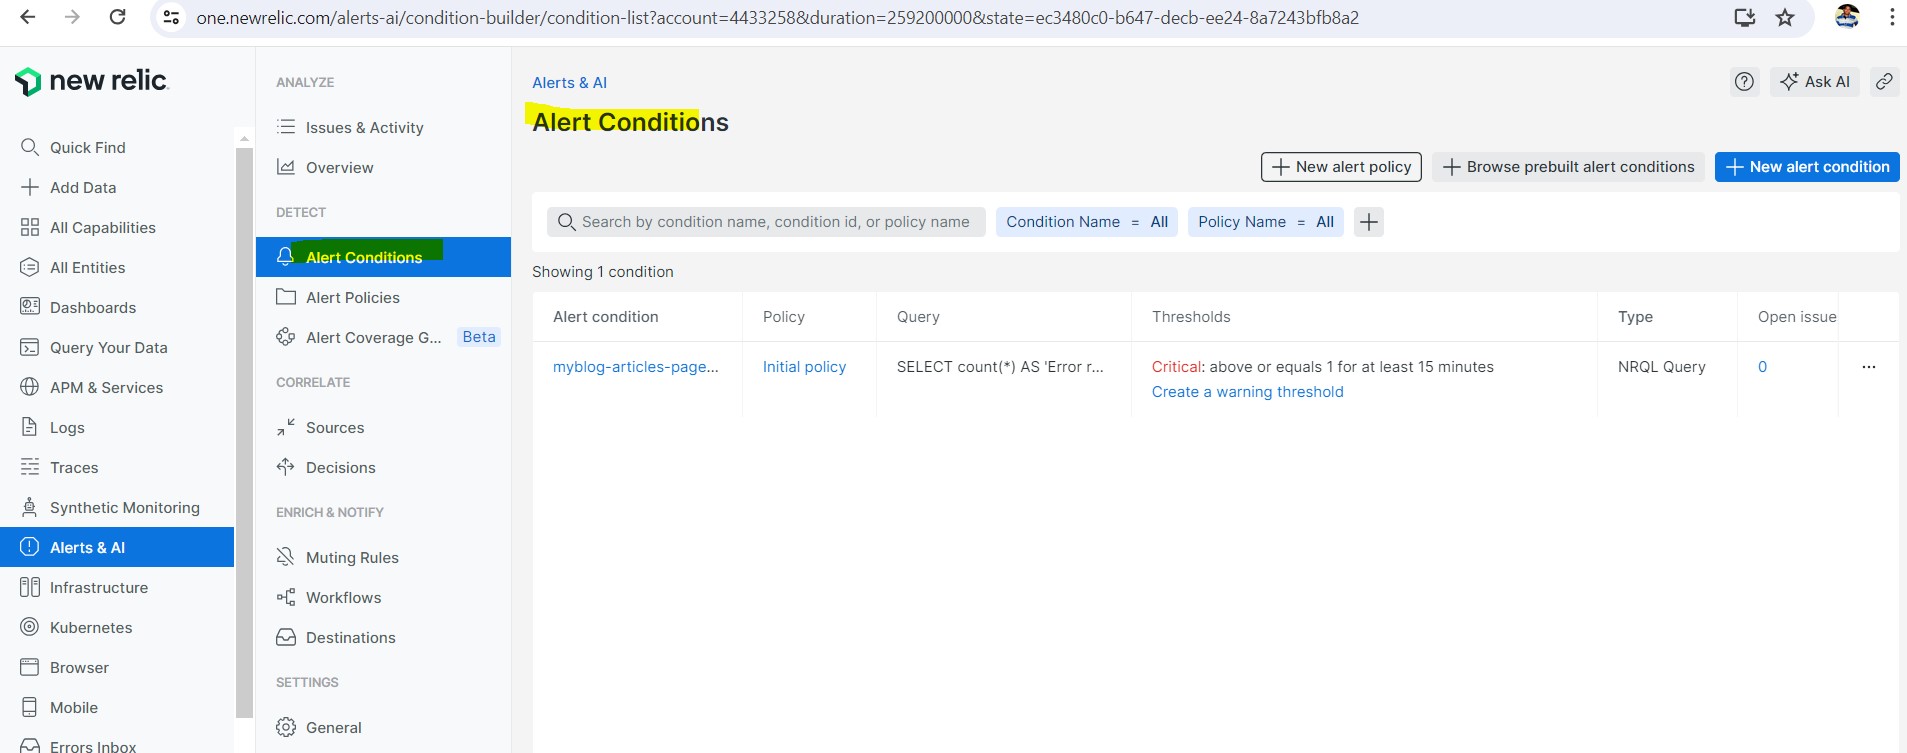
Create Alert condition :
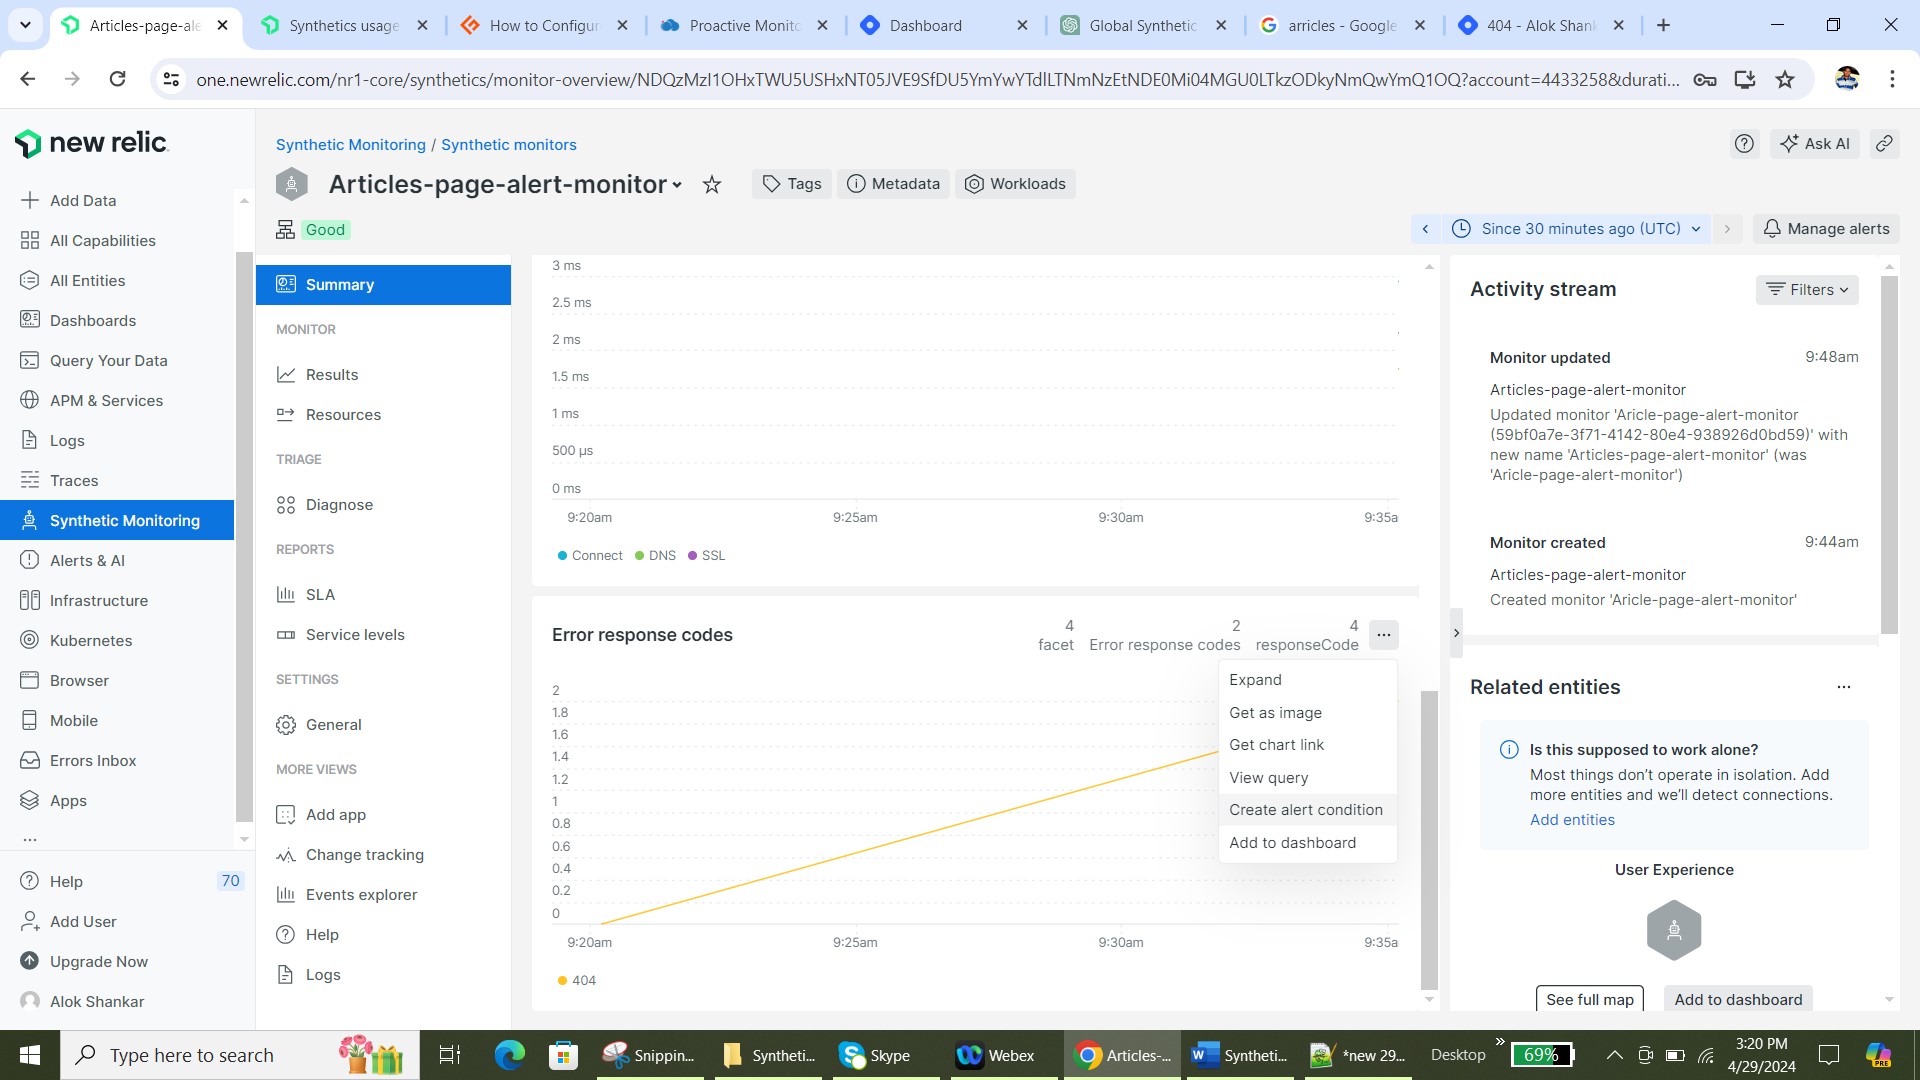
Go to any dashboard. Then, find a chart you want to use, click the "..." menu, and select Create alert condition.
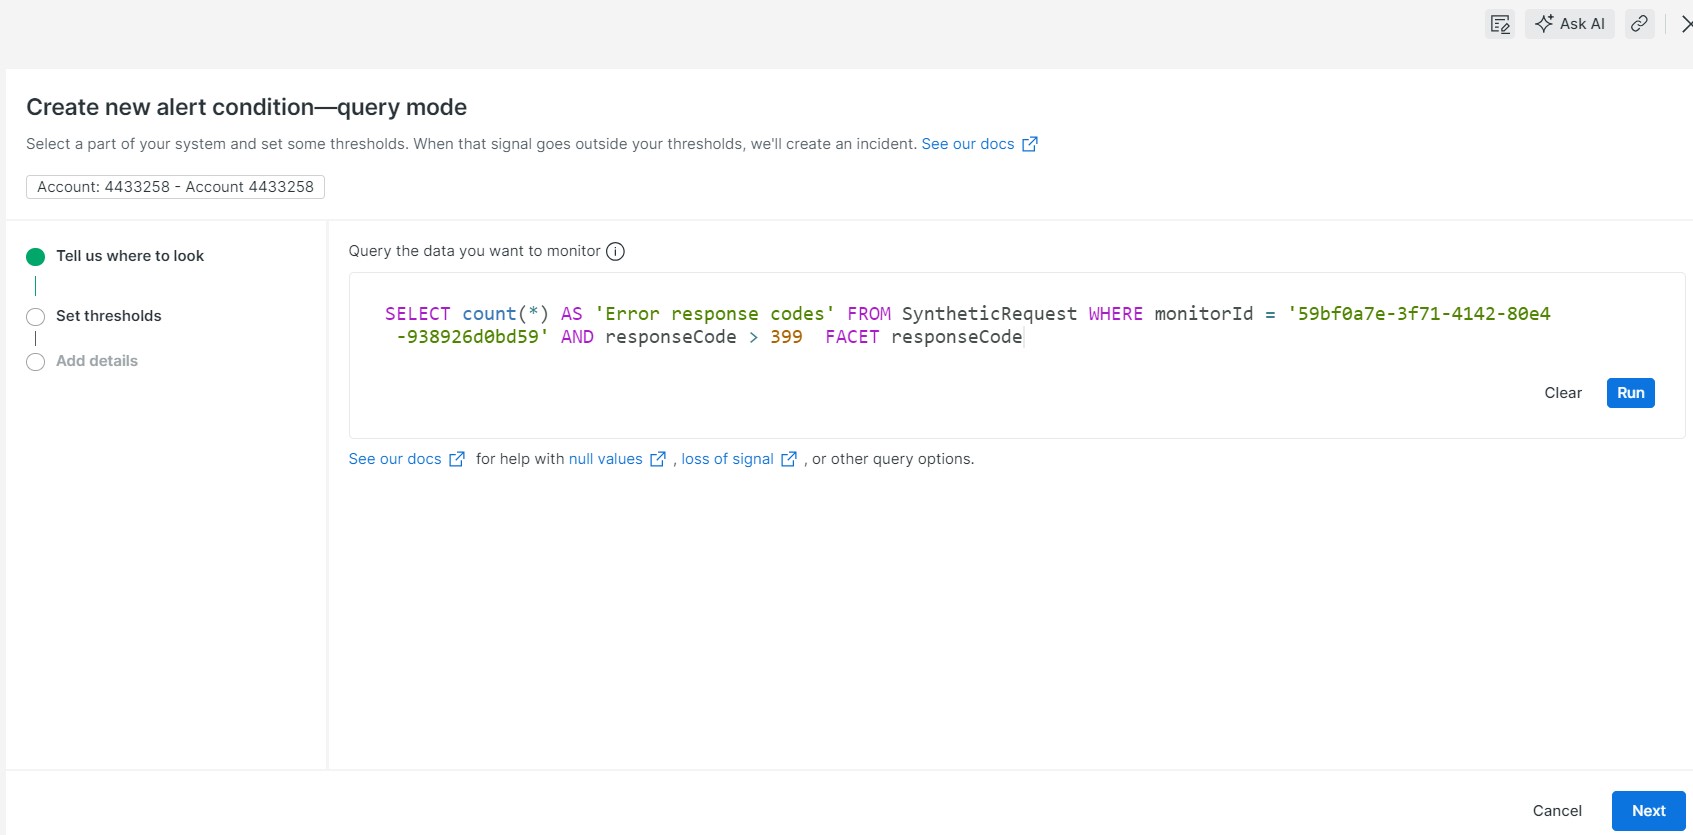
Select the signal, or stream of data, you want to use to create the alert condition. To keep things simple, Build a query is the default option for conditions created this way.
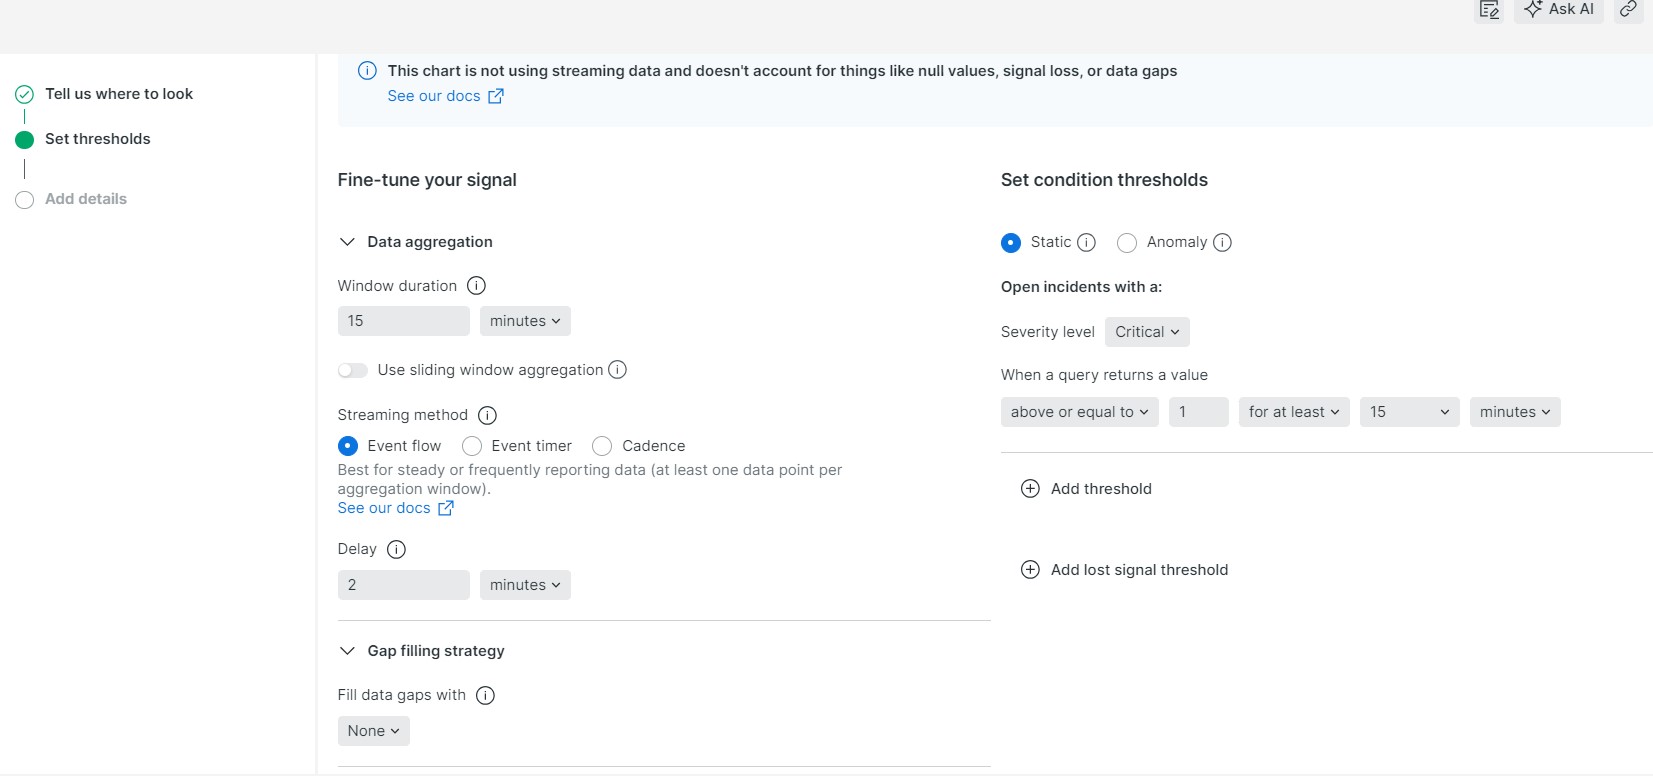
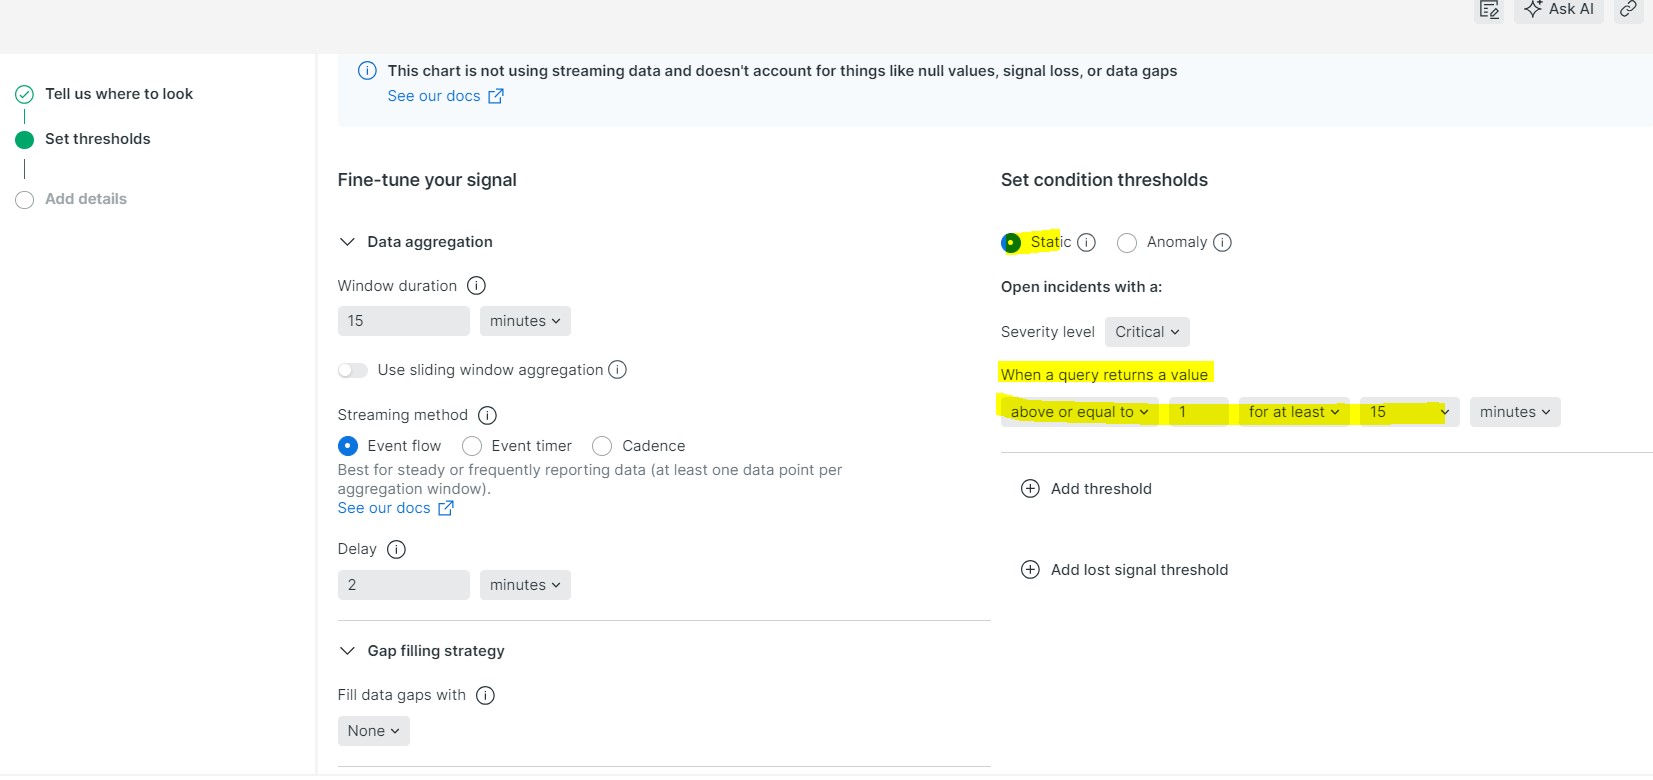
Set the static thresholds and adjust the signal behavior
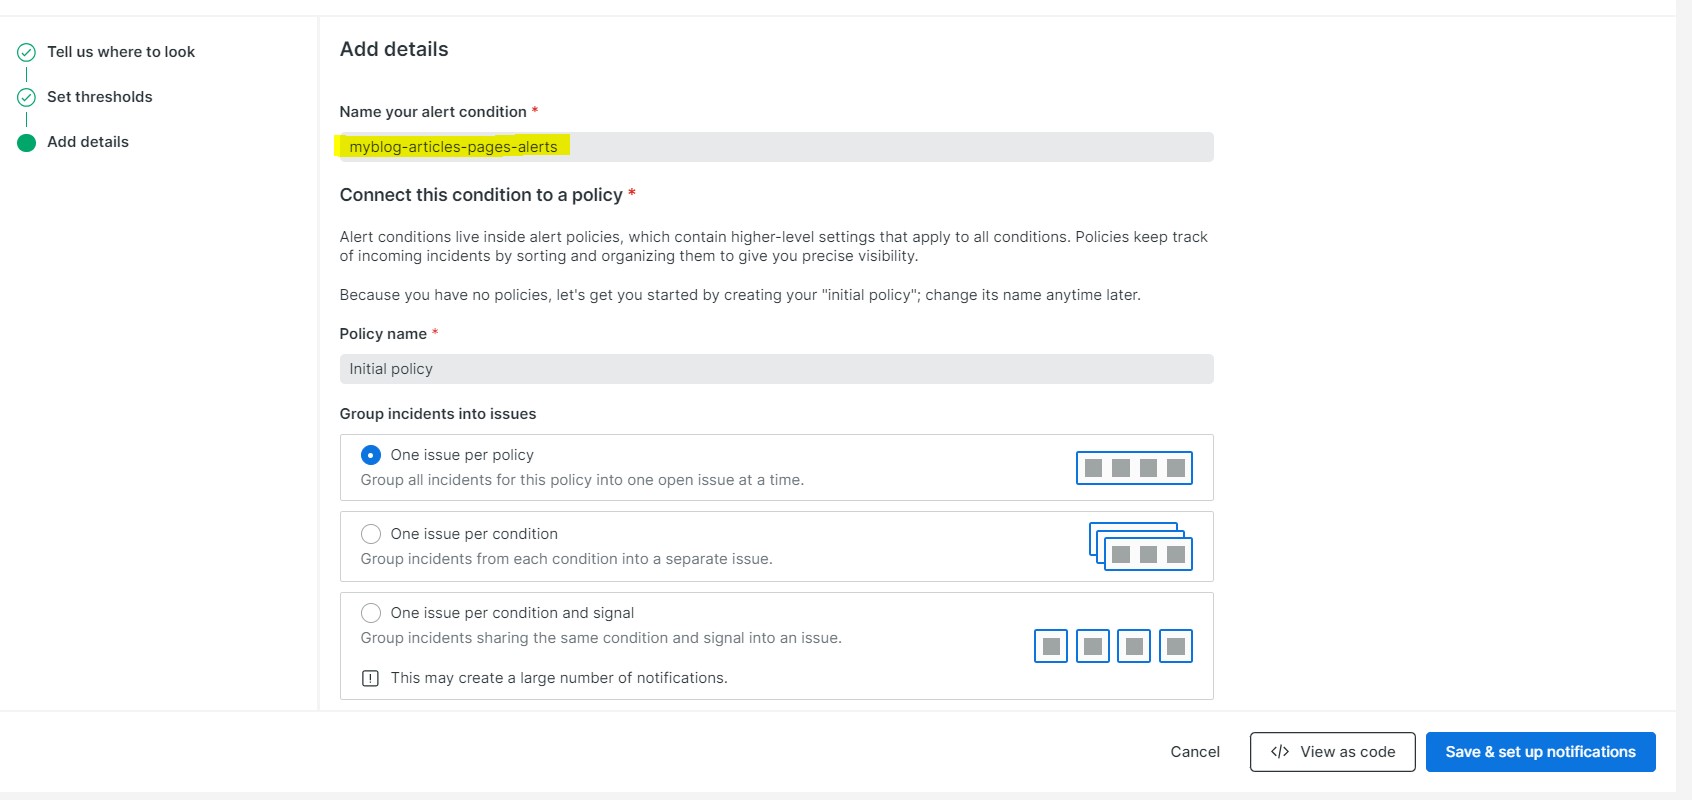
Alert policy
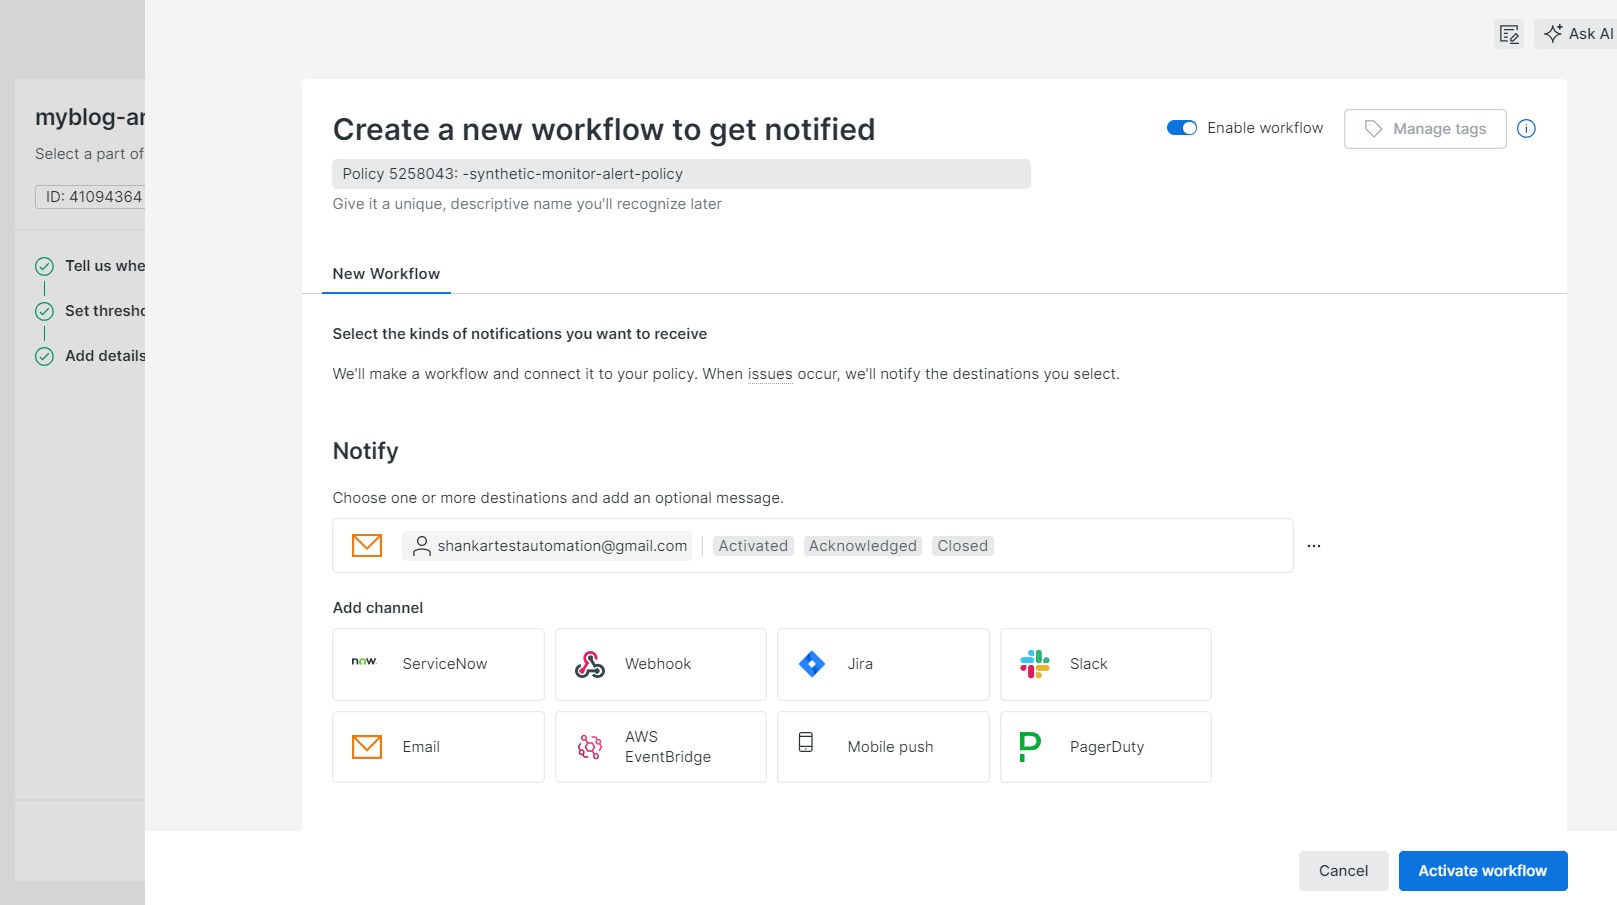
Create workflow to get notified :
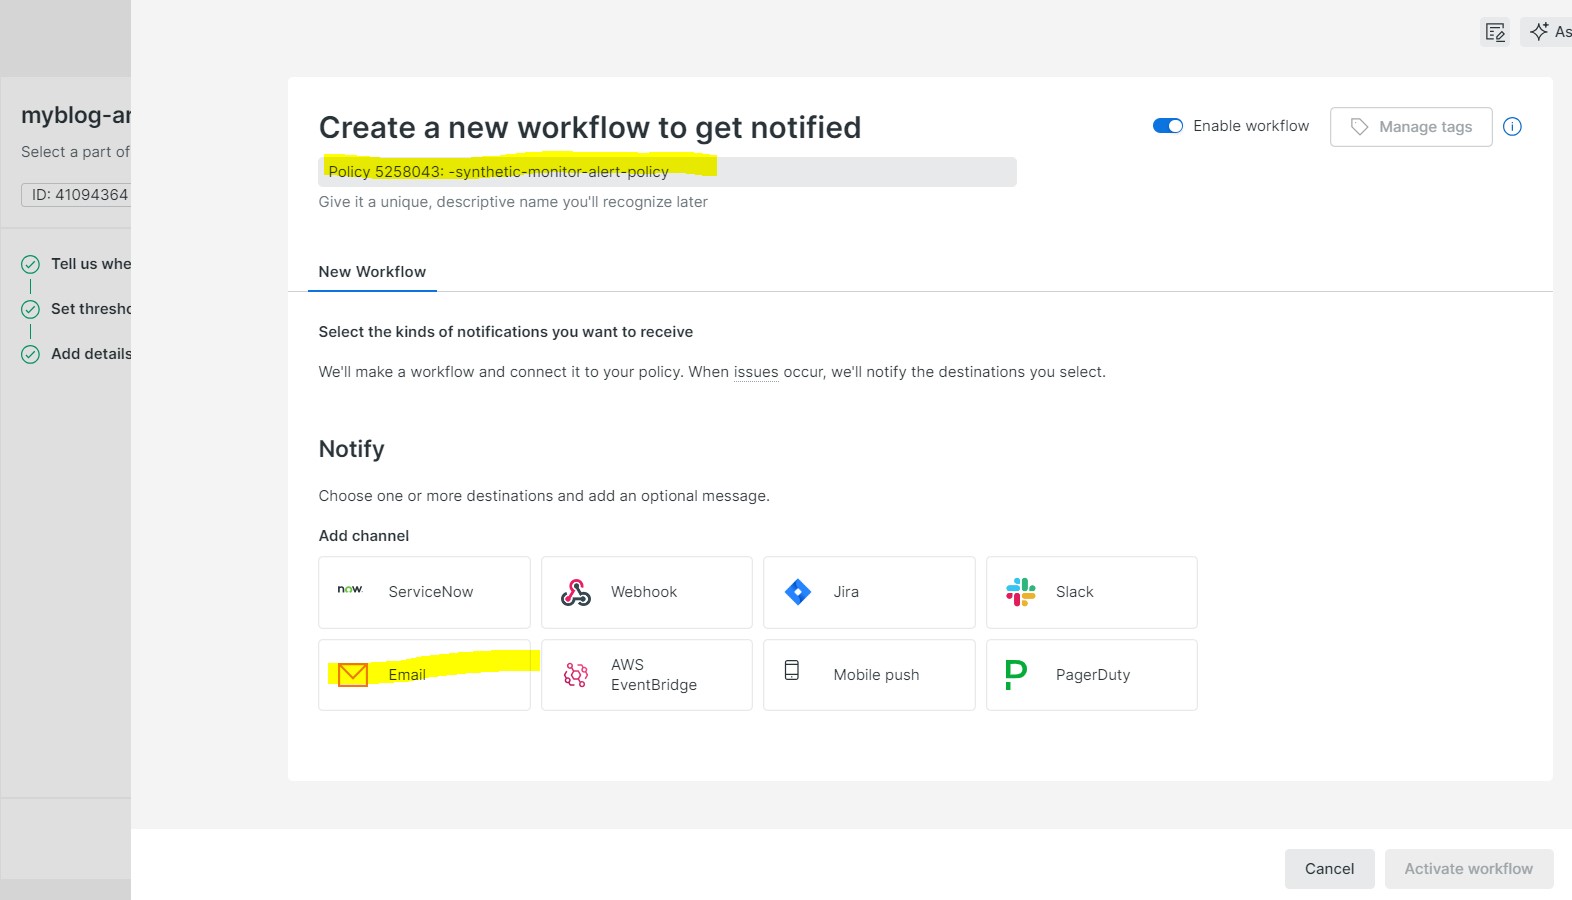
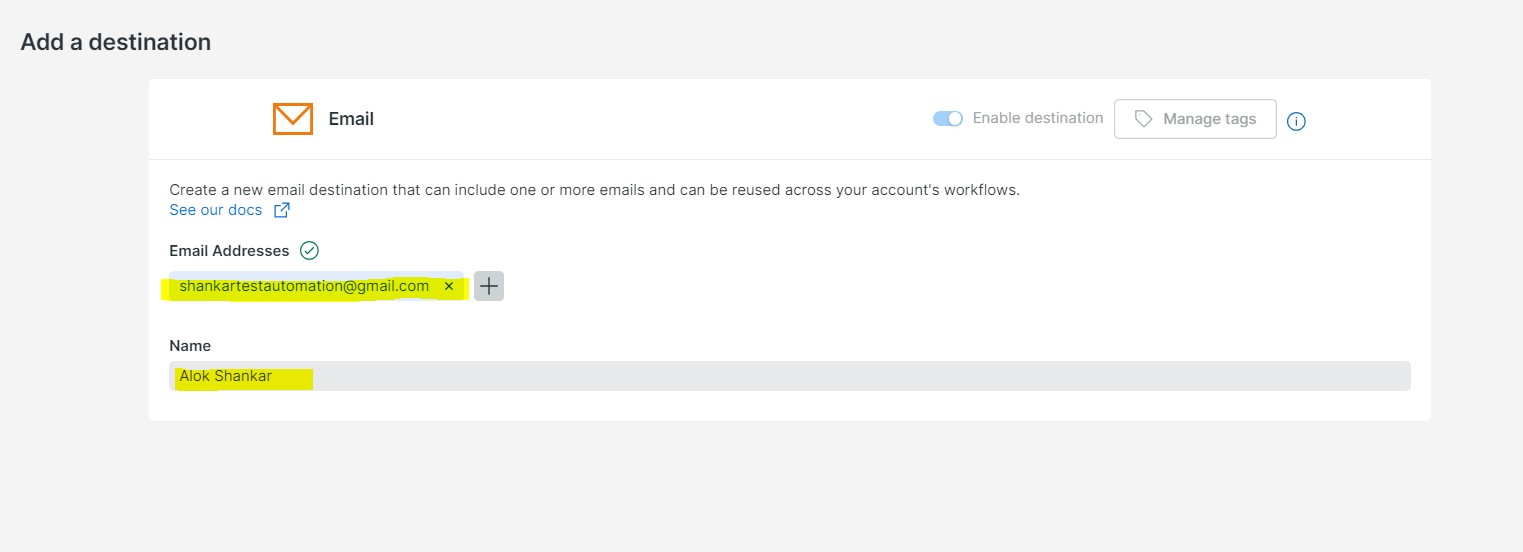
Create destination :
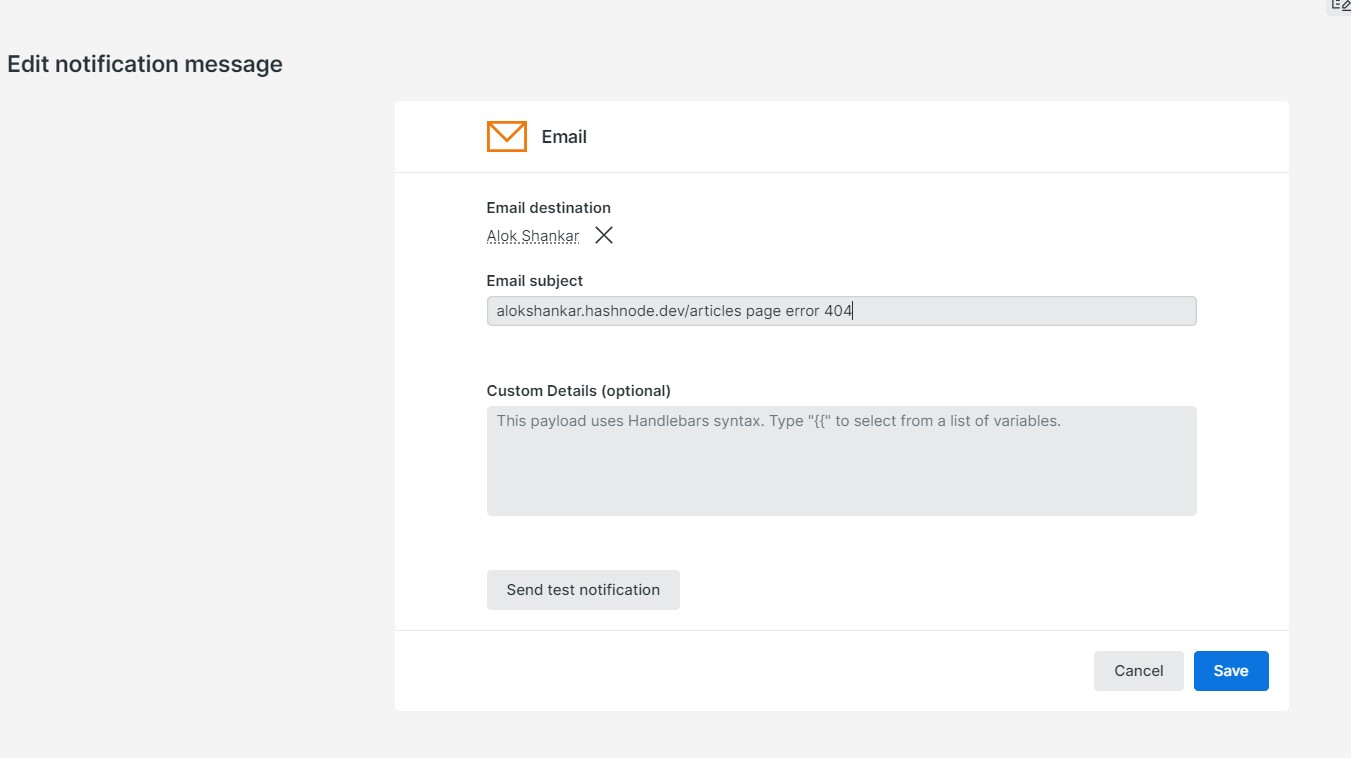
Add Subject :
Now activate workflow :
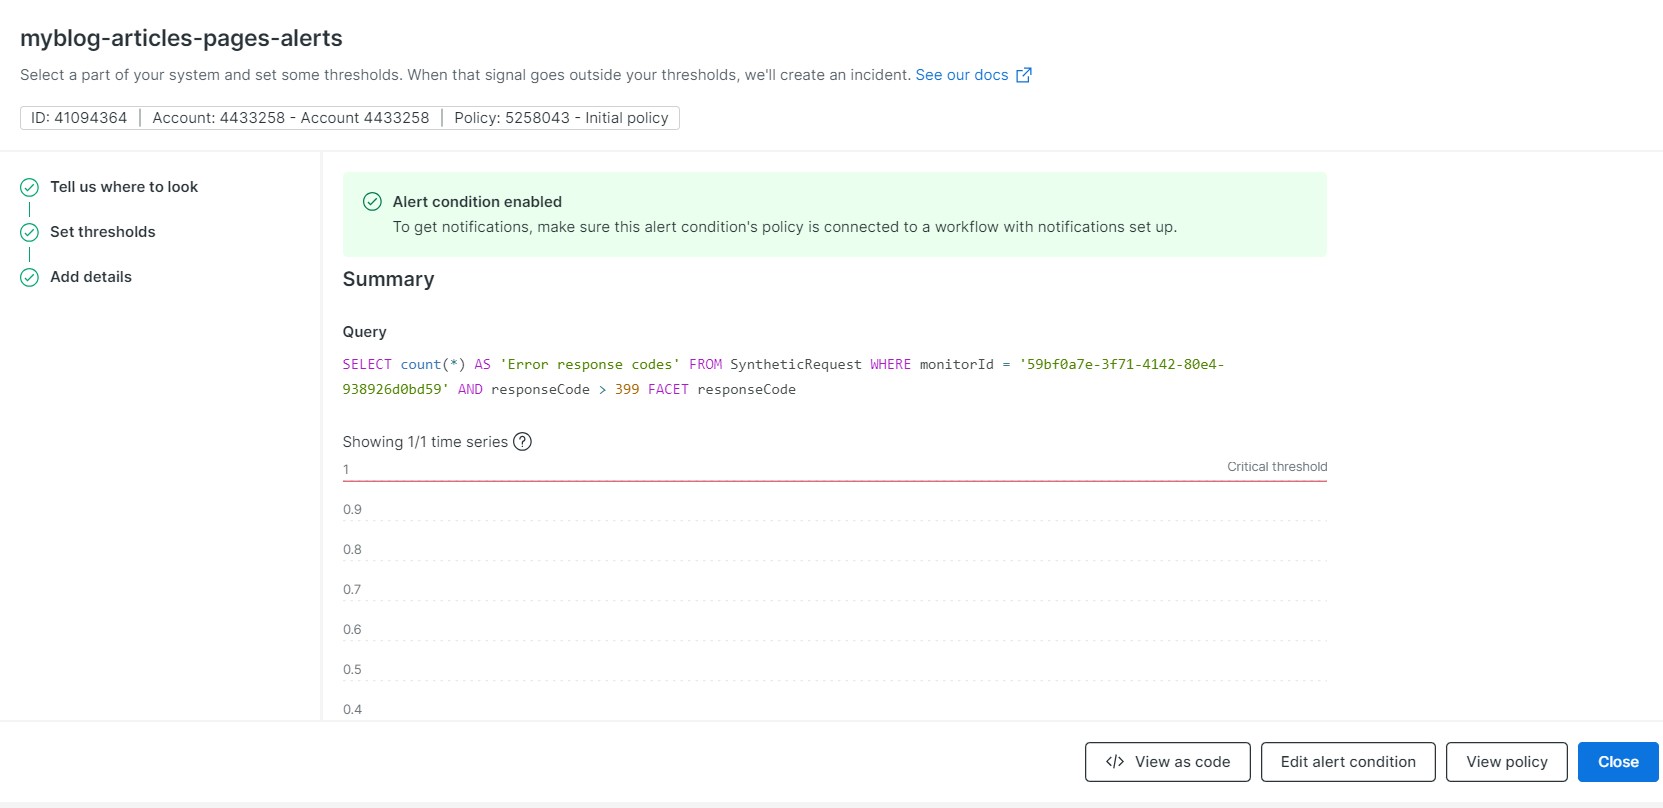
Then save and close :
Now you can navigate to Alert & AI issue and activity :
Email alert received :

Conclusion :
New Relic Synthetic Monitoring offers a comprehensive solution for businesses to ensure the optimal performance and security of their applications and websites. By simulating user interactions, monitoring availability, and providing detailed insights, it enables organizations to proactively identify and address potential issues before they impact users. With its emphasis on security and customizable alerts, New Relic Synthetic Monitoring empowers businesses to maintain a reliable and efficient digital presence, ultimately enhancing customer satisfaction and driving success in today's competitive landscape.
Subscribe to my newsletter
Read articles from Alok Shankar directly inside your inbox. Subscribe to the newsletter, and don't miss out.
Written by

Alok Shankar
Alok Shankar
Dedicated and highly skilled AWS DevOps and Linux professional with over 10+ years of experience in designing, implementing, and maintaining cloud infrastructure and CICD pipelines. Proficient in optimizing processes, automating workflows, and ensuring the reliability and scalability of cloud-based systems. Demonstrated expertise in Kubernetes and containerization technologies. Proven ability to understand and execute the complete deployment lifecycle. Proven expertise in real-time troubleshooting and leading cross functional teams to success.