Visual Regression Testing with AWS CloudWatch Canaries
 Tobias Schmidt
In today’s digital era, ensuring your website is consistently up and performing well is not just an option—it's essential.
For those using AWS, CloudWatch Synthetic Canaries offer a smart way to monitor any site or API. This helps in troubleshooting and maintaining the health of your site.
In this article, we'll explore how to deploy an application using SST Ion and monitor it using AWS Synthetic Canaries.
As always, this article comes with a repository that is ready to be deployed into your own AWS account so you can explore and learn.
The Application Setup
The application is pretty straightforward. It's a simple web app built with Astro.

We’re using SST Ion, a flexible infrastructure as code (IaC) framework that's perfect for deploying modern web application frameworks.
SST Ion simplifies deploying cloud applications, allowing developers to focus more on code and less on infrastructure management.
SST vs. SST Ion: The new engine of SST is Ion. It's build on top of Pulumi and Terraform. This makes it easy for us to extend the functionality and build own "stacks". You can read more here.
For our example app, which showcases how Canaries work at AWS, you can check out our GitHub repository.
Here’s a quick overview of how to deploy this site using SST:
Clone the Repository: Start by cloning the repository to your local machine.
 git clone https://github.com/awsfundamentals-hq/cloudwatch-synthetics-visual-regression-tests
 cd cloudwatch-synthetics-visual-regression-tests
Install Dependencies: Ensure SST Ion is installed and install all the dependencies for the app itself.
 curl -fsSL https://ion.sst.dev/install | bash
 npm install

 # alternatively, you can also use a package manager like homebrew
 brew install sst/tap/sst
 brew upgrade sst
Deploy the Application: Use SST to deploy your application to AWS.
 sst deploy

 # Note: Keep in mind, to connect to the right AWS CLI Profile
The deployment process will do all the necessary steps to build and deploy the application to AWS by using S3 and CloudFront. Besides that, our script will deploy and start the monitoring of canaries in your AWS account.
After deploying, SST will provide a URL where your site is hosted. This site serves as a perfect candidate for our monitoring tutorial using AWS Synthetic Canaries.
Monitoring with AWS Synthetic Canaries
Now, let’s talk about monitoring. AWS Synthetic Canaries are not just for checking APIs but are incredibly effective for monitoring websites.
This is because canaries can collect screenshots and compare them with each other.
The script is very simple:
const synthetics = require('Synthetics');
const log = require('SyntheticsLogger');
const config = synthetics.getConfiguration();

const title = 'visual-regression-check';

config.disableStepScreenshots();
config.withVisualCompareWithBaseRun(true);
config.withVisualVarianceThresholdPercentage(0);

const takeScreenshot = async () => {
  await synthetics.executeStep(title, async () => {
    let page = await synthetics.getPage();
    await page.goto(process.env.SITE_URL, { waitUntil: 'networkidle0' });
    await new Promise((r) => setTimeout(r, 2500));
    let pageTitle = await page.title();
    log.info('Page title: ' + pageTitle);
    await synthetics.takeScreenshot(title, 'loaded');
  });
};

exports.handler = async () => {
  await takeScreenshot();
};
The only thing the script needs to do is:
Enable the visual comparison mode by setting the necessary configuration flags. (
visualCompareWithBaseRunandvisualVarianceThresholdPercentage).Go to the site passed via the environment variable
SITE_URL.Wait for it to fully load (
waitUntil: networkidle0).Take a screenshot.
If you jump to the CloudWatch console, you'll find our new canary in the section Application Signals > Synthetic Canaries.
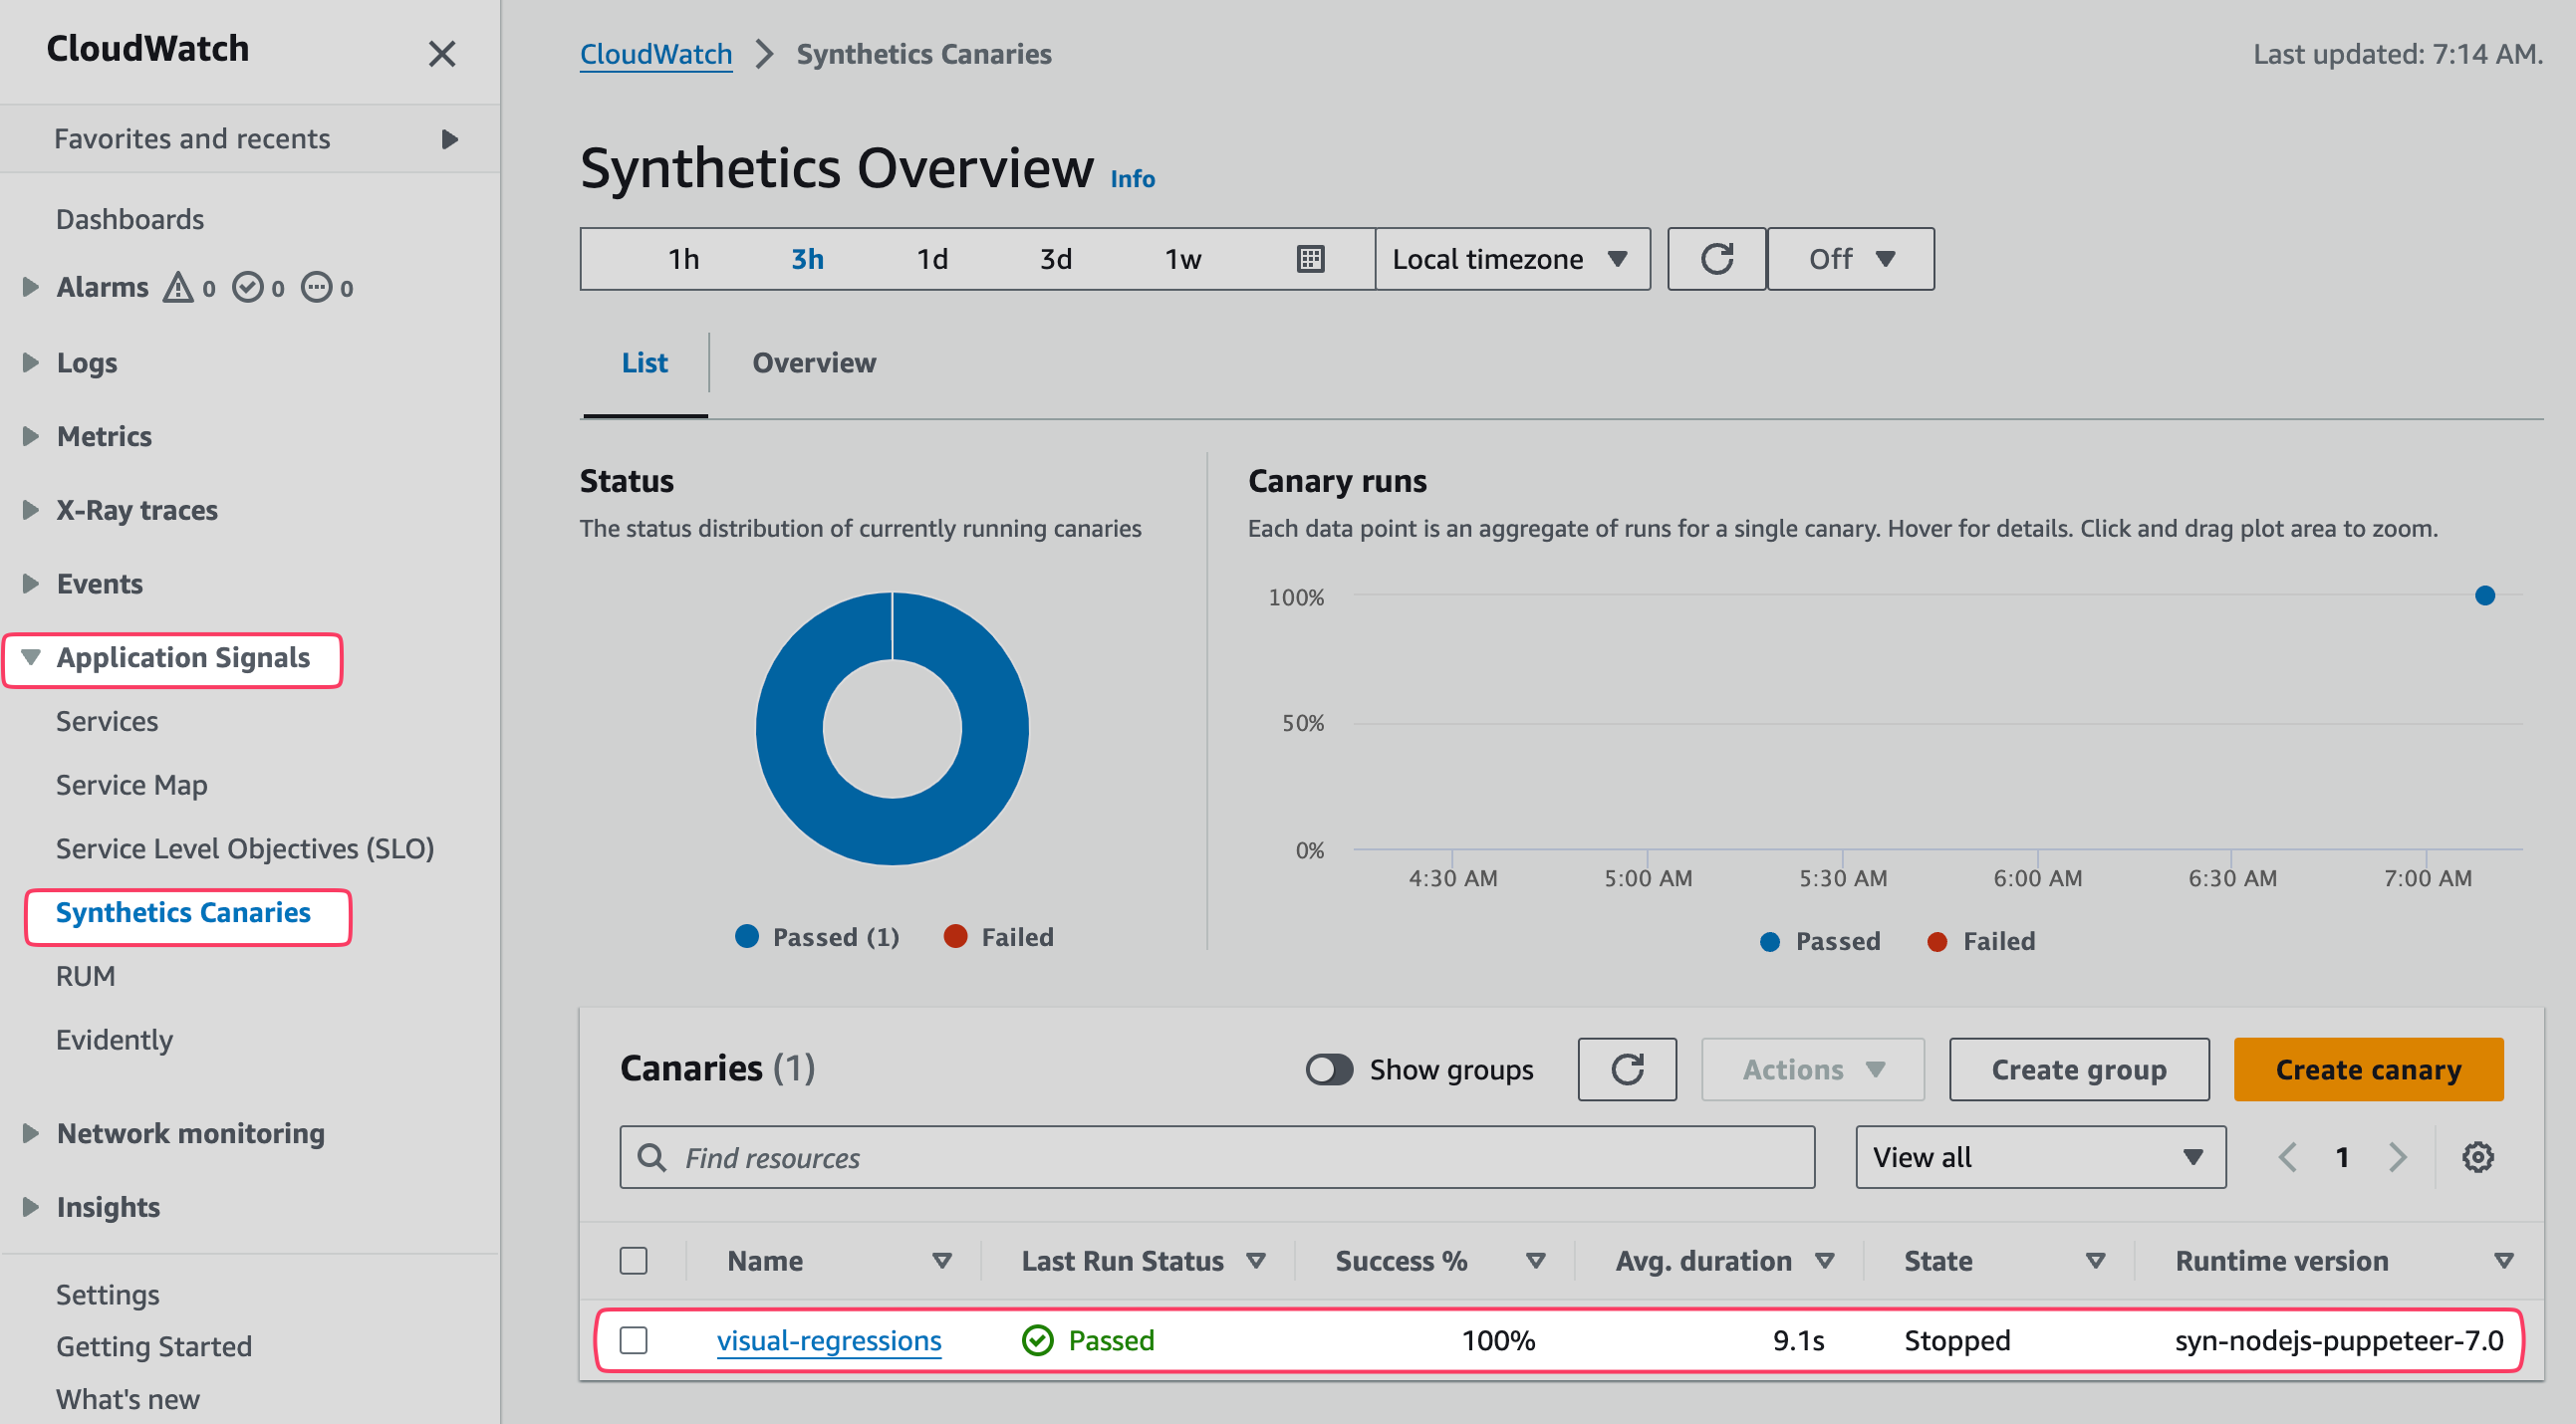
The first run will collect a baseline and store it in S3. Further runs will then compare this initial screenshot to the current one.
By default, after deploying with SST, the canaries will start to run. The first run will be triggered immediately, but you can always start or stop the canary in the console via the Actions dropdown.

If a run has been completed, we'll see this in the Availability tab.
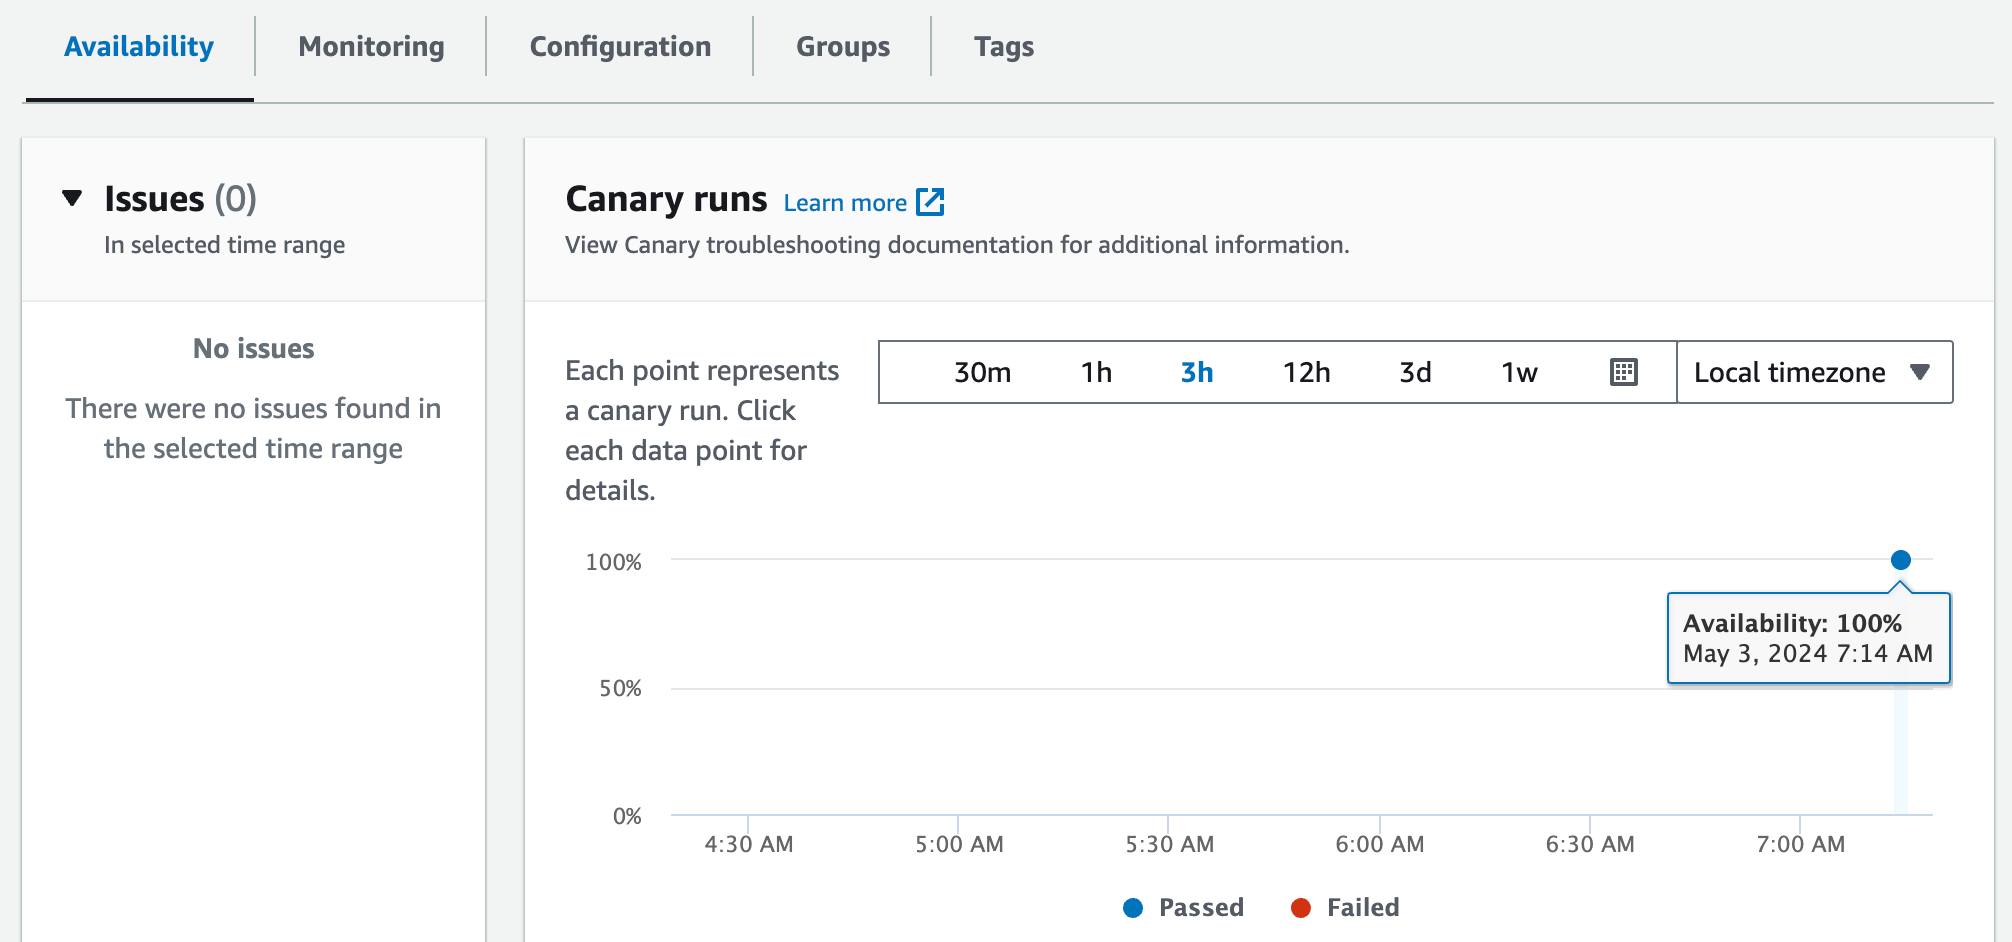
There we'll also find the Screenshots tab. This will show us the screenshots (in our case just one) that the canary has collected.
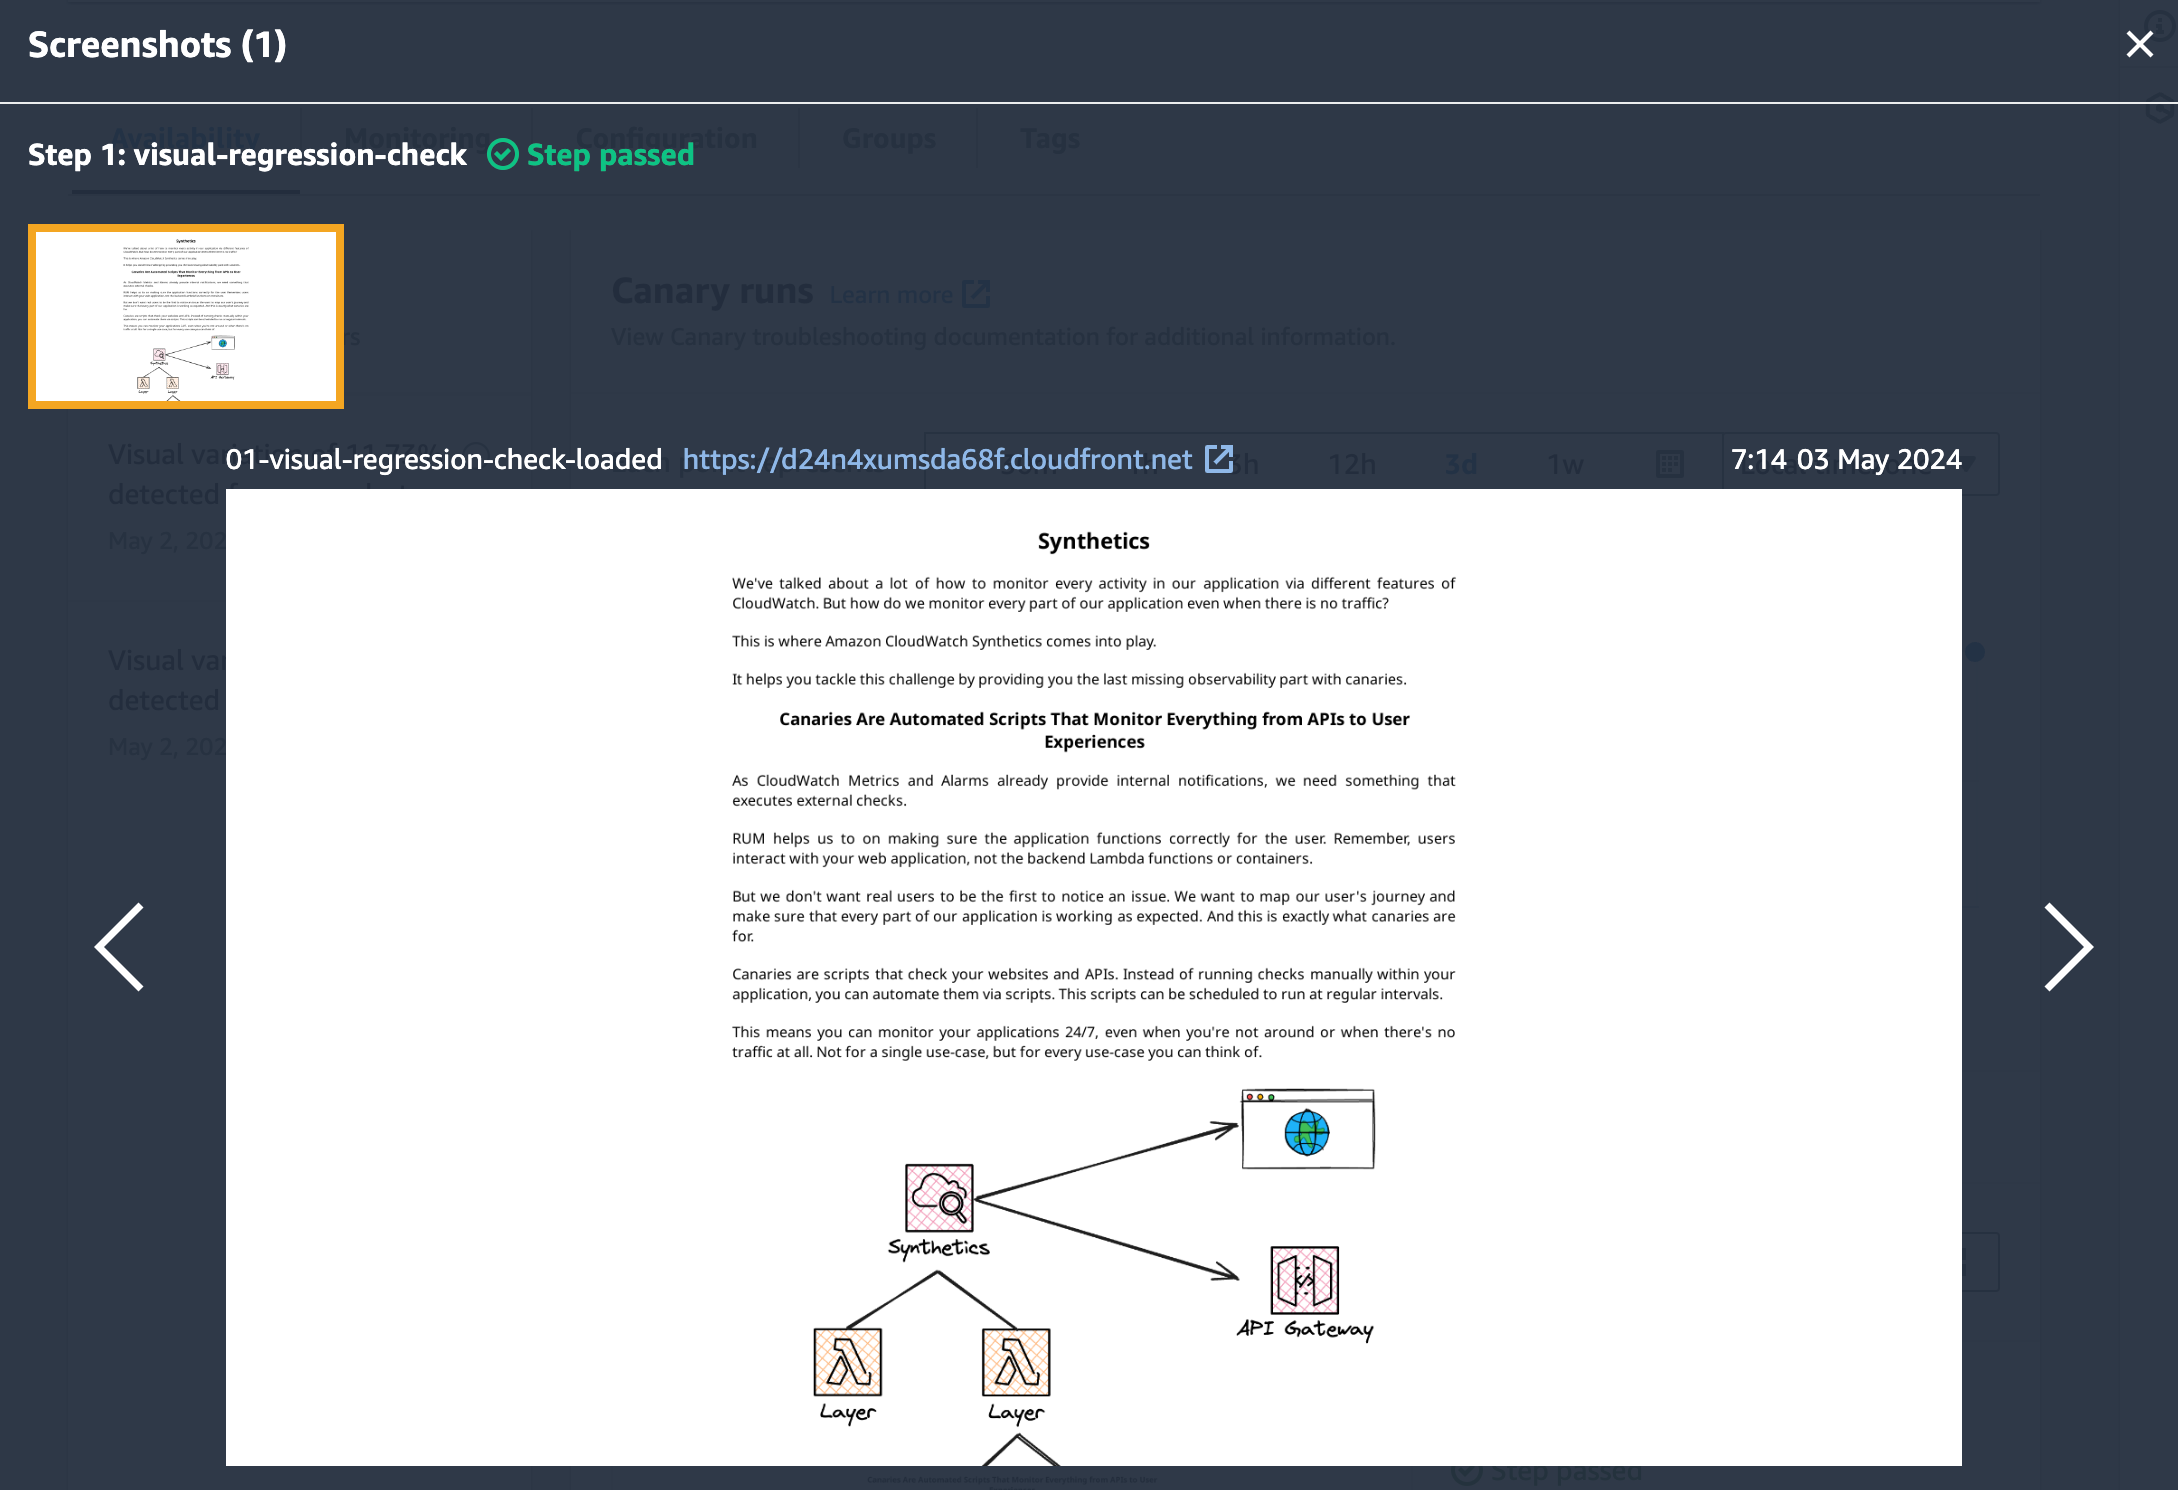
If this was the first run, this first screenshot will be set as the baseline. Each of our further runs will be compared with this screenshot to detect any (unwanted) changes.
Let's test exactly that by changing our frontends content. We can do this for example by changing our content's max-width to a much smaller value:
main {
  /* 200px instead of 800px */
  max-width: 200px;
  margin: auto;
  padding: 20px;
}
With this, we'll trigger the comparison to fail. So let's deploy our changes with sst deploy to AWS and wait for our next run.
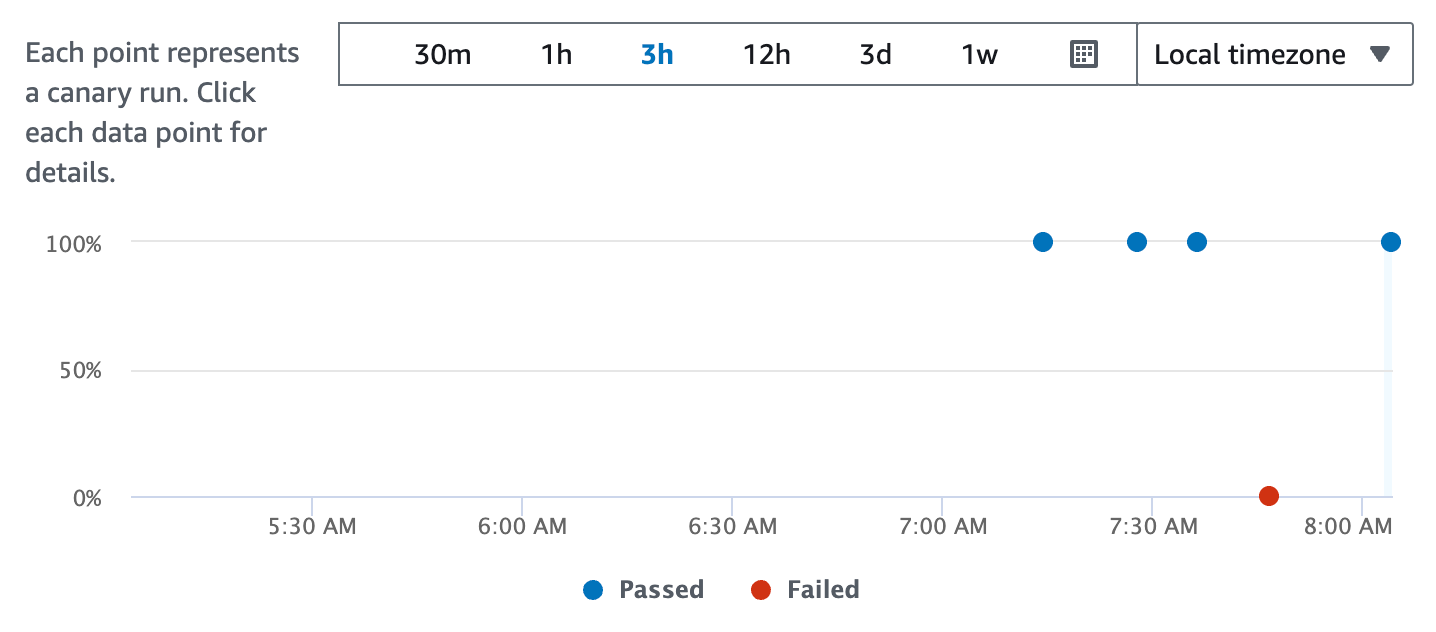
After the run has finished, we should see the failure.
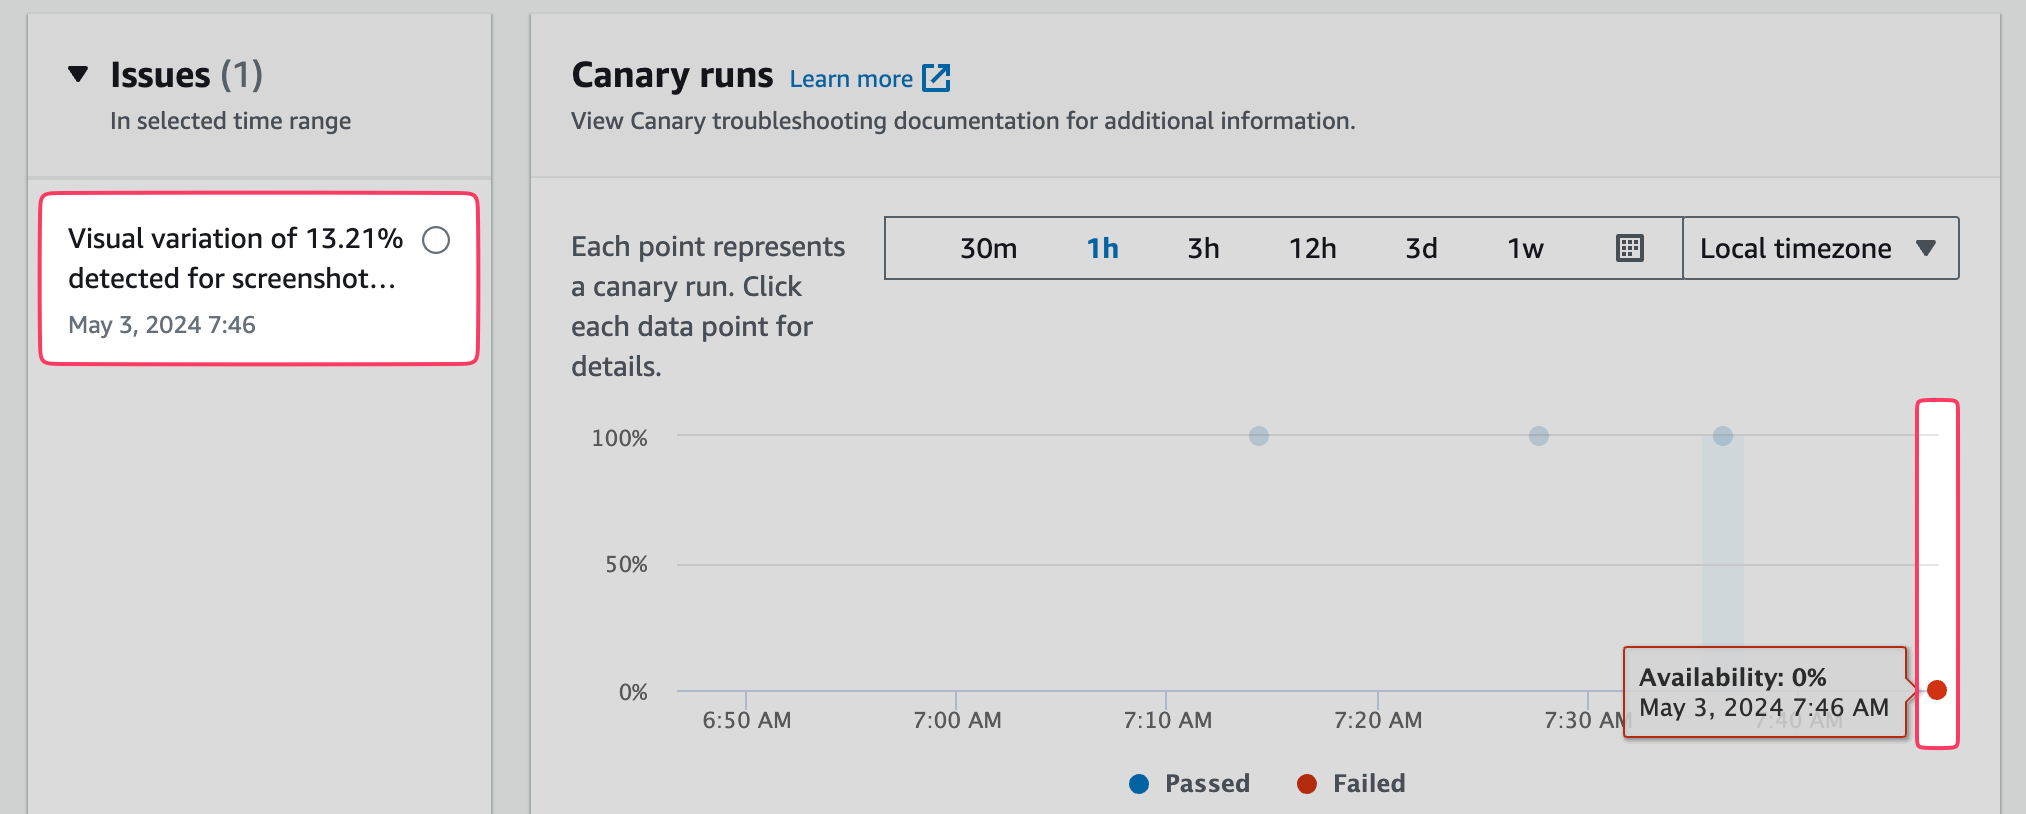
CloudWatch has detected the change. Another look into the screenshots tab shows us the expected result. CloudWatch also provides us with another screenshot, showing the actual differences highlighted in yellow:
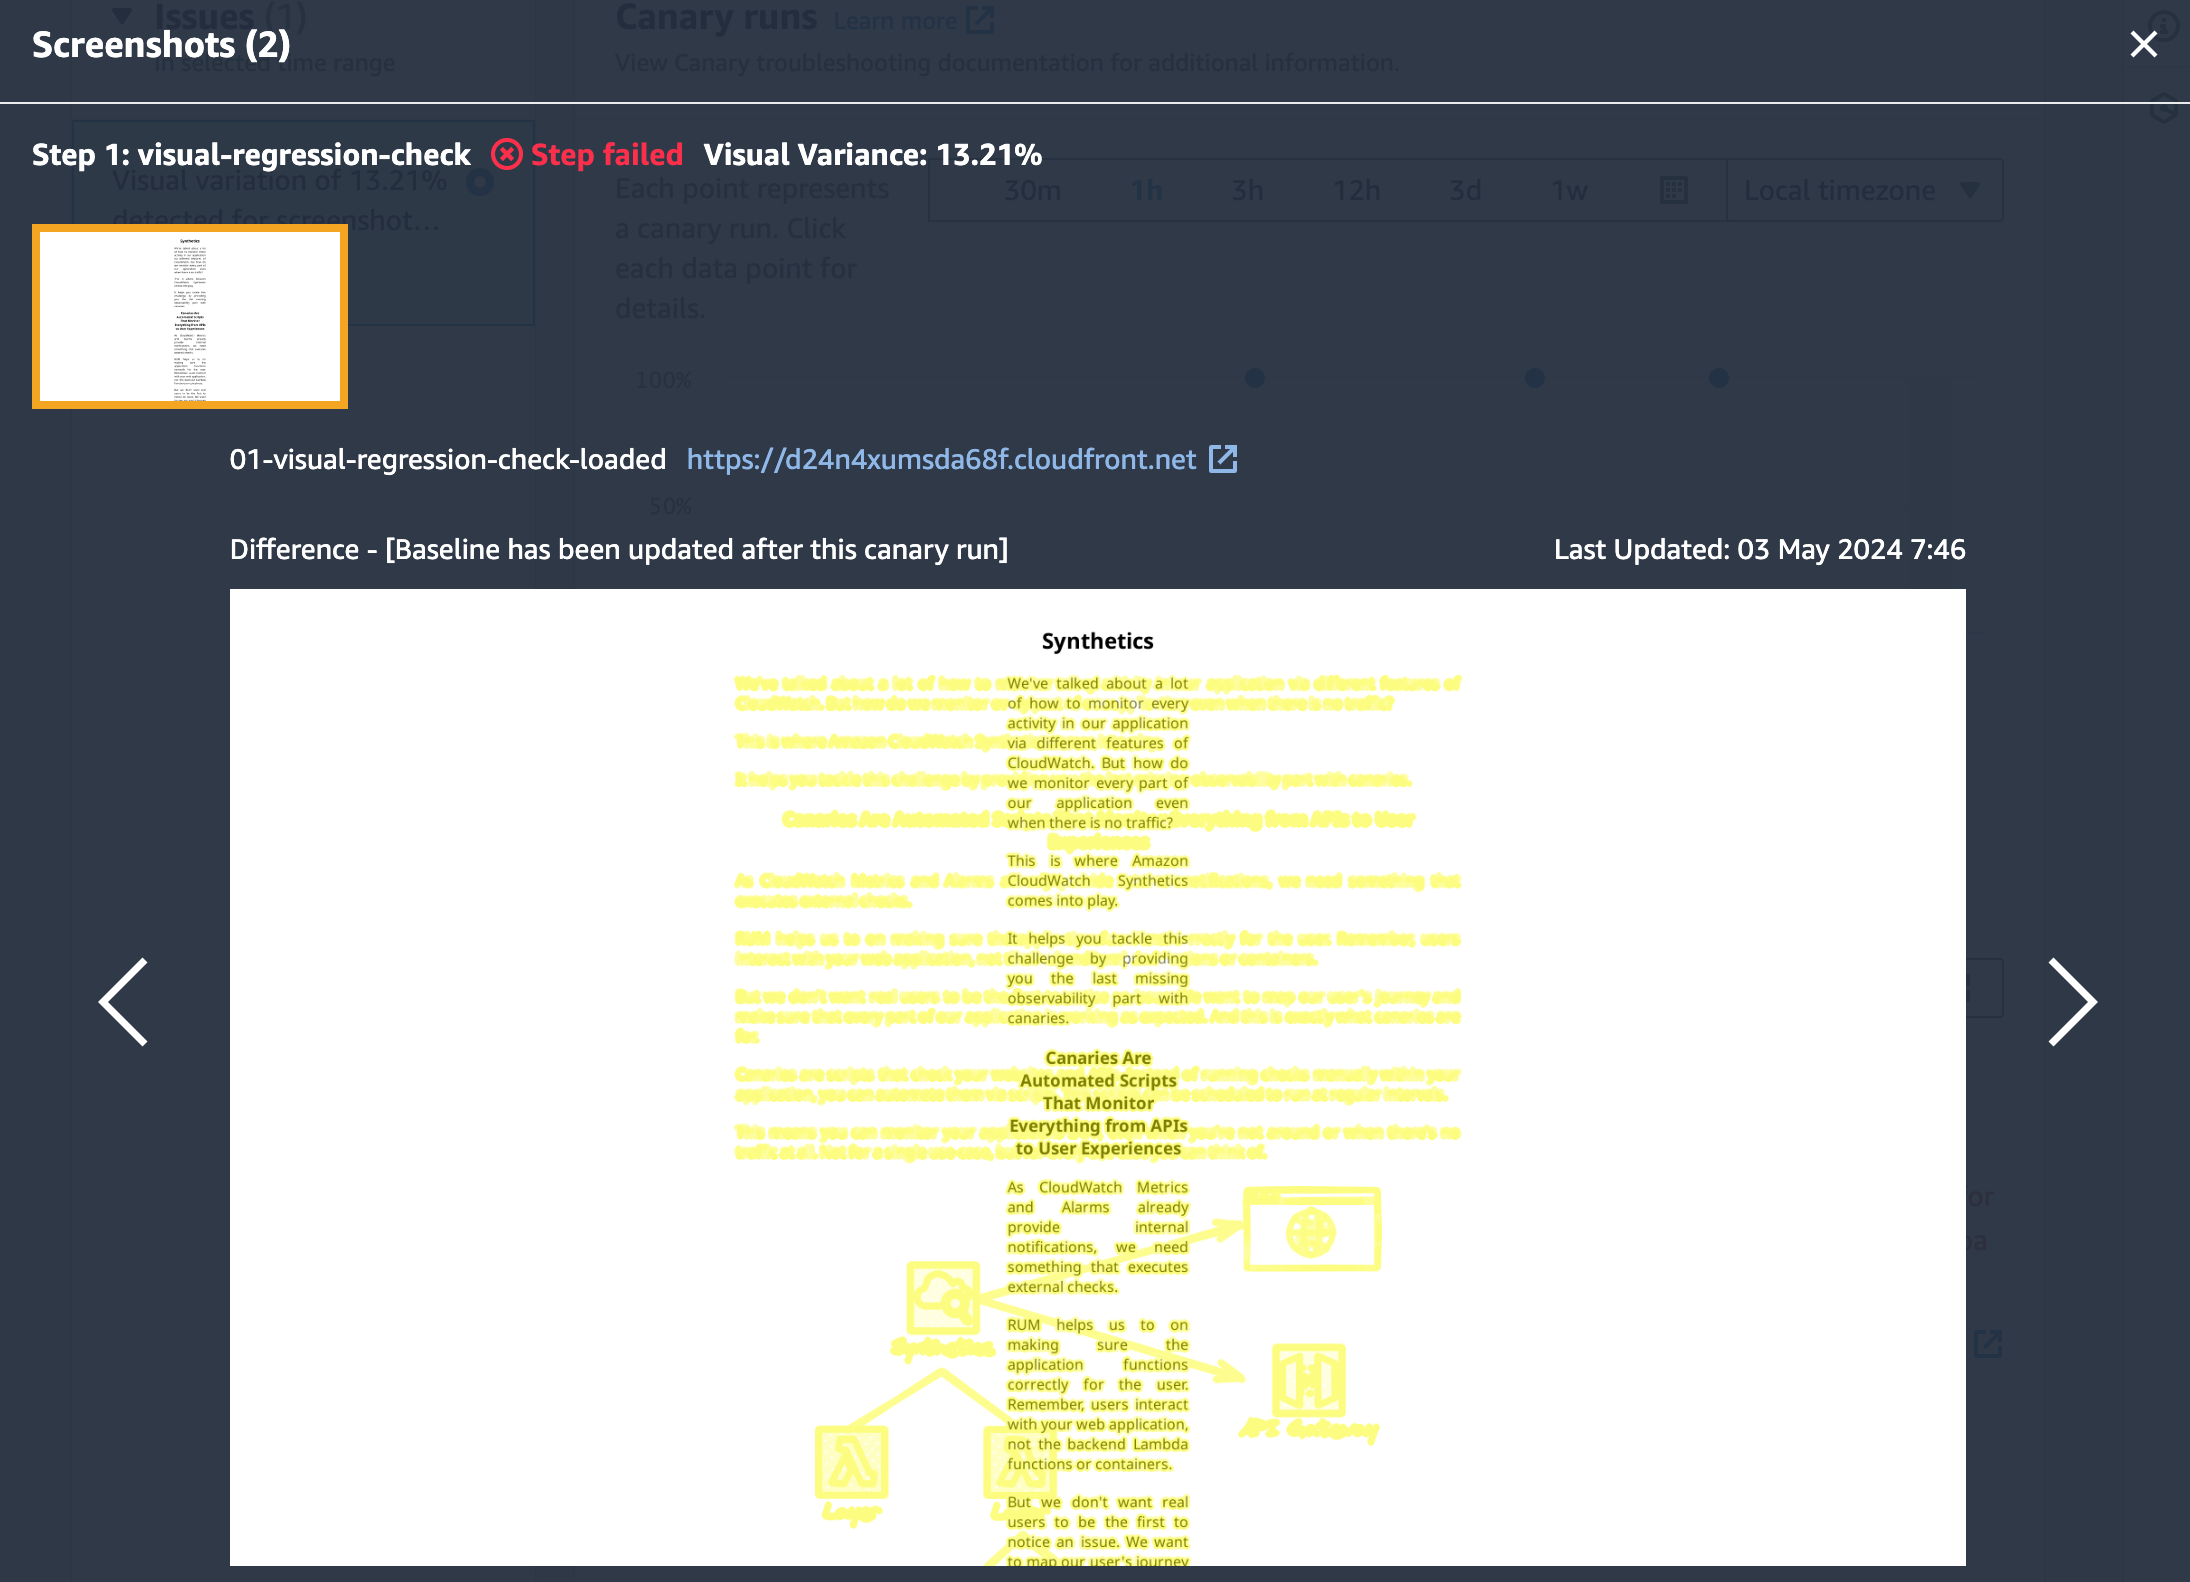
In our example change, the actual difference was 13.21%. The threshold at which CloudWatch starts to fail the check can be set via the configuration property visualVarianceThresholdPercentage. In our example, we went with 0 to fail at any change. In a real-world scenario, this value should be higher as very small layout adjustments shouldn't result in a failed regression test.
Continuing with our failed check: what if this is exactly what we want it to be?
If we don't return our page to the look and content it had in the first screenshot that CloudWatch took, we'll get a failure for every run that has to come.
But we can also tell CloudWatch, that this should now be the new baseline to compare against.
Let's click on Actions > Edit and scroll down to the Visual Monitoring section.

Here, we can enable CloudWatch to use the next run's screenshot to overwrite the existing base image.

By that, future runs won't end in failures and the next runs should be green again.
Conclusion
By using AWS Synthetic Canaries, you’re not just just simply monitoring the uptime of your site. You can actively check for the expected look and feel. This helps to quickly spot and address visual issues in any web application.
This visual regression feature even comes with a blueprint, making it easy to get started.
Related Reads
Building on visual regression testing with AWS CloudWatch Canaries, these articles will help you enhance your AWS CloudWatch knowledge. Discover comprehensive guides on CloudWatch Synthetics, dashboards, and custom metrics:
Subscribe to my newsletter
Read articles from Tobias Schmidt directly inside your inbox. Subscribe to the newsletter, and don't miss out.
Written by

Tobias Schmidt
Tobias Schmidt
Helping aspiring engineers master the cloud.