Machine Learning - Naive Bayes (14)
 Md Shahriyar Al Mustakim Mitul
We understand this by
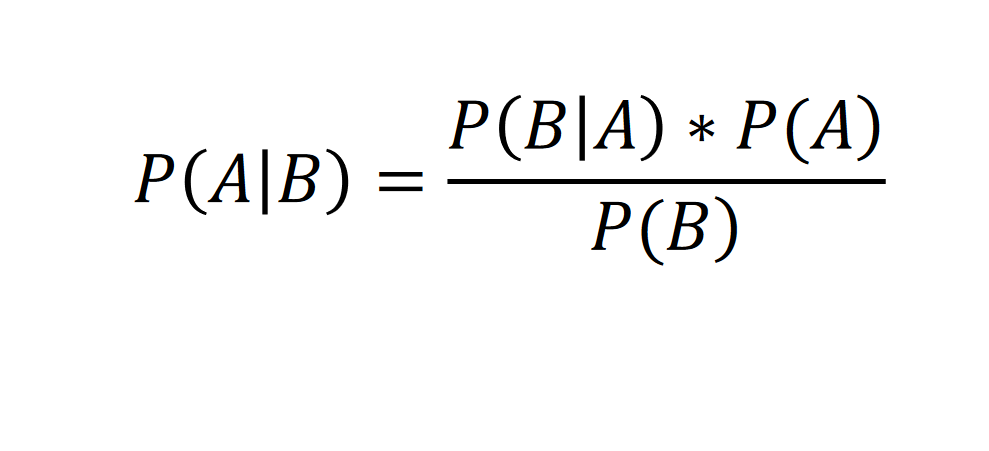
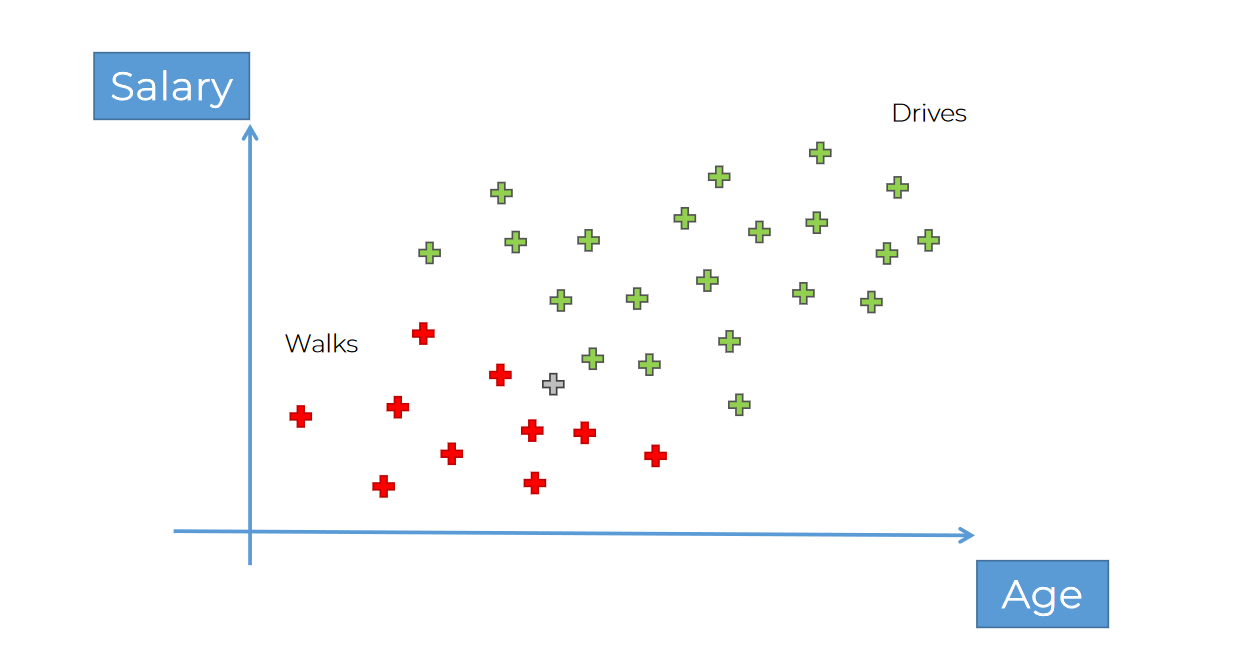
Assume that, this time we don't know what a persons salary and age is but want to categorize it to a portion,
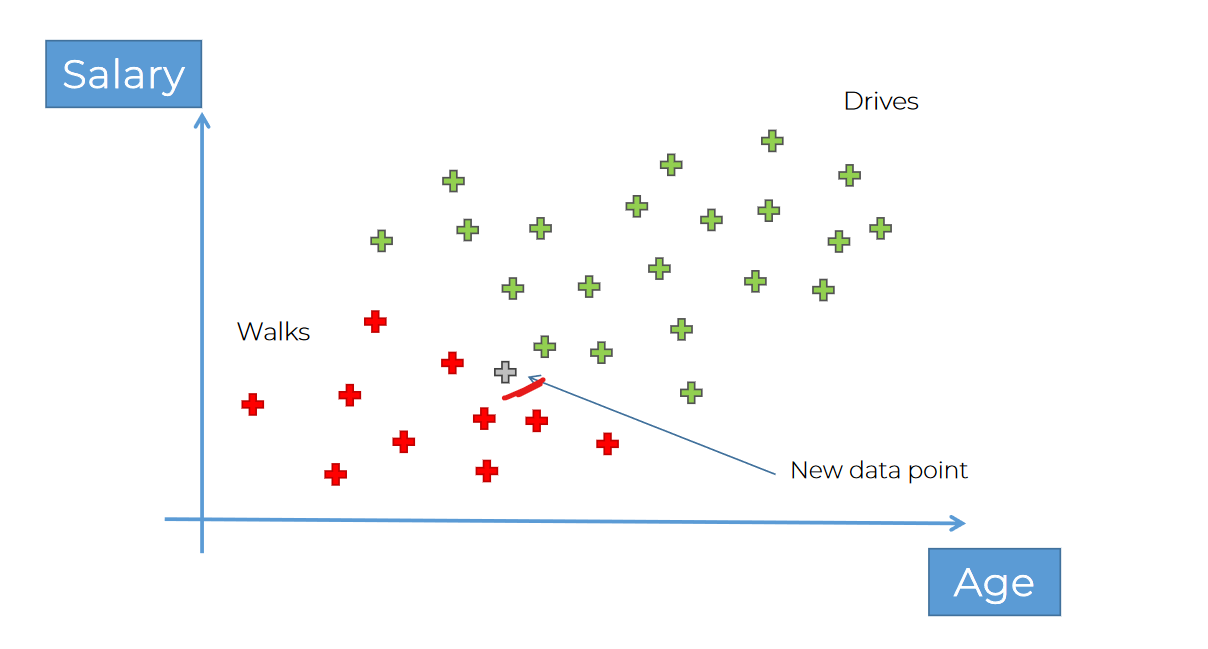
for example, we have few data of people who walks and few data of people who drives.
If we get new data point, where to include this?
So, how we can solve it is,
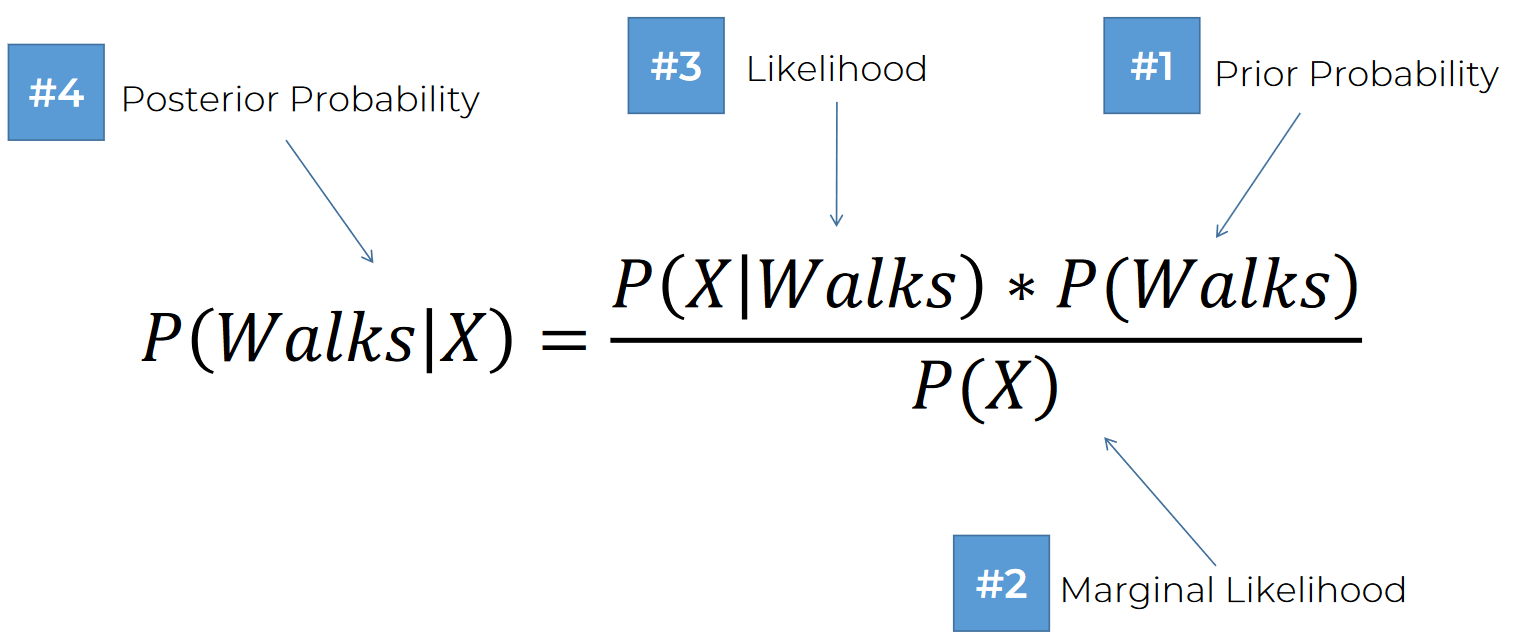
If we follow that previous law, and apply it here!It goes for walking
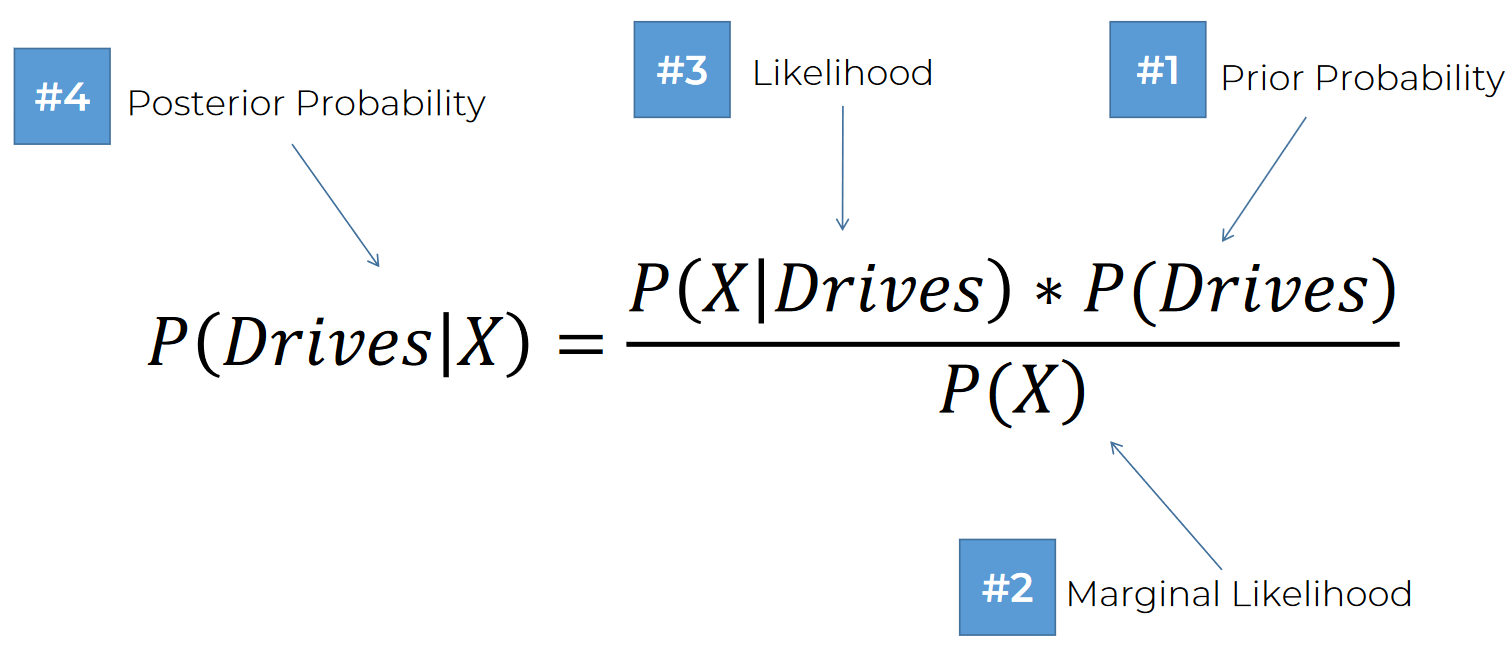
Same goes for drive
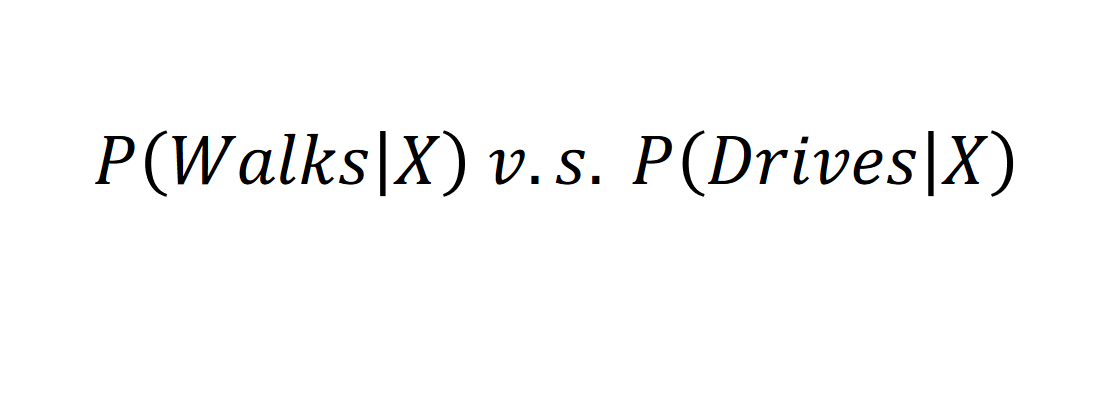
Then this one! Let's start the process:
Starting with this: We are looking to find how much probability of that it walks category and it's that point
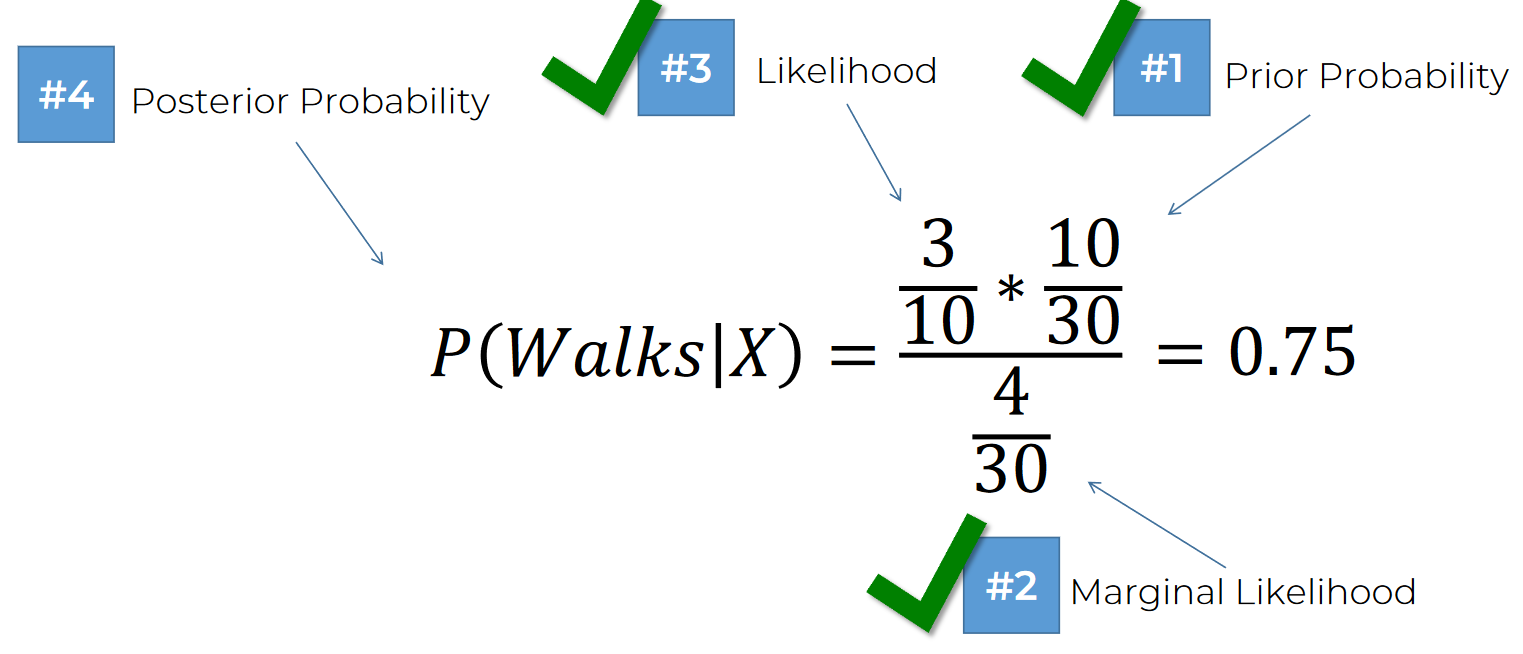
Let's find out the probability of walking:
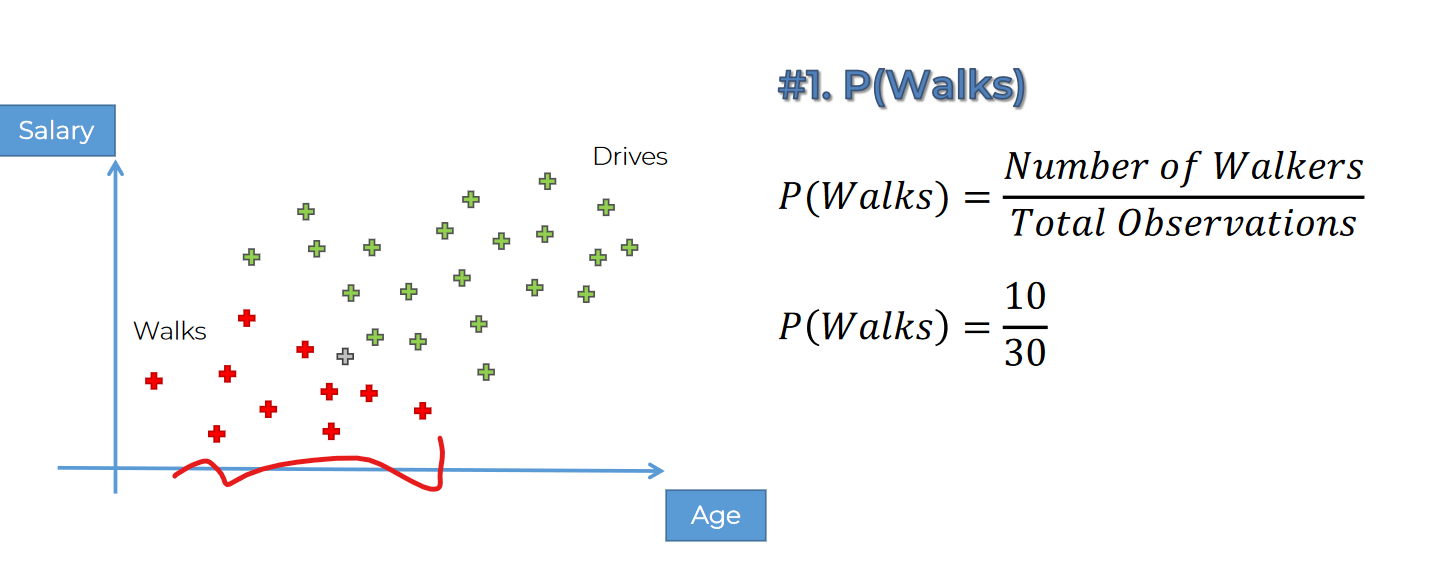
we have 30 points here and 10 are red (which means they walk)
Then this one: (We are selecting a circle where the point and other category( red & green) data is present)
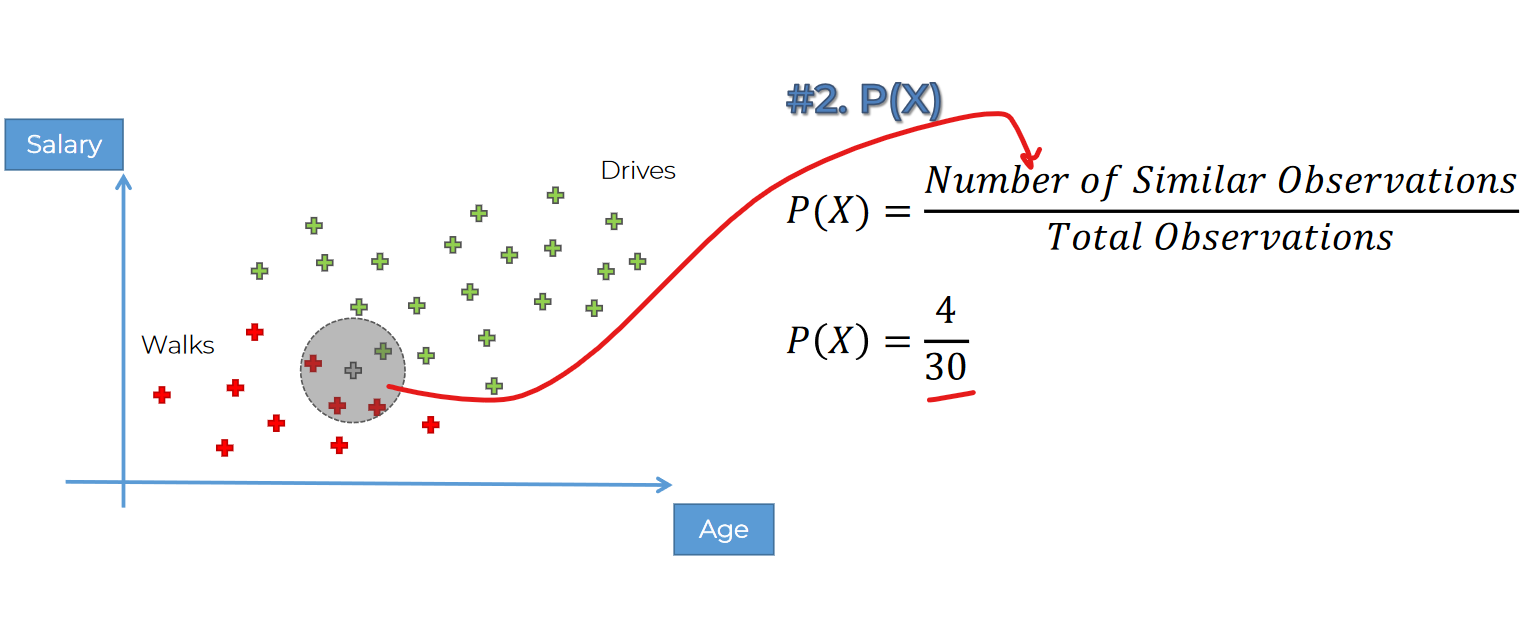
we have 4 in this circle and in total 30 data point.
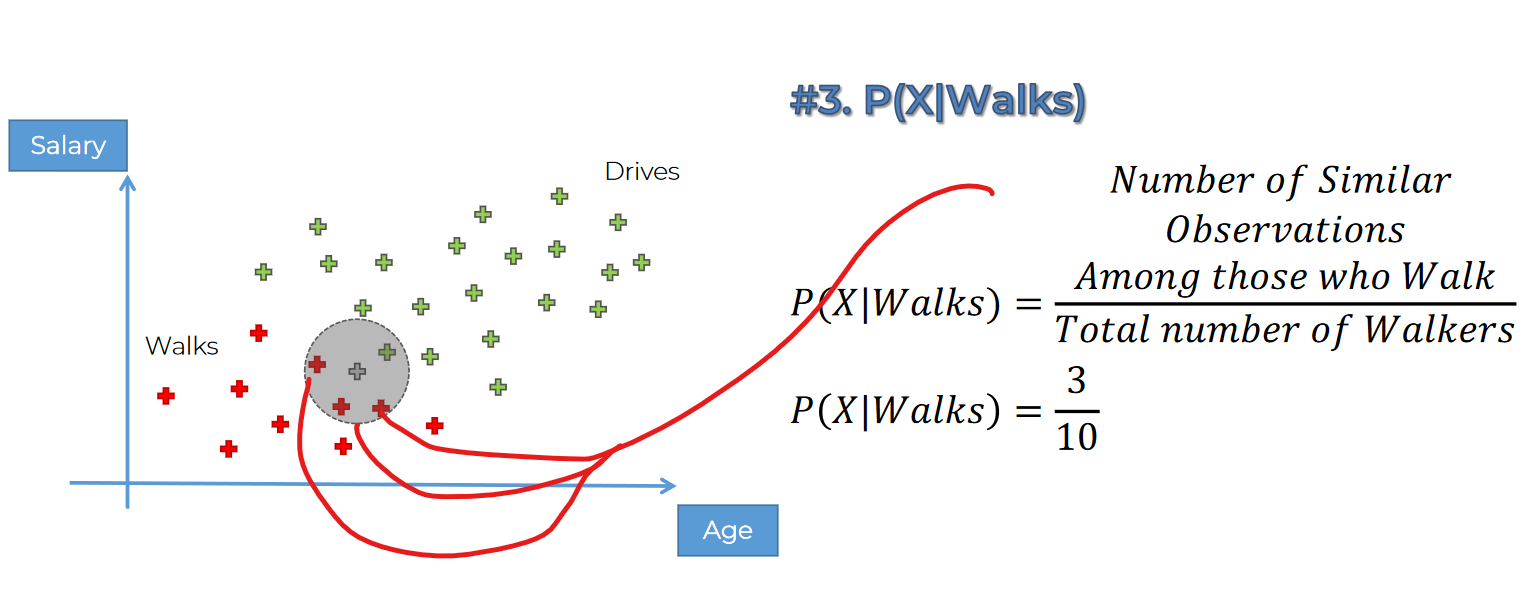
So, here is the solution:
In the same way, we can find out the probability that the point is in driver category and it's that point
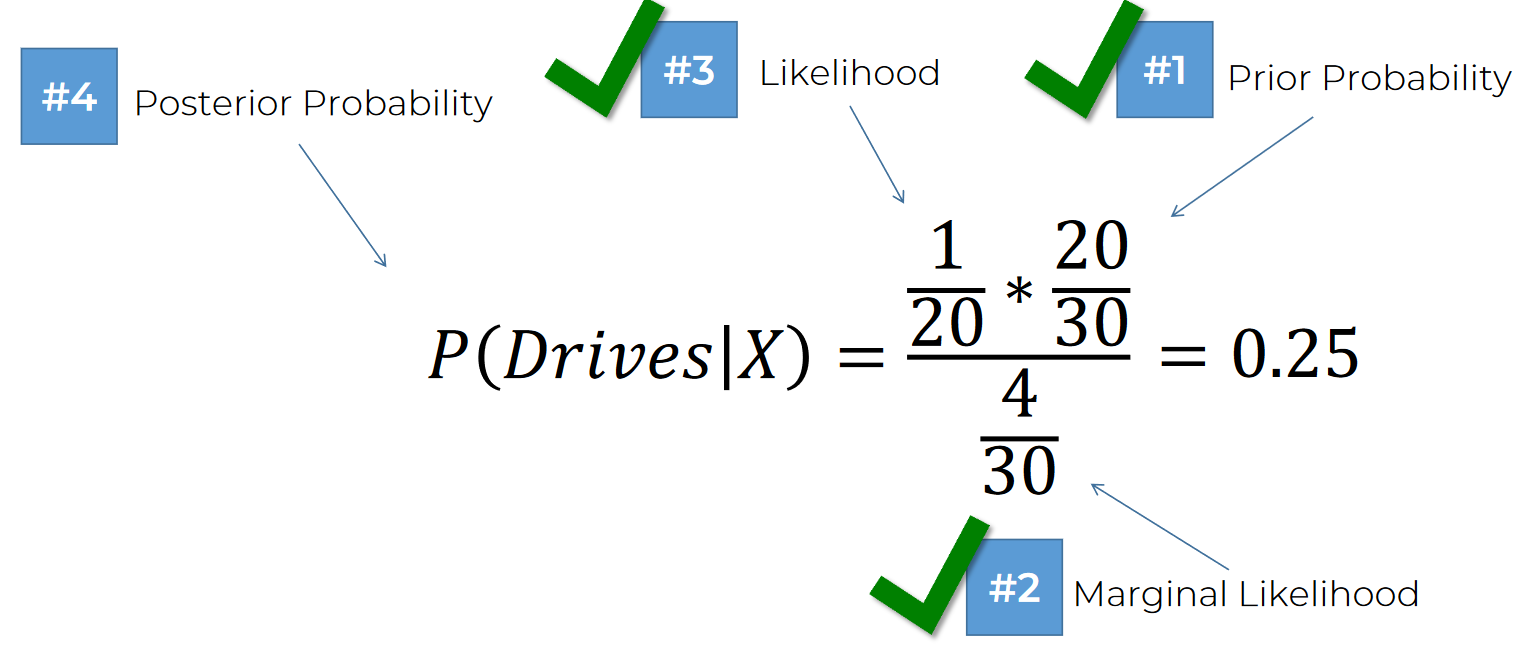
So, it's:
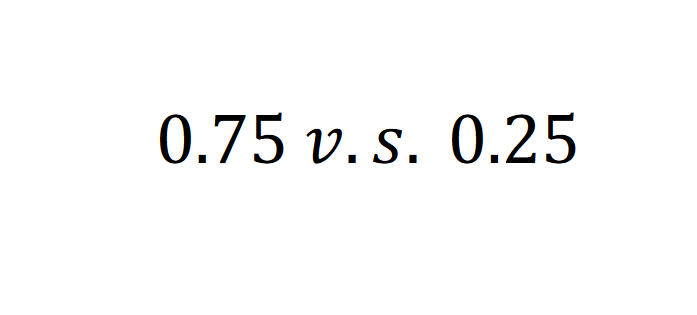
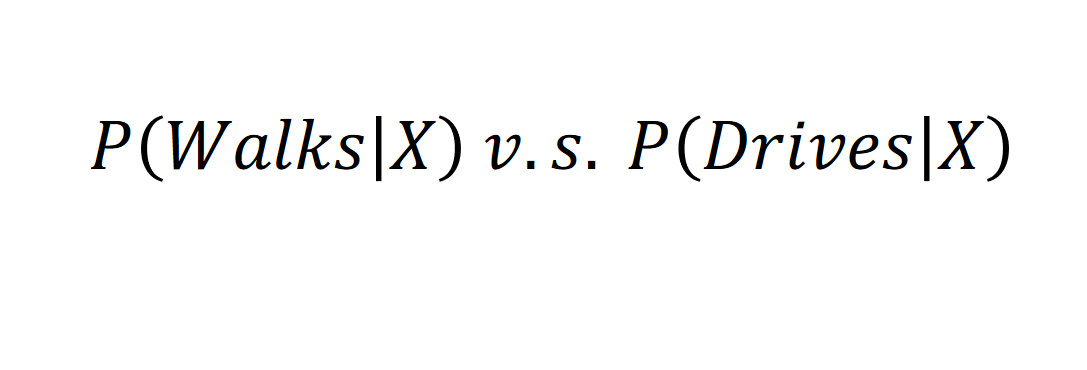
So, it sums up to 1 (0.75+0.25). Makes sense I guess!!
As
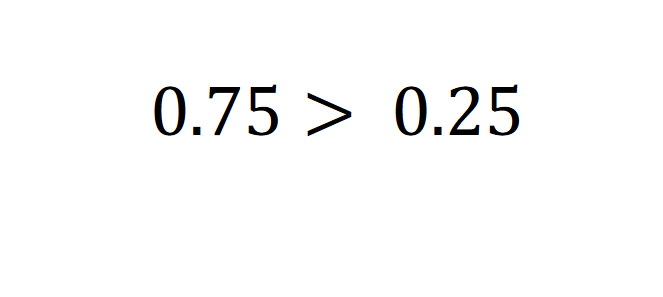
So, the person has more opportunity to walk than drive

So, previously we had this:
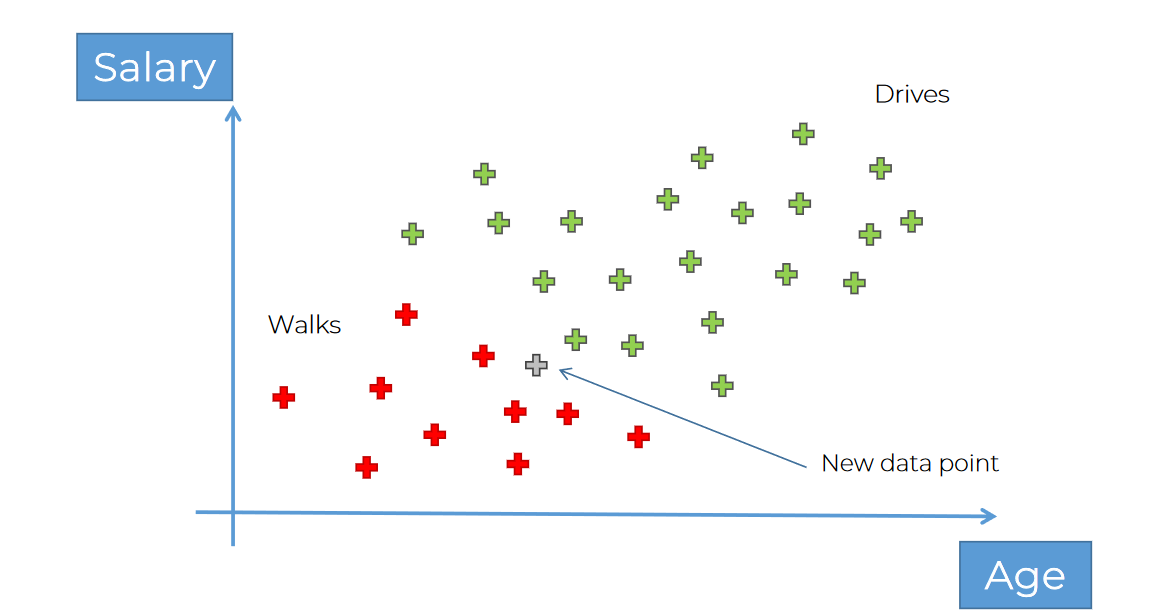
Now we can set it's color as red (meaning it walks)
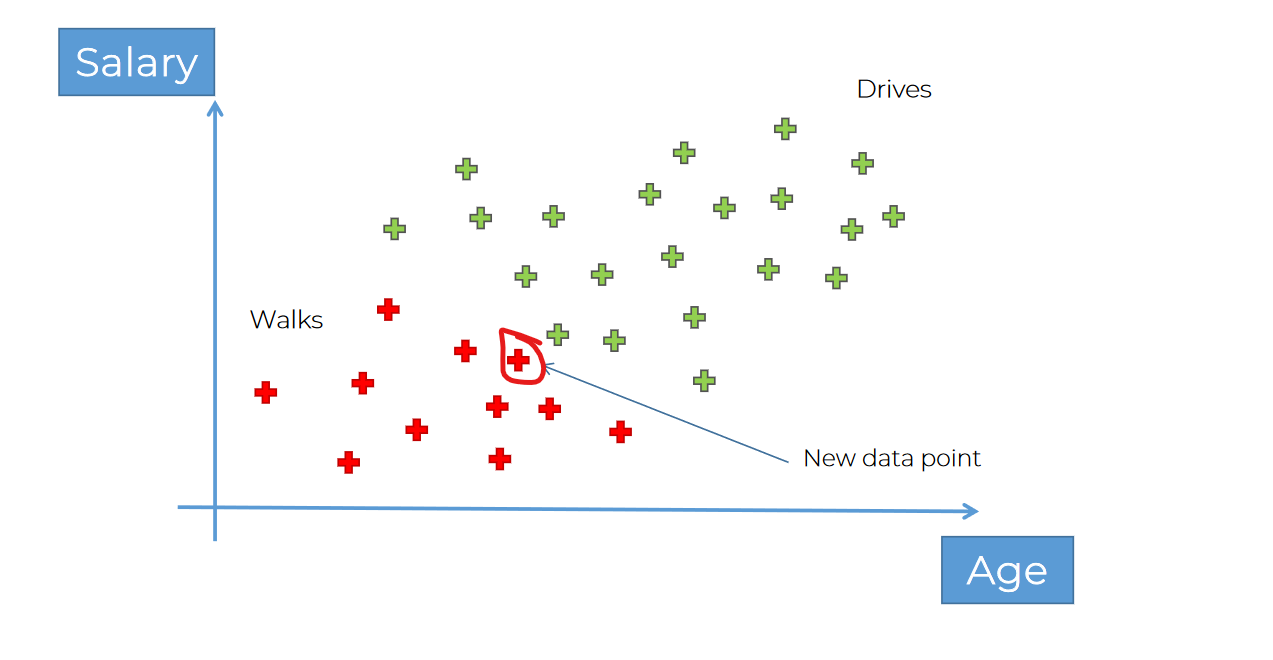
Let's code it down!
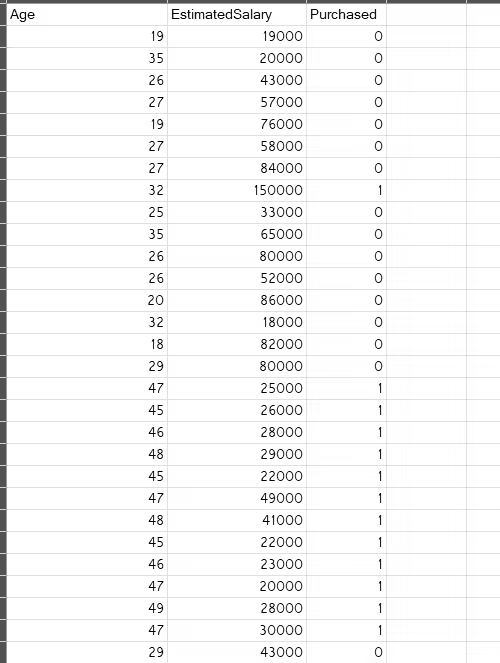
Problem statement: We are launching a new SUV in the market and we want to know which age people will buy it. Here is a list of people with their age and salary. Also, we have previous data of either they did buy any SUV before or not.
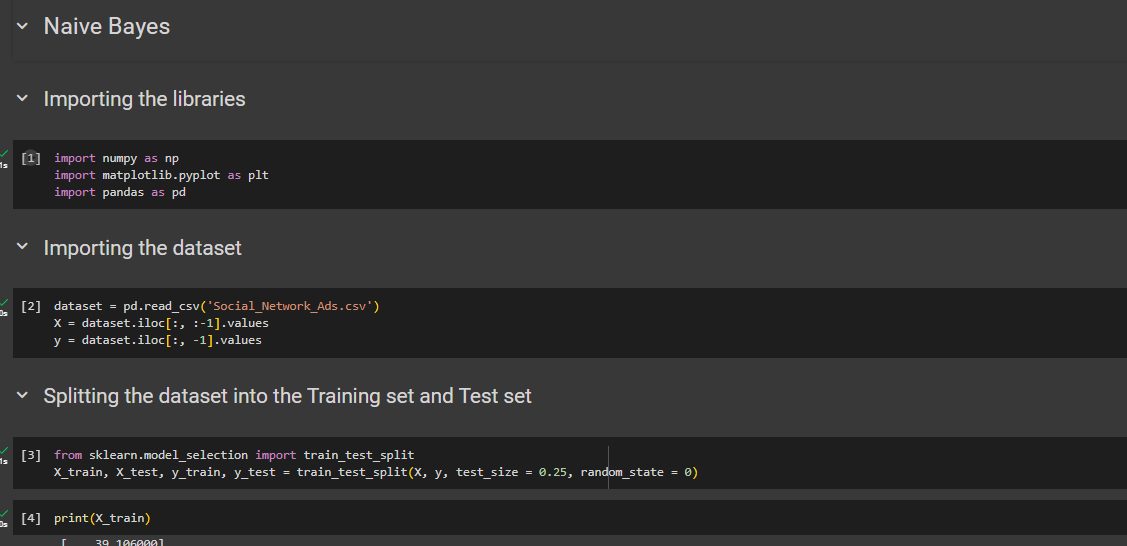
Firstly import libraries, dataset and split them
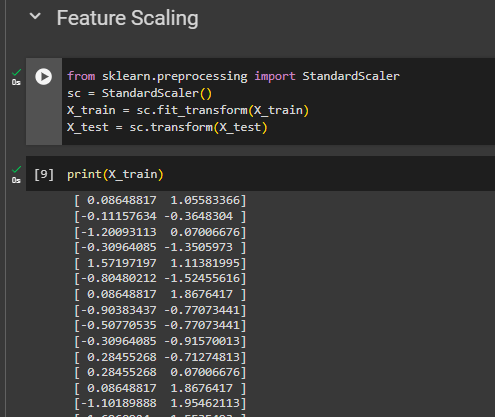
Feature Scaling
Training the Naive Bayes model on the Training set
from sklearn.naive_bayes import GaussianNBclassifier = GaussianNB()classifier.fit(X_train, y_train)
Predicting a new result
for a data which has age 30 and salary 87k
print(classifier.predict(sc.transform([[30,87000]])))Predicting the Test set results
y_pred = classifier.predict(X_test)print(np.concatenate((y_pred.reshape(len(y_pred),1), y_test.reshape(len(y_test),1)),1))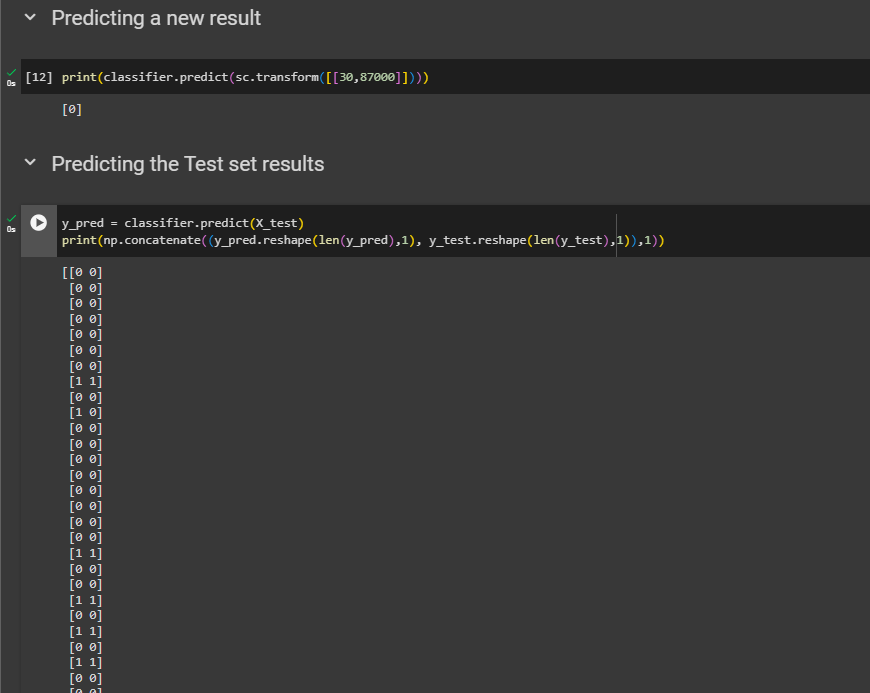
Making the Confusion Matrix & accuracy
from sklearn.metrics import confusion_matrix, accuracy_scorecm = confusion_matrix(y_test, y_pred)print(cm)accuracy_score(y_test, y_pred)
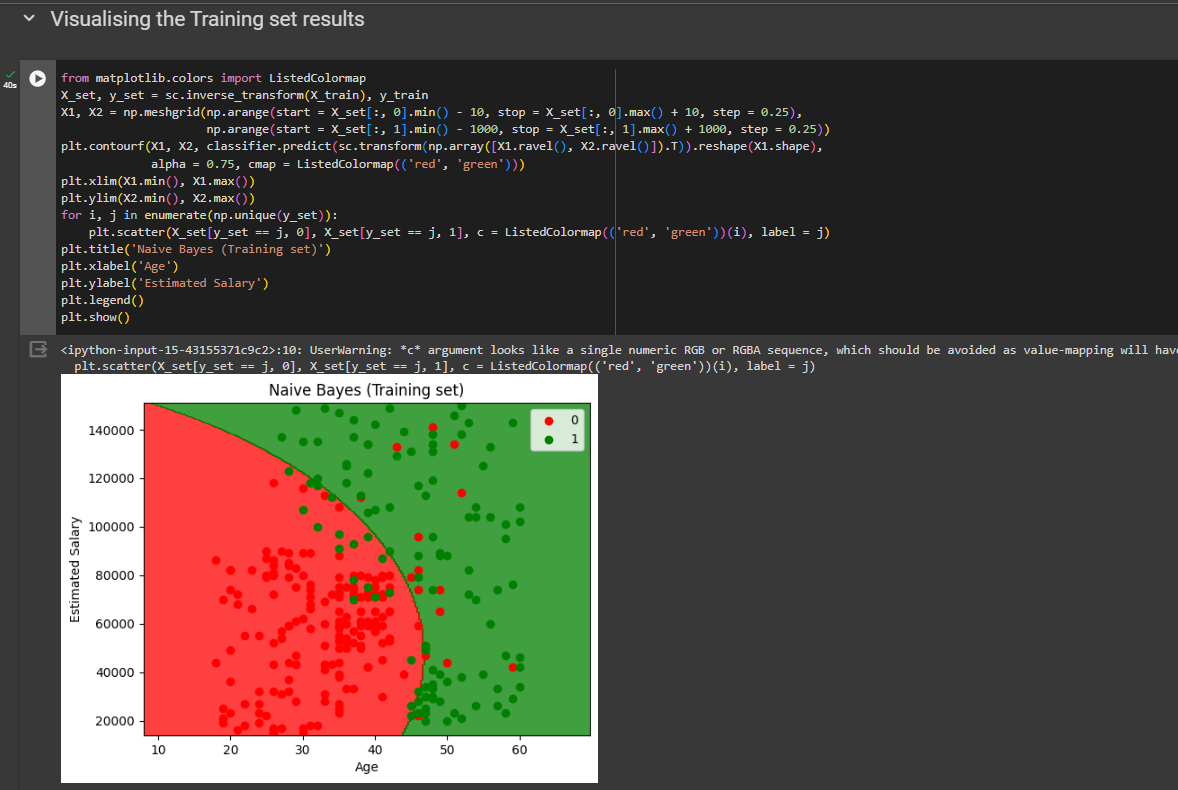
Visualizing the Training set results
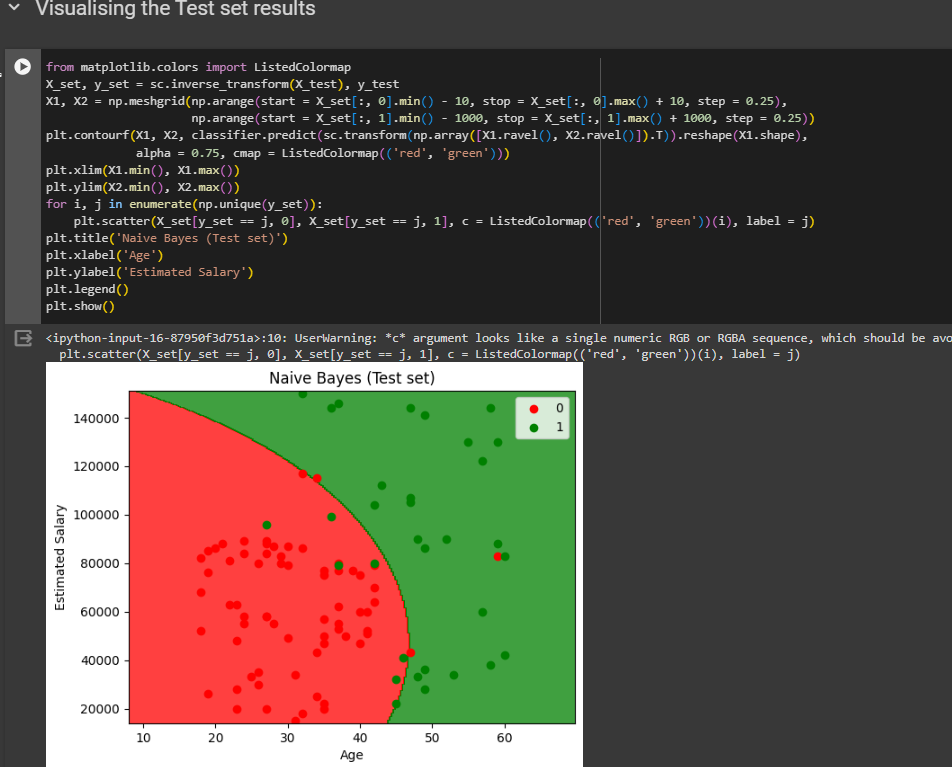
Visualizing the Test set results
Check out the code and the dataset
Thank you
Subscribe to my newsletter
Read articles from Md Shahriyar Al Mustakim Mitul directly inside your inbox. Subscribe to the newsletter, and don't miss out.
Written by
