Logistic Regression - Supervised Learning Classification
 Retzam Tarle
print("Logistic Regression")
This is the 10th consecutive post on this blog, I feel good 👽🦾🎉🤗.
Now back to this week's chapter 🏃🏼.
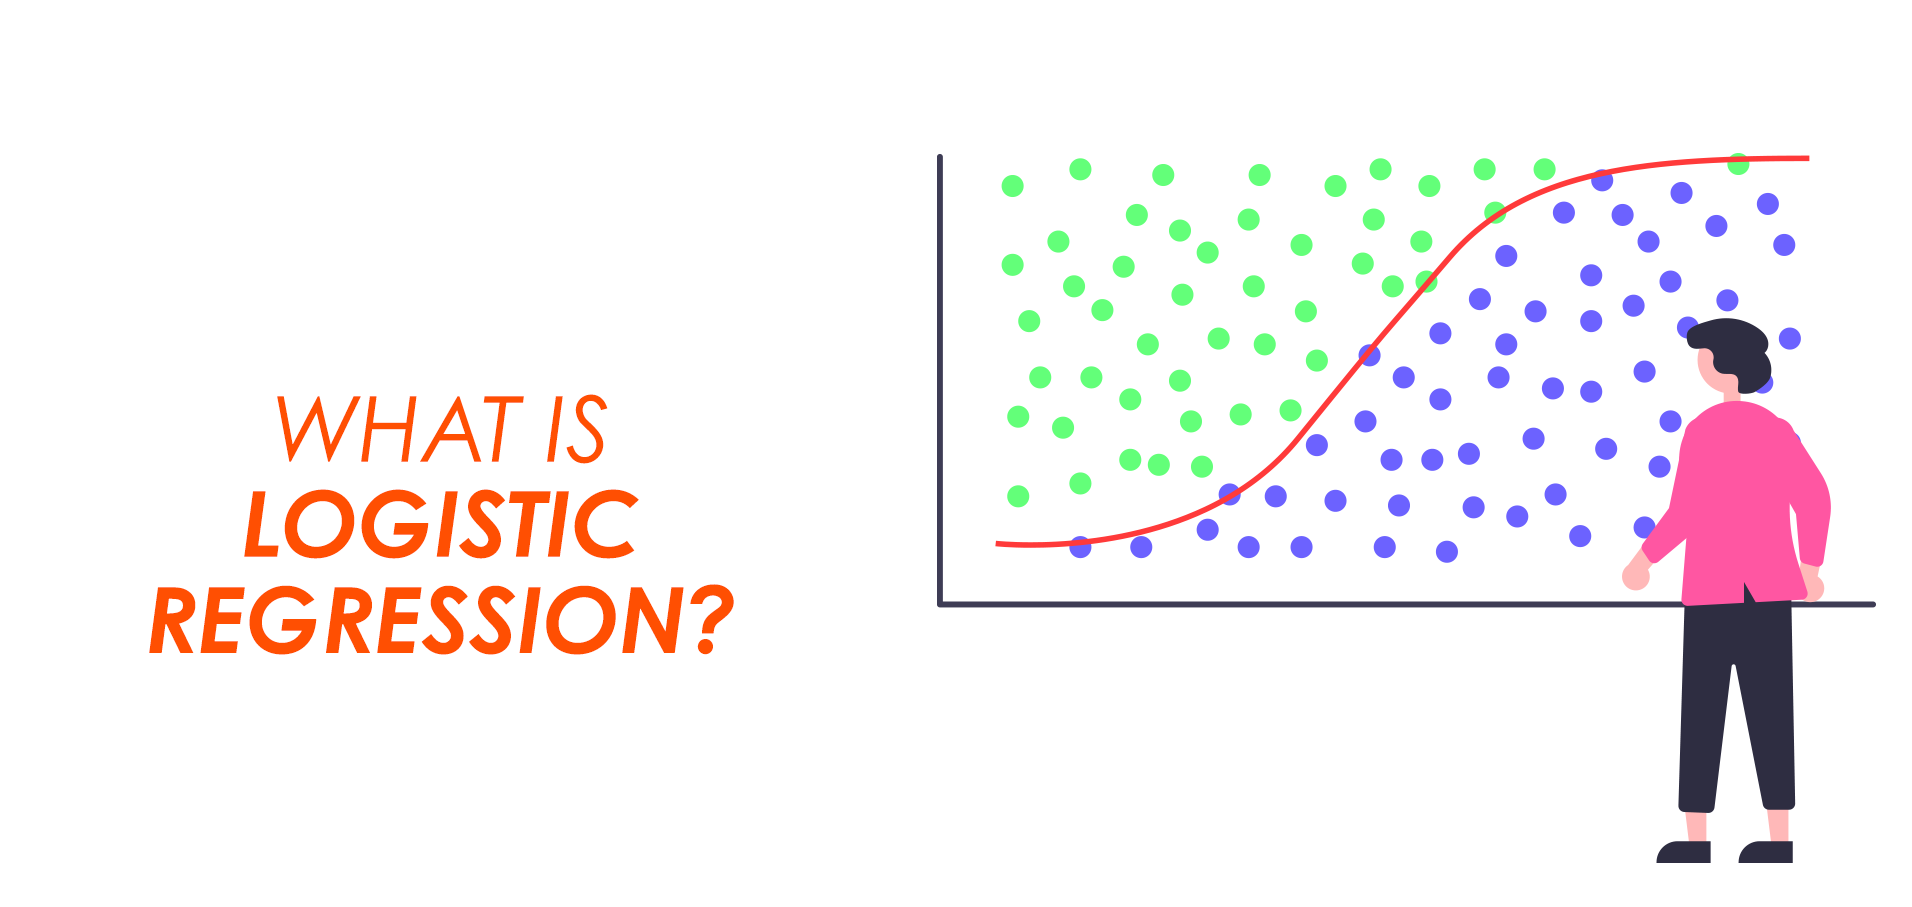
Logistic regression is a supervised learning classification model widely used for binary classification tasks. It uses the logistic (or sigmoid) function to transform a linear combination of input features into a probability value ranging between 0 and 1.
Logistic regression is used when the dependent variable(target/outcome) is categorical(eg spam/not spam), while its sibling Linear regression is used for targets that are continuous(1, 2, 3 ... 100), we'll talk about the latter when we are discussing regression models.
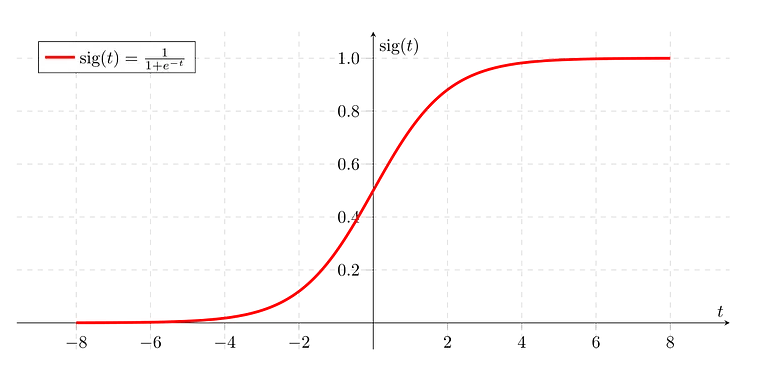
The Logistic function is a sigmoid function also called the logit. The sigmoid function helps us turn any number into a probability, where 0 means very unlikely and 1 means very likely, based on how much influence that number has on the outcome.
The formula looks like this:

The function looks like the image below on a 2D(2-dimensional) plane:
Consider a task to predict if a person would purchase health insurance using their age and probability range based on past purchases. Let's try solving this with Logistic Regression.
First, let's draw a 2D plane with the probability and age as shown in the illustration below:

As seen above we draw the sigmoid function that we'll use to make predictions. Any value above 1 is set at 1, and any value less than 0 is set at 0. This is seen in the shape of the sigmoid as well which is shaped like an S, with the top flattened(at 1) and the bottom flattened(at 0) as well.
We then draw out a threshold line at the middle of the sigmoid that we will use for our classification of any item position that goes above the threshold will be classified as 1, and any item below the threshold will be classified as 0. 1 here means the person would buy and 0 means the person would not buy. Now we can see why Logistic Regression is great for binary classification tasks.
To go into a more in-depth and detailed explanation of logistic regression, check out this article here.
Playground
Play-play time 🤗 https://retzam-ai.vercel.app. For this chapter, we trained a model to predict whether a machine with a combustion engine would fail or not based on its current condition. We used Logistic Regression to train the model, you can go and try it out directly here.
Enter the machine's details as shown below.

The model would predict whether the machine would fail or not using logistic regression.
There is something of note in the playground. In each project we work on we have trained models for all the models we've discussed right up to this point. So you can compare the performance of each model on different datasets. This is important because it helps you know what model would work best in different scenarios with different datasets.
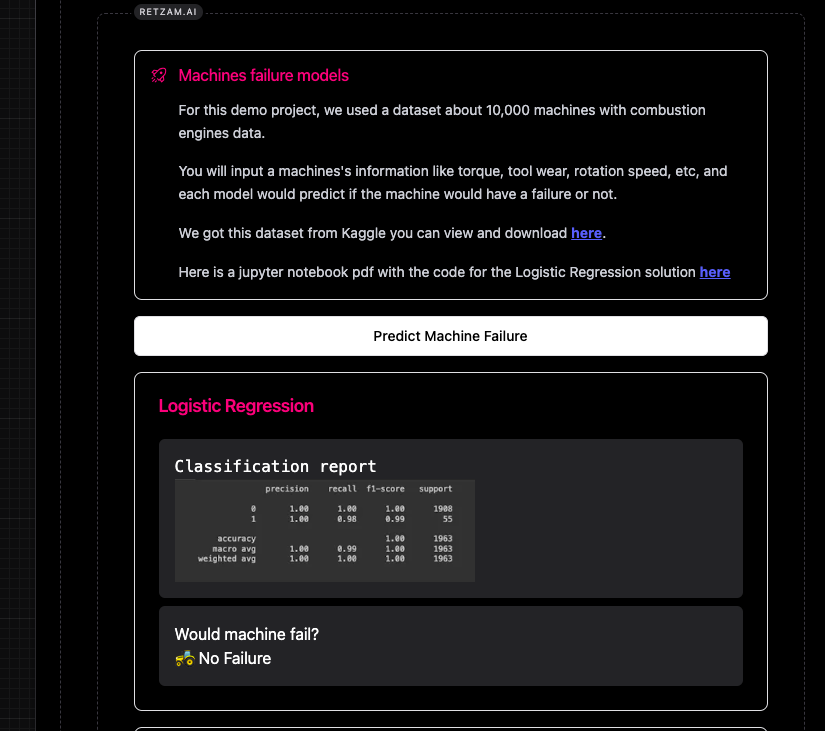
The image below shows the predictions for the model and the performance report.
Hands-On
We'll use Python for the hands-on section, so you'll need to have a little bit of Python programming experience. If you are not too familiar with Python, still try, the comments are very explicit and detailed.
We'll use Google Co-laboratory as our code editor, it is easy to use and requires zero setup.Here isan article to get started.
Here is a link to our organization on GitHub, github.com/retzam-ai, you can find the code for all the models and projects we work on. We are excited to see you contribute to our project repositories 🤗.
For this demo project, we used a dataset of about 10,000 machines with combustion engine data from Kaggle here. We'll train a model that would predict if the machine would have a failure or not.
For the complete code for this tutorial check this pdf here.
Data Preprocessing
Create a new Colab notebook.
Go to Kaggle here, to download the players' injury dataset.
Import the dataset to the project folder

Import the dataset using pandas
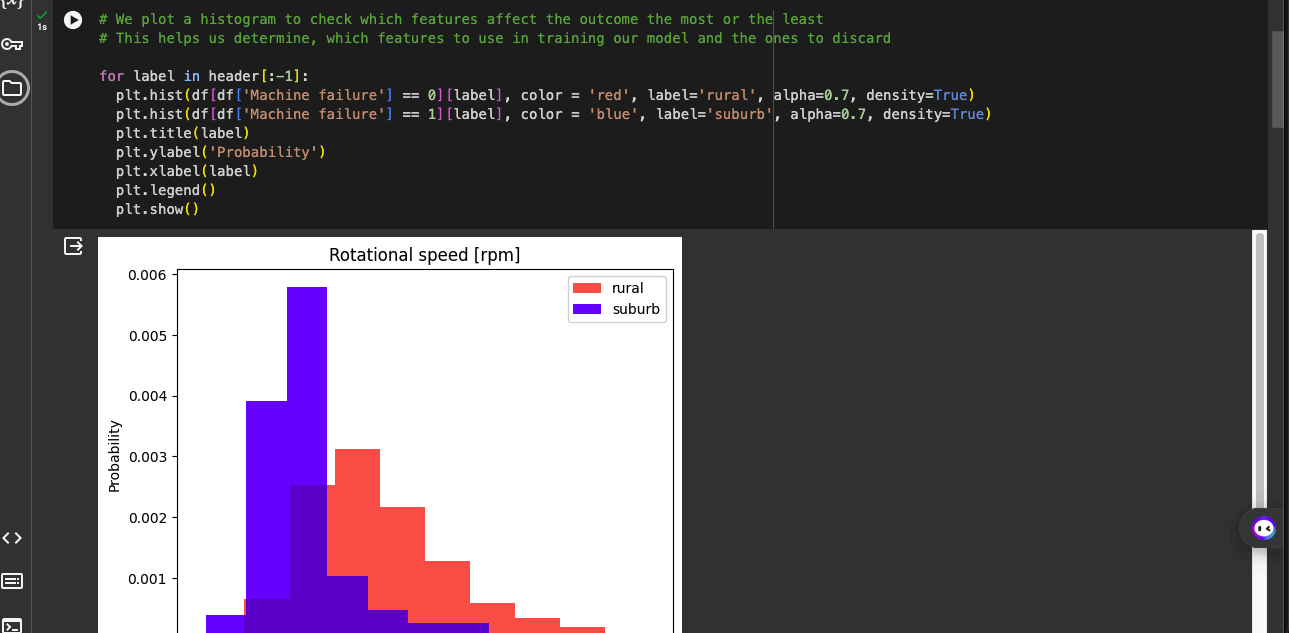
We plot a histogram to check which features affect the outcome the most or the least. This helps us determine, which features to use in training our model and the ones to discard.
We then split our dataset into training and test sets in an 80%-20% format.
We then scale the dataset. X_train is the feature vectors, and y_train is the output or outcome. The scale_dataset function over samples and scales the dataset. The pdf document has detailed comments on each line.
Train model
- We don't need to create our Logistic Regression classifier from the bottom up by ourselves we'll use a library that already implements it from Scikit-learn: Logistic Regression. So we'll import it and train our model with our training dataset.
Performance Review
First, we'll need to make predictions with our newly trained model using our test dataset.
Then we'll use the prediction to compare with the actual output/target on the test dataset to measure the performance of our model.
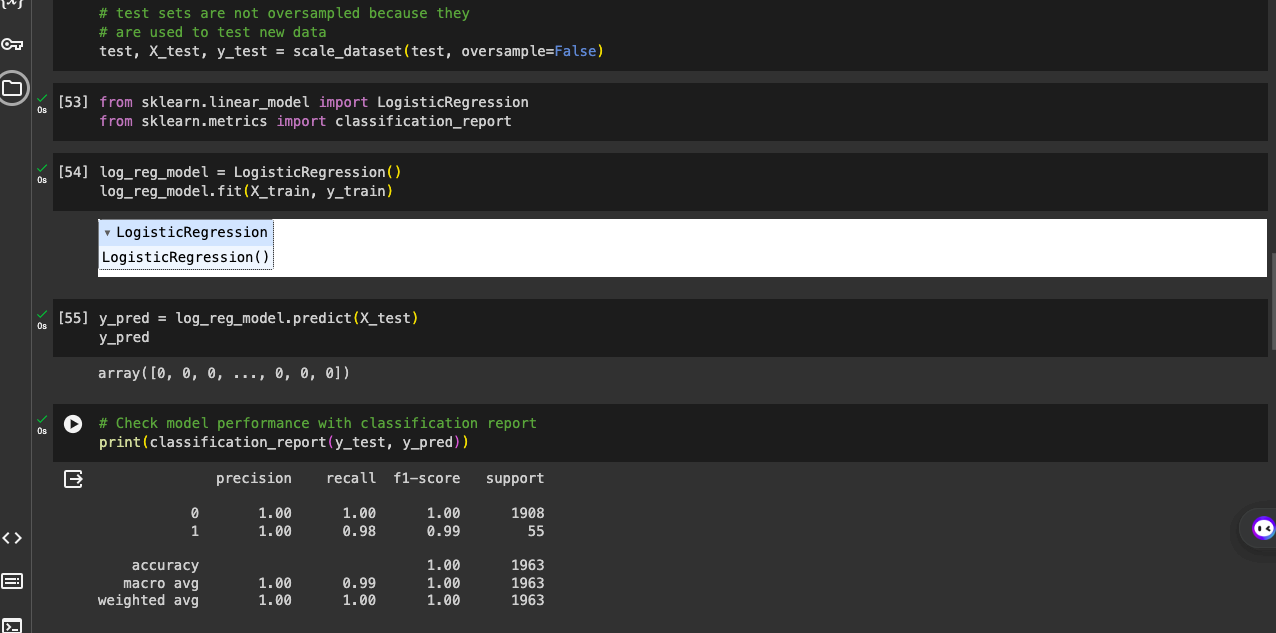
From the image above we can see the classification report.
This is the best model we've trained up till now, with an accuracy of 1 or 100% 🥶.
While celebrating this the Naive Bayes model we trained with the same dataset gave the worst report with an accuracy of 0.03 or 3% 🥶.
This clearly shows why knowing and understanding several models would help get the best results.
Check the playground and compare the model's classification reports and predictions.
End of hands-on
Yea yea 👽, we have completed our third AI model now. That's great progress!
Congratulations to us on our 10th week anniversary! 🤗🎊🤖🦾.

Don't forget to practice and use the playground and code base to help you grow.
In our next chapter, we'll talk about Support Vector Machines. Afterward, we'll have only one model remaining for Supervised Learning Classification tasks.
So catch a breath and gear up let's keep running 🏃🏼.
Subscribe to my newsletter
Read articles from Retzam Tarle directly inside your inbox. Subscribe to the newsletter, and don't miss out.
Written by

Retzam Tarle
Retzam Tarle
I am a software engineer.