Logging using Grafana and Loki
 Varun
Varun
In this article, we will set logging services like Grafana for our docker containers.
Only in simple three steps, we will achieve our Grafana dashboard.
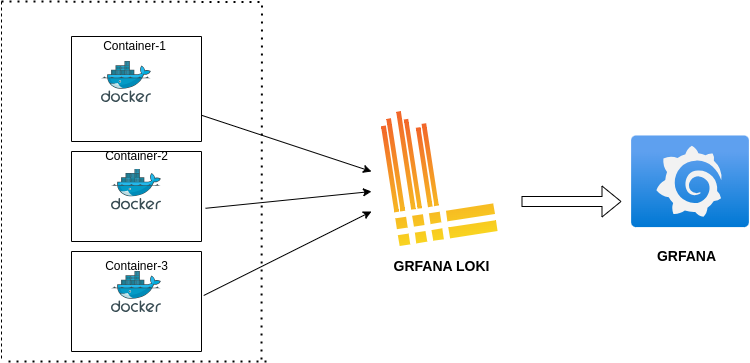
Step 1: Set up Loki on your machine.
For setting up Loki, I prefer the Loki docker image because it is easy to set up and easy to use.
Create a folder for the Loki config file, the most important file in Loki management, to run Loki and can be useful for debugging configuration issues.
 mkdir loki
 cd loki
Now install the config file using:
wget https://raw.githubusercontent.com/grafana/loki/v3.0.0/cmd/loki/loki-local-config.yaml -O loki-config.yamlNow run the following command to run the docker container, and verify that your container is running:
 docker run --name loki -d -v $(pwd):/mnt/config -p 3100:3100 grafana/loki:3.0.0 -config.file=/mnt/config/loki-config.yaml
 docker ps -a
CONTAINER ID IMAGE COMMAND CREATED STATUS PORTS NAMES 4abe5216a6fd grafana/loki:3.0.0 "/usr/bin/loki -conf…" About a minute ago Up About a minute 0.0.0.0:3100->3100/tcp, :::3100->3100/tcp loki
Step 2: Installing Grafana in your machine and initializing it
For setting the Grafana container we need to pass one command only:
docker run -d -p 3000:3000 --name=grafana grafana/grafana-enterpriseVerify whether your container is running or not:
docker ps -aONTAINER ID IMAGE COMMAND CREATED STATUS PORTS NAMES 497dd81c9d25 grafana/grafana-enterprise "/run.sh" About a minute ago Up About a minute 0.0.0.0:3000->3000/tcp grafanaNow move to your browser and visit http://localhost:3000 or if using a VM use http://<machine_public_ip>:3000 (make sure you enable port 3000 and 3100 in inbound rules in case of VM), and log in using default username and password (admin, admin).
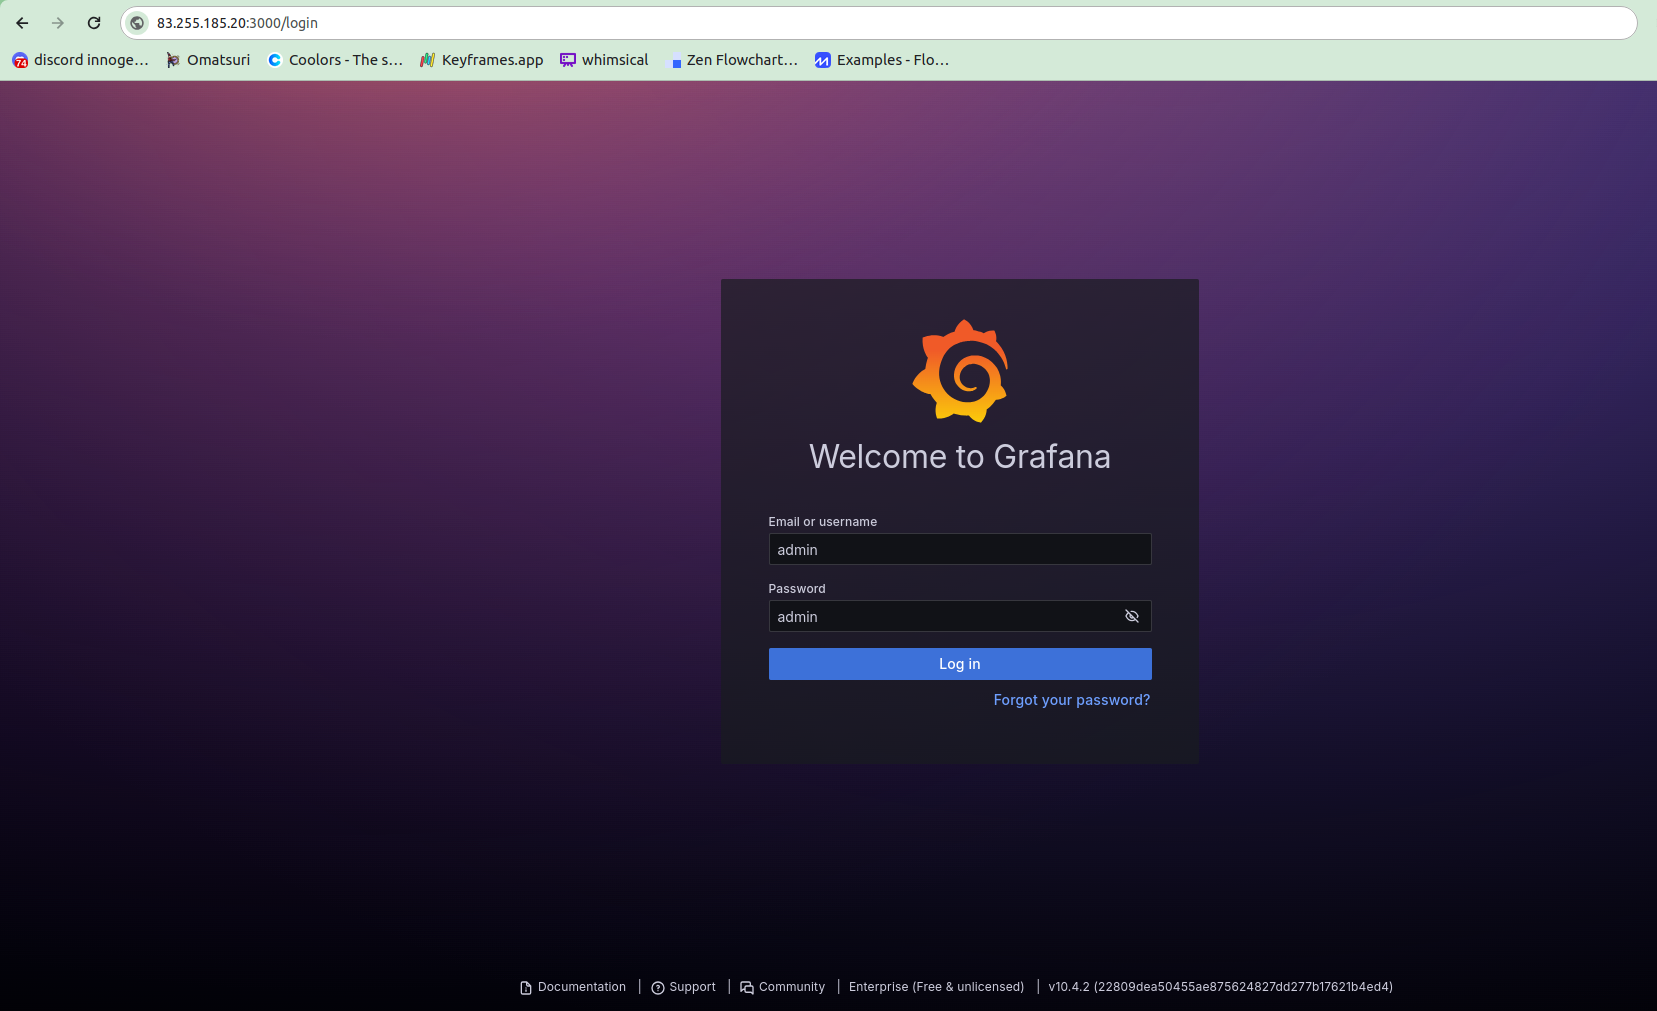
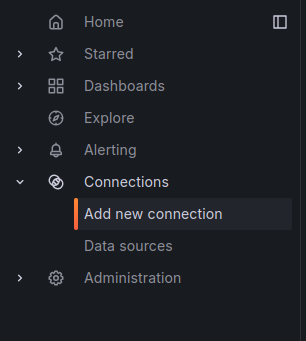
Now, on the dashboard go to connections and click add a new connection from the left pane.
Choose Loki from the given data sources. Now, in the connection input add Loki URL(http://localhost:3100, or http://<machine_public_ip>:3100), and hit the save & test button.

After this step, our Loki is connected successfully with our Grafana.
Step 3: Attach your docker logs with the Loki instance
To streamline the process, each time we execute our docker image, ensure its logger driver is configured to Loki with the provided command:
 docker run --log-driver=loki \
     --log-opt loki-url="http://<machine_ip:3100>/loki/api/v1/push" \
     --log-opt loki-retries=5 \
     --log-opt loki-batch-size=400 \
     <image_name>
Now move to your Grafana dashboard and select the explore tab from the left pane. In the label filter section choose "container" and your container name as its value.
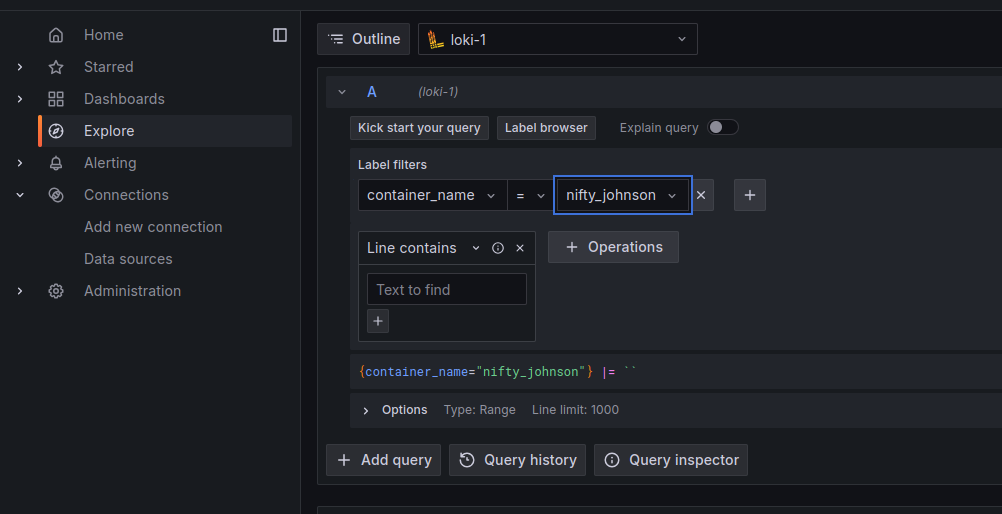
And hit the run query button.
If everything works properly your container logs will be visible.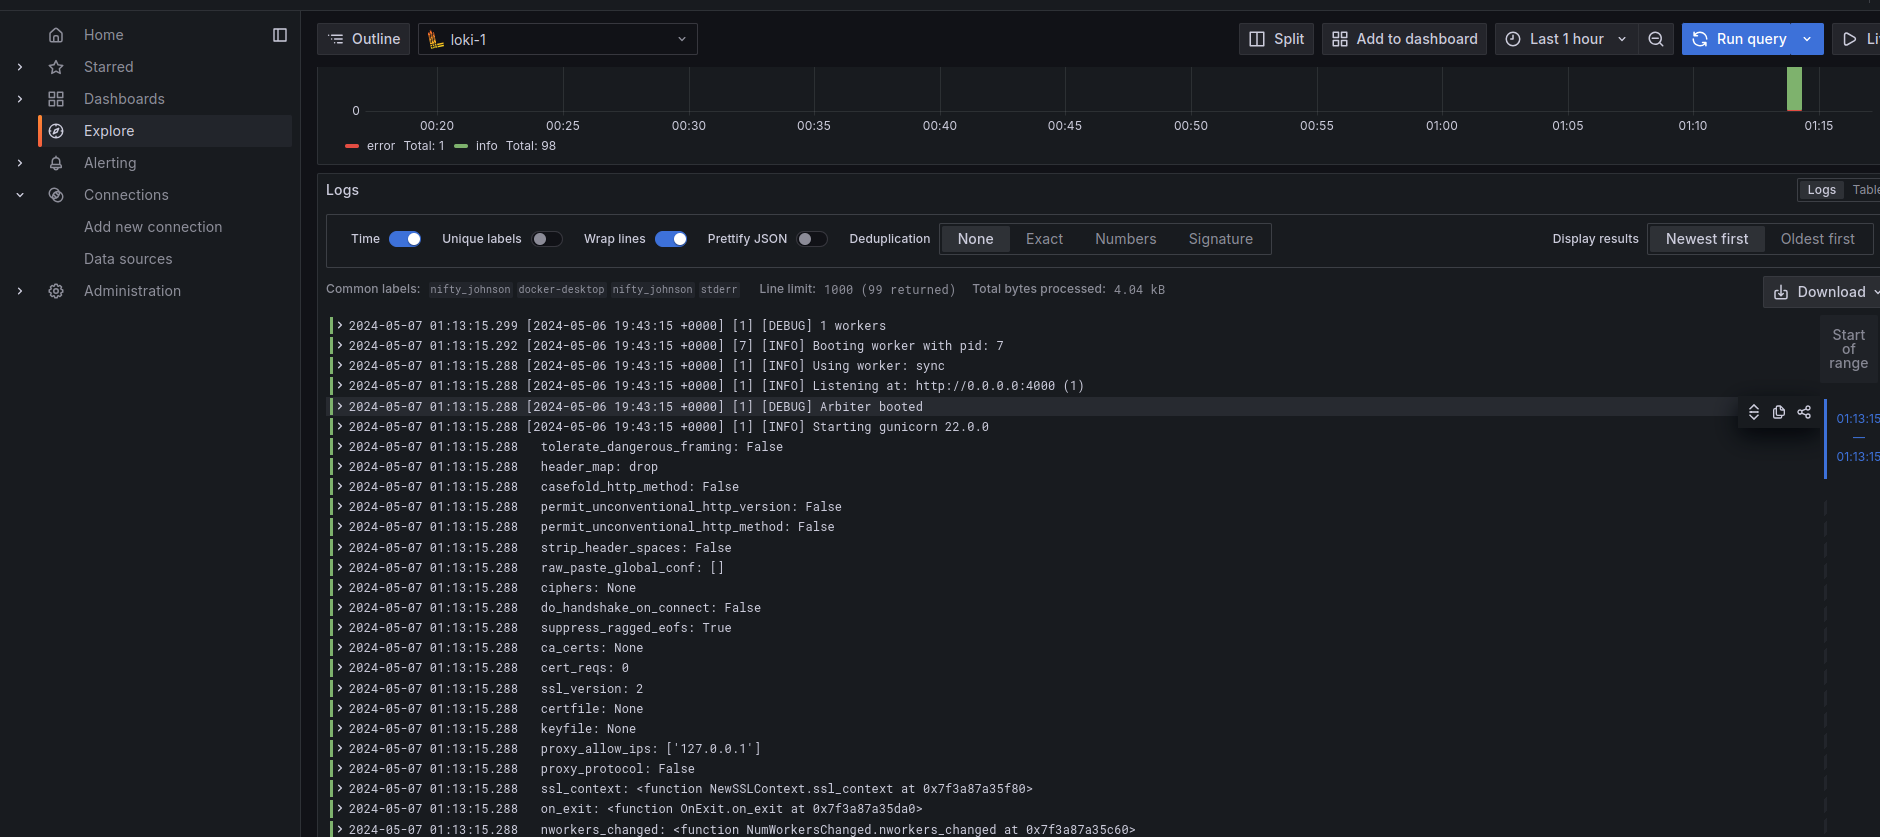
Now you can personalize the Grafana dashboard based on your preference for the graphs you want to visualize.
Reference: https://grafana.com/docs
Subscribe to my newsletter
Read articles from Varun directly inside your inbox. Subscribe to the newsletter, and don't miss out.
Written by
