The Confusion Matrix Metrics
 Haocheng Lin

📖Introduction
In machine learning, evaluating the performance of a model is akin to peering into a crystal ball to gauge its predictive prowess.
One indispensable tool in this evaluation arsenal is the confusion matrix. So, what exactly is this matrix, and how does it unveil the inner workings of a model?
🔢Confusion Matrix
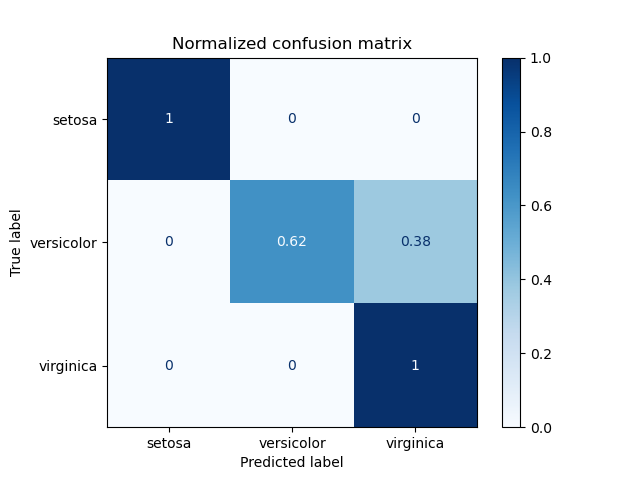
At its core, a confusion matrix is a tabular representation that vividly illustrates the performance of a classification model (Fig. 1).

Fig. 1: An example of a confusion matrix on a normalized iris dataset.
Picture a grid where each row corresponds to the actual class, and each column represents the predicted class. This grid contains the keys to understanding the model's hits and misses 🎯.
✅Evaluation Metric
🔢Equations
$$accuracy=\frac{TP+TN}{TP+TN+FP+FN}$$
Eq. 1: A formula measuring accuracy
$$precision=\frac{TP}{TP+FP}$$
Eq. 2: A formula calculating precision
$$recall=\frac{TP}{TP+FN}$$
Eq. 3: A formula calculating recall
$$F1-Score=\frac{2 \times precision \times recall}{precision + recall}$$
Eq. 4: F1-Score formula calculating the harmonic mean of precision and recall.
$$specificity=\frac{TN}{TN+FP}$$
Eq. 5: A formula calculating specificity
🔤Definitions
Let's delve into the metrics that illuminate this matrix:
1. Accuracy: This metric is a compass, guiding us toward the model's overall correctness (Eq. 1). It calculates the proportion of correct predictions out of all predictions made. Accuracy tells us how often the model gets it right across all classes.
2. Precision: Precision highlights the model's ability to avoid false positives (Eq. 2). It measures the proportion of true positives (correctly predicted positive instances) out of all positive predictions. A high precision score indicates the model predicts positive labels accurately.
3. Recall (a.k.a. Sensitivity): Precision focuses on avoiding false alarms, whereas recall relies on the model's ability to capture all positive instances (Eq. 3). It calculates the proportion of true positives out of all actual positive instances.
4. F1 Score: Often referred to as the harmonic mean of precision and recall, the F1 score offers a balanced assessment of a model's performance (Eq. 4). It strikes a delicate equilibrium between precision and recall, giving equal weight to both metrics. A high F1 score signifies a model that excels in minimizing false positives and capturing true positives.
5. Specificity: As the counterpart to recall, specificity evaluates the model's proficiency in correctly identifying negative instances (Eq. 5). It calculates the proportion of true negatives (correctly predicted negative instances) out of all actual negative instances. Specificity provides insight into the model's ability to discern negative labels accurately.
💡Conclusion
Armed with these metrics derived from the confusion matrix, machine learning practitioners can unravel the intricacies of their models' performance. Whether aiming for precision, recall, or striking a balance between the two, these evaluation metrics serve as guiding stars in the quest for model optimization.
In the ever-evolving landscape of machine learning, understanding and harnessing the power of the confusion matrix metrics pave the way toward building more accurate, reliable, and robust models.
Let's embrace the matrix insights and travel toward predictive excellence.
Subscribe to my newsletter
Read articles from Haocheng Lin directly inside your inbox. Subscribe to the newsletter, and don't miss out.
Written by

Haocheng Lin
Haocheng Lin
💻 AI Developer & Researcher @ Geologix 🏛️ UCL MEng Computer Science (2019 - 23). 🏛️ UCL MSc AI for Sustainable Development (2023 - 24) 🥇 Microsoft Golden Global Ambassador (2023 - 24)🏆